Abstract
Apoptotic cell volume decrease (AVD) and exposure of phosphatidylserine (PtdSer) at the cell surface are early events in apoptosis. However, the ion channels responsible for AVD, and their relationship to PtdSer translocation and cell death are poorly understood. Real-time analysis of calcium-induced apoptosis in lymphocytes and thymocytes showed that AVD occurs rapidly, and precedes PtdSer translocation. Blockers of the K+ channel IKCa1 completely inhibited AVD. Blockade of IKCa1, and hence AVD, also completely prevented PtdSer translocation and cell death. Thus, IKCa1-mediated AVD is the earliest-defined essential step in calcium-induced apoptosis, required for both PtdSer translocation and cell death.
Introdution
Despite a detailed understanding of the later stages of apoptosis, the early steps in this pathway are poorly understood. Apoptosis, including that mediating T-cell deletion, is associated with a rise in cytoplasmic Ca2+ (apoptotic calcium increase (ACI)), apoptotic cell volume decrease (AVD) and changes in plasma membrane lipid distribution (Schanne et al., 1979; Schlegel et al., 2000; Mariathasan et al., 2001; Yu et al., 2001). AVD is achieved by efflux of K+ and Cl− ions and consequent loss of water, and is an early step in apoptosis (Maeno et al., 2000). Whilst several studies have associated apoptosis with loss of K+ ions (Yu et al., 1997; Dallaporta et al., 1999; Trimarchi et al., 2002), the channels responsible for ion efflux in AVD have not been identified. Apoptosis is also characterized by a rapid redistribution of phospholipids (Sims & Wiedmer, 2001). In normal cells, plasma membrane phospholipids are asymmetrically distributed, with phosphatidylserine (PtdSer) and phosphatidylethanolamine primarily in the inner leaflet. Following initiation of apoptosis, PtdSer is translocated to the outer leaflet and is exposed at the cell surface. The mechanism by which PtdSer is translocated is controversial, with reports of a phospholipid scramblase mediating nonspecific bi-directional transport of phospholipids (Sims & Wiedmer, 2001), or of ABC1 acting as an outwardly-directed PtdSer translocase (Hamon et al., 2000).
In this study we aimed to identify the ion channel(s) required for AVD, and use this insight to establish the link, if any, between ACI, AVD and PtdSer translocation in apoptosis. A continuous-flow cytometric method was developed to enable us to monitor simultaneously, in the same population of cells, the kinetics of each of the individual steps in the apoptotic pathway.
Results and Discussion
Murine CD4+ T lymphocytes were used to study calcium-induced apoptosis. A flow cytometric method was developed to enable the study of AVD, PtdSer translocation and cell death in a single population of cells (see Methods). Cell volume changes were measured by forward scatter (FSC-H), a parameter used routinely to measure the size of spherical cells (Vermes et al., 2000). Exposure of PtdSer was monitored by annexin-V binding; cell membrane permeability was measured by the uptake of propidium iodide. CD4+ lymphocytes were studied specifically by labelling lymphocytes with a fluorescent anti-CD4 antibody such that these were the only cells analysed within the population.
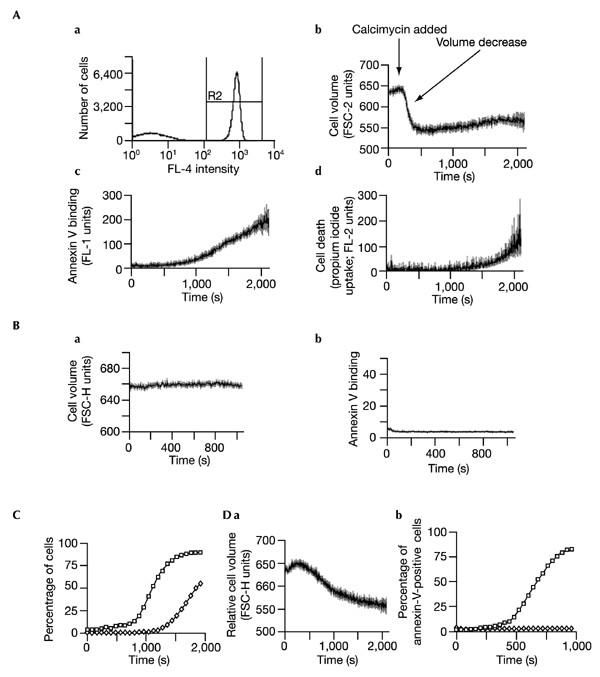
Apoptosis was initiated by the addition of the calcium ionophore calcimycin at the times shown (Fig.1). Calcimycin-induced lymphocyte apoptosis, as with many physiological mechanisms of T cell death, has been shown to be caspase-independent (Bortner and Cidlowski, 1999; Doerfler et al., 2000; Petronilli et al., 2001). As reported by others (Bortner & Cidlowski, 1999; Petronilli et al., 2001), calcimycin-induced cell death was rapid and apoptotic (Fig. 1). Apoptosis was characterized by cell shrinkage, translocation of PtdSer to the cell surface, and ultimately cell breakdown; in contrast, necrosis is characterized by cell swelling and the subsequent rupture of the plasma membrane. Cell shrinkage occurred within three minutes of addition of the ionophore, as indicated by decreased forward scattering of light (Fig. 1A). PtdSer translocation occurred after cell shrinkage (Fig. 1B) and was followed by increased membrane permeability (Fig. 1D). Importantly, cell shrinkage, PtdSer translocation and propidium iodide uptake occurred sequentially. This is illustrated by plotting, on the same graph, as a function of time, the percentages of cells having undergone PtdSer translocation and cell death (Fig. 1E). At low calcimycin concentrations, volume decrease occurred without detectable PtdSer translocation (Fig. 1E), indicating that cell shrinkage is insufficient to induce PtdSer exposure.
Figure 1.

Kinetics of calcium-induced apoptosis. After establishing baselines in the continuous presence of annexin-V–FITC and PtdSer, apoptosis was induced with calcimycin. (A) a, Flow-cytometric gating of cells staining positive with allophycocyanin-conjugated anti-CD4 (R2) in the absence of physical cell separation. R1 (not shown) was used to exclude cell debris. a–d, Changes in cell volume, PtdSer translocation and cell death, monitored simultaneously in the CD4+ lymphocyte population following induction with 1 μM calcimycin. For each parameter, data as a function of time after induction of apoptosis are indicated as a derived line graph (mean units ± s.e.m.). b, Change in cell volume (measured by FSC-H) as a function of time, indicating cell shrinkage. c, Changes in PtdSer exposure at the cell surface, indicated by annexin-V–FITC binding. d, Cell death (membrane permeability) as indicated by propidium iodide uptake. (B) Representative control plots indicating (a) the stability of cell size and (b) annexin-V binding, in the absence of calcimycin stimulation. Variation in responses to calcimycin within any given set of experiments was low. In this experiment, over 17 min there was a fall in control FSC-H of 0.8 units and an increase in the percentage of CD4+ cells binding annexin V from 3% to 3.3%. By contrast, in four experiments on the same day, stimulation with 0.5 μM calcimycin resulted in a fall of FSC-H from 656.7 ± 0.2 to 614.8 ± 2.6 units (mean ± s.d.) and a rise in annexin-V-binding cells from 3% to 72.3 ± 13% (mean ± s.d.). (C) Percentage of CD4+ cells having translocated PtdSer (annexin-V-positive cells, indicated by open squares) or died (propidium iodide-positive cells, indicated by open diamonds), obtained by replotting the data from panels (A) b–d. The background population of cells binding annexin V or taking up propidium iodide before stimulation was excluded from the derived line graphs and from (C). (D) Response to stimulation with low dose calcimycin. Cells were stimulated with 0.2 μM calcimycin. a, Shrinkage of CD4+ cells, indicated by change in FSC-H (mean ± s.e.m.) as a function of time. b, Translocation as a function of time, indicated by the percentage of annexin-V-positive cells (open diamonds). A comparison with increase in percentage of CD4+ cells translocating in response to 0.5 μM calcimycin (open squares) is shown.
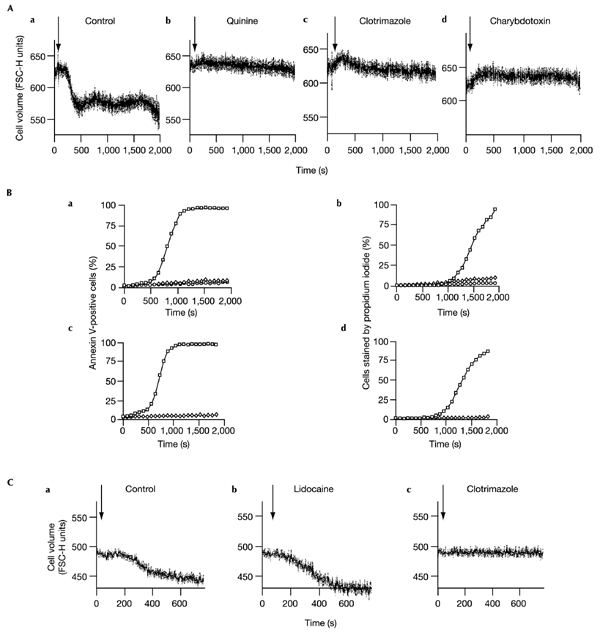
To investigate whether AVD is, however, necessary for PtdSer translocation, we studied the effect of known inhibitors of volume-regulatory K+ channels (Khanna et al., 1999; Weskamp et al., 2000; Niemeyer et al., 2001) on both processes. Quinine, clotrimazole and charybdotoxin are all inhibitors of IKCa1, and though none are entirely IKCa1specific they have no other known shared target. Each inhibited AVD, PtdSer translocation and cell death effectively, at concentrations known to block IKCa1 (Fig. 2). Somewhat higher concentrations of charybdotoxin were required for full inhibition of AVD and PtdSer translocation than have been reported to block IKCa1 currents (15 nM), presumably due to the large cell numbers used in flow cytometry, and simultaneous binding of this toxin to Kv1.3 and BK channels (Khanna et al., 1999; Dick et al., 2001).
Figure 2.

The effects of IKCa1 inhibitors on AVD and translocation. (A) Effect of 0.5 mM quinine (b), 10 μM clotrimazole (c) or 200 nM charybdotoxin (d) on shrinkage of CD4+ cells induced by 1 μM calcimycin in comparison with control cells in the absence of inhibitor (a). Cell volume is indicated by FSC-H units (mean ± s.e.m.). Stimulation with calcimycin is indicated by arrows. (B) Effects of IKCa1 inhibitors on translocation (annexin-V–FITC-binding) and cell death (propidium iodide uptake), following calcimycin stimulation. Analyses were carried out on the same cell population. a, b, Data for a control with no inhibitor (open squares), 0.5 mM quinine (open diamonds), or 10 μM clotrimazole (open circles). c, d, Data for a control with no inhibitor (open squares), and with 200 nM charybdotoxin (open diamonds). (C) Effect of 0.4 mM lidocaine, a TASK-3 inhibitor (b), or 10 μM clotrimazole (c) on shrinkage of CD4+8+ thymocytes induced by 0.2 μM calcimycin, compared with control cells in the absence of inhibitor (a). Cell volume is indicated by forward scatter (mean ± s.e.m. FSC-H units). Time of stimulation with calcimycin is indicated by arrows.
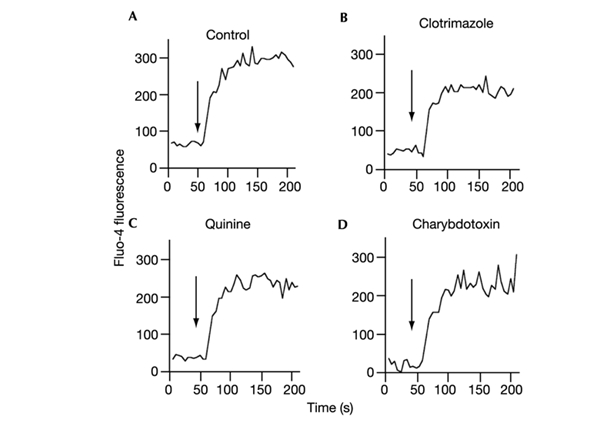
Besides their effects on K+ channels, some of these inhibitors are known to affect Ca2+ channels. For example, clotrimazole inhibits thapsigargin-stimulated, store-operated calcium influx (Benzaquen et al., 1995), and IKCa1 modulates Ca2+ entry into activated T cells (Fanger et al., 2001). Although calcimycin mediates Ca2+ transfer across the plasma membrane, store-operated channels have also been implicated in regulating intracellular Ca2+ concentration following stimulation with this ionophore (Martinez et al., 1999). Therefore, to exclude the possibility that the IKCa1 inhibitors block AVD via an effect on Ca2+ channels, we measured their effects on Ca2+ uptake directly. Of the three IKCa1 inhibitors used, only clotrimazole inhibited Ca2+ uptake under the conditions used, and then only slightly (Fig. 3).
Figure 3.

The effect of IKCa1 inhibitors on Ca2+ uptake by CD4+ lymphocytes. Lymphocytes labelled with the Cychrome-conjugated anti-CD4 antibody were incubated with the Ca2+-indicator Fluo-4 AM, washed, and analysed by flow cytometry. Cells were stimulated with 1 μM calcimycin in the absence of inhibitor (A), or the presence of 10 μM clotrimazole (B), 0.5 mM quinine (C) or 200 nM charybdotoxin (D). An increase in Ca2+ in the cell is indicated by raised Fluo-4 fluorescence. Little or no effect of the IKCa1 inhibitors on Ca2+ influx was seen. Stimulation with calcimycin is indicated by arrows.
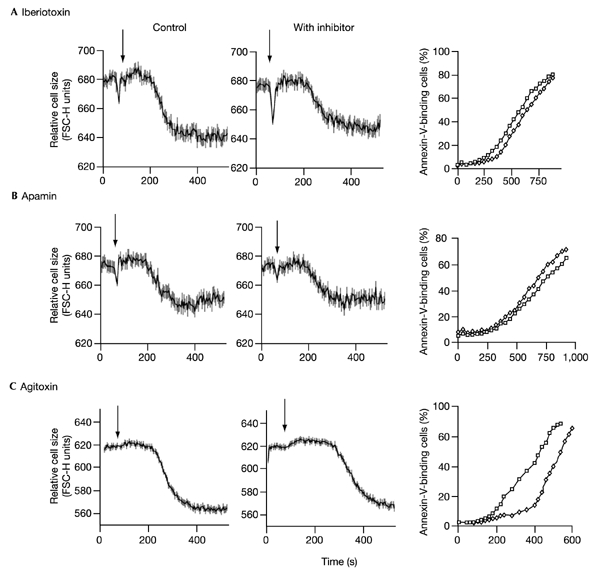
To exclude the potential involvement of K+ channels other than IKCa1 in AVD and PtdSer translocation, we assessed the effects of a variety of other inhibitors. Although no single inhibitor is entirely specific for IKCa1, the spectrum of inhibitors used provided a fingerprint diagnostic of this channel. Agitoxin, a potent inhibitor of Kv1.3, only marginally delayed AVD and PtdSer translocation (Fig. 4), and apamin and iberiotoxin had little or no effect, ruling out a significant role for SKCa (Desai et al., 2000) or BK (Gribkoff et al., 1996). The K+ channel inhibitors lidocaine and XE991, blockers of TASK-3 and KCNQ channels, respectively (Kim et al., 2000; MacVinish et al., 2001), also had no effect on AVD or PtdSer translocation (not shown). As TASK channels are clotrimazole-insensitive (Hoffmann, 2000), while clotrimazole completely blocked AVD and PtdSer translocation, their role, if any, must be negligible. An involvement of TASK-1 in AVD is also unlikely, as this channel is inhibited by calcium-mobilizing agents (Czirjak et al., 2001). In toto, therefore, these data strongly suggest that the actions of quinine, charybdotoxin and clotrimazole are mediated through inhibition of IKCa1, and thus that IKCa1 is the major channel involved in calcium-induced AVD in lymphocytes. Moreover, as blockade of AVD inhibits PtdSer translocation and cell death, the data show that AVD is a necessary early step in the apoptotic pathway.
Figure 4.

The effect of K+ channel inhibitors on AVD and PtdSer translocation (annexin-V-binding) in CD4+ lymphocytes. Apoptosis was induced with calcimycin. K+ channel inhibitors, where used, were added immediately prior to flow cytometry and so were present throughout the assay. The effects of iberiotoxin (100 nM) are shown in (A), apamin (0.5 μM) in (B), and agitoxin (50 nM) in (C). Changes in cell volume in the absence of inhibitor (left-hand column), or the presence of inhibitor (middle column), are shown. The right-hand column shows translocation (annexin-V-binding) in the absence (squares) or presence (diamonds) of inhibitor. Stimulation with calcimycin is indicated by arrows.
The requirement for IKCa1 activity in calcium-induced apoptosis was also apparent in immature thymocytes. Hence, whilst thymocytes were more sensitive to calcimycin than were peripheral lymphocytes, AVD (Fig. 2C), PtdSer translocation and cell death were also completely blocked by inhibitors of IKCa1, but not by those of other of K+ channels tested (data for the effects of lidocaine are shown). Thus, IKCa1 activity in early apoptotic events is not restricted to CD4+ lymphocytes.
PtdSer on the outer leaflet of the plasma membrane acts as a crucial 'eat me' marker for the rapid, immunologically silent removal of apoptotic cells (Savill & Fadok, 2000). As its exposure may therefore mark an in vivo physiological endpoint for dying cells, knowledge of the mechanism, upstream regulation and kinetics of PtdSer translocation and its temporal relationship to other cellular events in the diverse forms of apoptosis is central to the therapeutic manipulation of cell death. In this study we have demonstrated that AVD precedes PtdSer translocation, and that AVD is necessary for both PtdSer translocation and apoptosis. Importantly, inhibition of the intermediate conductance KCa channel IKCa1 inhibited AVD, demonstrating that this channel plays a key role in regulating cell volume and apoptosis, at least in T lymphocytes and thymocytes. Interestingly, IKCa1 has also been shown to have a major role in volume regulation following hypo-osmotic shock (RVD) in lymphocytes (Khanna et al., 1999), and altered regulation of IKCa1 has been implicated in volume regulation in cells lacking the cystic fibrosis transmembrane regulator (Vazquez et al., 2001). Together, these data suggest a mechanistic link between ACI, AVD and RVD, with implications for disease pathophysiology. The early and essential role of IKCa1 in PtdSer translocation and apoptotic cell death suggests that this K+ channel is a potential therapeutic target in immune-related diseases marked by aberrant apoptosis or apoptotic cell clearance.
Methods
Simultaneous monitoring of AVD, translocation and cell death.
Mesenteric lymph node cells were isolated from adult mice (FVB/n; 6–14 weeks), and lymphocytes suspended (107 ml−1) in HEPES-buffered, phenol-red-free DMEM (Sigma). Cells were stained with an allophycocyanin-conjugated antibody specific for the T cell marker CD4 (Becton Dickinson), and were washed and resuspended in DMEM supplemented with BSA. Cells were equilibrated with propidium iodide and annexin-V–fluorescein isothiocyanate (FITC) (both Becton Dickinson) for 4 min and analysed by flow cytometry on a FACScalibur machine using CellQuest software (Becton Dickinson). The use of allophycocyanin-conjugated anti-CD4 permitted analysis to be restricted to CD4+ lymphocytes. Multiparameter FACS analysis permitted simultaneous analysis of cell membrane permeability (propidium iodide uptake (detected in channels FL-2 and FL-3), an indicator of cell death), cell volume (FSC-H) and PtdSer exposure to the cell surface (annexin-V–FITC binding, FL-1). Baseline fluorescence was established for approximately 1 min prior to addition of calcimycin (Sigma) and/or other reagents (as indicated) to initiate apoptosis. FSC-H is used routinely as a measure of the size of spherical cells (Vermes et al., 2000), its sensitivity being greatest when light is collected over an angle of less than 10° (Ormerod et al., 1995) as in the FACScalibur. Debris was excluded from analysis on the basis of forward- and sidescatter. Continuous line graphs of changes in cell size (FSC-H), annexin-V–FITC binding (FL1-H) and propidium iodide uptake (FL3-H) were plotted using FCSPress software (FCSPress.com). For analysis of thymocytes, cells were prepared as above and stained with allophycocyanin-conjugated anti-CD4 and phycoerythrin-conjugated anti-CD8 (Becton Dickinson).
Potassium channel inhibitors.
Charybdotoxin, iberiotoxin, lidocaine, quinine, clotrimazole and apamin were all obtained from Sigma. Agitoxin was from Alomone, and XE991 was a gift from A. Cuthbert. Preliminary experiments showed that diluents had no effect on either AVD or PtdSer translocation (data not shown). All experiments were performed within 3–4 h of lymph node isolation to minimize the potential influence of non-experimental apoptotic stimuli, for example, that due to serum starvation. Consequently, each reagent was assessed on at least three occasions, and inhibition was scored only when PtdSer translocation and volume decrease compared with control samples was slowed or diminished on each of these occasions. Whilst variability was low on any given occasion, and the degree of inhibition for any given reagent was similar between experiments, as experiments were often necessarily performed on different days, it was not valid to define the s.e.m. of any given parameter. To avoid the potential complication that differences may exist in responses of naive (CD45RBloCD44hi) and memory (CD45RBhiCD44lo) cells and that frequencies of these populations differ somewhat between individuals, only results obtained using lymph node cells from the same mouse were directly compared.
Analysis of Ca2+-uptake.
Lymphocytes were stained with Cychrome-conjugated anti-CD4 antibody (Becton Dickinson) to restrict analysis to a relatively homogeneous T cell population, and incubated for 15 min with a 0.3 μM solution of the calcium-sensitive fluorescent indicator Fluo-4 AM (Molecular Probes). Cells were washed twice and resuspended in phenol-red-free DMEM in the presence or absence of IKCa1 inhibitors as indicated, and baseline fluorescence was established by flow cytometry on a FACScan using CellQuest software. Apoptosis was initiated by addition of 1 μM calcimycin and the calcium-dependent increase in Fluo-4 fluorescence monitored in the CD4+ cell population. To ensure the equivalence of Fluo-4 loading, different aliquots of the same Fluo-4-loaded cell suspension were used for each experiment. All results shown are representative of at least three separate experiments.
Acknowledgments
We thank M. Merkenschlager and A. Sardini for discussions. This work was funded by the Medical Research Council of Great Britain.
References
- Benzaquen L.R., Brugnara C., Byers H.R., Gatton-Celli S. & Halperin J.A. (1995) Clotrimazole inhibits cell proliferation in vitro and in vivo. Nature Med., 1, 534–540. [DOI] [PubMed] [Google Scholar]
- Bortner C.D. & Cidlowski J.A. (1999) Caspase independent/dependent regulation of K(+), cell shrinkage, and mitochondrial membrane potential during lymphocyte apoptosis. J. Biol. Chem., 274, 21953–21962. [DOI] [PubMed] [Google Scholar]
- Czirjak G., Petheo G.L., Spat A. & Enyedi P. (2001) Inhibition of TASK-1 potassium channel by phospholipase C. Am. J. Physiol. Cell. Physiol., 281, C700–C708. [DOI] [PubMed] [Google Scholar]
- Dallaporta B. et al. (1999) Plasma membrane potential in thymocyte apoptosis. J. Immunol., 162, 6534–6542. [PubMed] [Google Scholar]
- Desai R., Peretz A., Idelson H., Lazarovici P. & Attali B. (2000) Ca2+-activated K+ channels in human leukemic Jurkat T cells. Molecular cloning, biochemical and functional characterization. J. Biol. Chem., 275, 39954–39963. [DOI] [PubMed] [Google Scholar]
- Dick G.M., Rossow C.F., Smirnov S., Horowitz B. & Sanders K.M. (2001) Tamoxifen activates smooth muscle BK channels through the regulatory beta 1 subunit. J. Biol. Chem., 276, 34594–34599. [DOI] [PubMed] [Google Scholar]
- Doerfler P., Forbush K.A. & Perlmutter R.M. (2000) Caspase enzyme activity is not essential for apoptosis during thymocyte development. J. Immunol., 164, 4071–4079. [DOI] [PubMed] [Google Scholar]
- Fanger C.M. et al. (2001) Calcium-activated potassium channels sustain calcium signaling in T lymphocytes. Selective blockers and manipulated channel expression levels. J. Biol. Chem., 276, 12249–12256. [DOI] [PubMed] [Google Scholar]
- Gribkoff V.K. et al. (1996) Effects of channel modulators on cloned large-conductance calcium-activated potassium channels. Mol. Pharmacol., 50, 206–217. [PubMed] [Google Scholar]
- Hamon Y. et al. (2000) ABC1 promotes engulfment of apoptotic cells and transbilayer redistribution of phosphatidylserine. Nature Cell Biol., 2, 399–406. [DOI] [PubMed] [Google Scholar]
- Hoffmann E.K. (2000) Intracellular signalling involved in volume regulatory decrease. Cell. Physiol. Biochem., 10, 273–288. [DOI] [PubMed] [Google Scholar]
- Khanna R., Chang M.C., Joiner W.J., Kaczmarek L.K. & Schlichter L.C. (1999) hSK4/hIK1, a calmodulin-binding KCa channel in human T lymphocytes. Roles in proliferation and volume regulation. J. Biol. Chem., 274, 14838–14849. [DOI] [PubMed] [Google Scholar]
- Kim Y., Bang H. & Kim D. (2000) TASK-3, a new member of the tandem pore K+ channel family. J. Biol. Chem., 275, 9340–9347. [DOI] [PubMed] [Google Scholar]
- MacVinish L.J., Guo Y., Dixon A.K., Murrell-Lagnado R.D. & Cuthbert A.W. (2001) Xe991 reveals differences in K+ channels regulating chloride secretion in murine airway and colonic epithelium. Mol. Pharmacol., 60, 753–760. [PubMed] [Google Scholar]
- Maeno E., Ishizaki Y., Kanaseki T., Hazama A. & Okada Y. (2000) Normotonic cell shrinkage because of disordered volume regulation is an early prerequisite to apoptosis. Proc. Natl Acad. Sci. USA, 97, 9487–9492. [DOI] [PMC free article] [PubMed] [Google Scholar]
- Mariathasan S. et al. (2001) Duration and strength of extracellular signal-regulated kinase signals are altered during positive versus negative thymocyte selection. J. Immunol., 167, 4966–4973. [DOI] [PubMed] [Google Scholar]
- Martinez M.C. et al. (1999) Significance of capacitative Ca2+ entry in the regulation of phosphatidylserine expression at the surface of stimulated cells. Biochemistry, 38, 10092–10098. [DOI] [PubMed] [Google Scholar]
- Niemeyer M.I., Cid L.P., Barros L.F. & Sepulveda F.V. (2001) Modulation of the two-pore domain acidsensitive K+ channel TASK-2 (KCNK5) by changes in cell volume. J. Biol. Chem., 276, 43166–43174. [DOI] [PubMed] [Google Scholar]
- Ormerod M.G., Paul F., Cheetham M. & Sun X.M. (1995) Discrimination of apoptotic thymocytes by forward light scatter. Cytometry, 21, 300–304. [DOI] [PubMed] [Google Scholar]
- Petronilli V., Penzo D., Scorrano L., Bernardi P. & Di Lisa F. (2001) The mitochondrial permeability transition, release of cytochrome c and cell death. Correlation with the duration of pore openings in situ. J. Biol. Chem., 276, 12030–12034. [DOI] [PubMed] [Google Scholar]
- Savill J. and Fadok V. (2000) Corpse clearance defines the meaning of cell death. Nature, 407, 784–788. [DOI] [PubMed] [Google Scholar]
- Schanne F.A., Kane A.B., Young E.E. & Farber J.L. (1979) Calcium dependence of toxic cell death: a final common pathway. Science, 206, 700–702. [DOI] [PubMed] [Google Scholar]
- Schlegel R.A., Callahan M.K. & Williamson P. (2000) The central role of phosphatidylserine in the phagocytosis of apoptotic thymocytes. Ann. N. Y. Acad. Sci., 926, 217–225. [DOI] [PubMed] [Google Scholar]
- Sims P.J. & Wiedmer T. (2001) Unraveling the mysteries of phospholipid scrambling. Thromb. Haemost., 86, 266–275. [PubMed] [Google Scholar]
- Trimarchi J.R., Liu L., Smith P.J. & Keefe D.L. (2002) Apoptosis recruits two-pore domain potassium channels used for homeostatic volume regulation. Am. J. Physiol. Cell. Physiol., 282, C588–C594. [DOI] [PubMed] [Google Scholar]
- Vazquez E., Nobles M. & Valverde M.A. (2001) Defective regulatory volume decrease in human cystic fibrosis tracheal cells because of altered regulation of intermediate conductance Ca2+-dependent potassium channels. Proc. Natl Acad. Sci. USA, 98, 5329–5334. [DOI] [PMC free article] [PubMed] [Google Scholar]
- Vermes I., Haanen C. & Reutelingsperger (2000) Flow cytometry of apoptotic cell death. J. Immunol. Methods, 243, 167–190. [DOI] [PubMed] [Google Scholar]
- Weskamp M., Seidl W. & Grissmer S. (2000) Characterization of the increase in [Ca2+]i during hypotonic shock and the involvement of Ca2+-activated K+ channels in the regulatory volume decrease in human osteoblast-like cells. J. Membr. Biol., 178 11–20. [DOI] [PubMed] [Google Scholar]
- Yu S.P., Canzoniero L.M. & Choi D.W. (2001) Ion homeostasis and apoptosis. Curr. Opin. Cell. Biol., 13, 405–411. [DOI] [PubMed] [Google Scholar]
- Yu S.P. et al. (1997) Mediation of neuronal apoptosis by enhancement of outward potassium current. Science, 278, 114–117. [DOI] [PubMed] [Google Scholar]


