Abstract
The dynamics of the interaction of the insulin receptor with a substrate-trapping mutant of protein-tyrosine phosphatase 1B (PTP1B) were monitored in living human embryonic kidney cells using bioluminescence resonance energy transfer (BRET). Insulin dose-dependently stimulates this interaction, which could be followed in real time for more than 30 minutes. The effect of insulin on the BRET signal could be detected at early time-points (30 seconds), suggesting that in intact cells the tyrosine-kinase activity of the insulin receptor is tightly controlled by PTP1B. Interestingly, the basal (insulin-independent) interaction of the insulin receptor with PTP1B was much weaker with a soluble form of the tyrosine-phosphatase than with the endoplasmic reticulum (ER)-targeted form. Inhibition of insulin-receptor processing using tunicamycin suggests that the basal interaction occurs during insulin-receptor biosynthesis in the ER. Therefore, localization of PTP1B in this compartment might be important for the regulation of insulin receptors during their biosynthesis.
Introduction
Insulin is a pancreatic hormone that controls energy metabolism in liver, muscle and adipose tissue. Binding of insulin to its receptor induces autophosphorylation of the receptor on tyrosine residues. This stimulates the tyrosine-kinase activity of the receptor, which has a crucial role in the transmission of the signal (Combettessouverain & Issad, 1998). Termination of the signal involves inactivation of the insulin receptor (IR) kinase by dephosphorylation of three tyrosine residues located in the activation loop of the receptor (King & Sale, 1990). Importantly, it has been shown that internalized IRs are fully active tyrosine kinases that are deactivated as they traverse intracellular structures (Klein et al., 1987). Protein-tyrosine phosphatase 1B (PTP1B) is a protein-tyrosine phosphatase predominantly localized on intracellular membranes by means of a hydrophobic carboxy-terminal targeting sequence (Frangioni et al., 1992). Evidence for the involvement of PTP1B in insulin action has been provided by studies showing that increased insulin sensitivity is associated with higher levels of tyrosine phosphorylation of the IR and one of its substrates, IR substrate 1 (IRS1), in the liver and skeletal muscle of insulin-treated Ptp1B knockout mice (Elchebly et al., 1999). Because PTP1B could be a potential therapeutic target, a better understanding of the interaction between the IR and PTP1B is an important requirement for the development of compounds to improve insulin sensitivity. However, although PTP1B has been shown to interact physically with the IR (Bandyopadhyay et al., 1997), nothing is known about the dynamics of this interaction in living cells.
Bioluminescence resonance energy transfer (BRET) allows the study of protein–protein interactions in intact living cells (Angers et al., 2000; Xu et al., 1999). To study the interaction between two proteins, one of them is fused to Renilla luciferase (Rluc) and the other to a yellow fluorescent protein (YFP). The luciferase is excited by a substrate (coelenterazine). If the two proteins are less than 100 Å apart, energy transfer occurs between the luciferase and the YFP, and a signal emitted by the YFP can be detected. We previously showed that this methodology can be used to monitor insulin-induced conformational changes within the IR (Boute et al., 2001). Here, we show that BRET can be used to monitor, in real time, the interaction between the IR and a substrate-trapping mutant of PTP1B in intact living cells.
Results and Discussion
Protein-tyrosine phosphatases are characterized by conserved catalytic domains that contain invariant residues. Mutagenesis studies have shown that conversion of the invariant Asp residue at amino-acid position 181 of PTP1B (located in the catalytic site) into alanine (substitution D181A) inhibits PTP1B enzymatic activity and converts the enzyme into a substrate trap that binds to, but cannot efficiently dephosphorylate, tyrosine-phophorylated proteins (Flint et al., 1997).
In this study, the amino-terminal regions of either wild-type PTP1B or the D181A mutant were fused to YFP (YFP–PTP1B and YFP–PTPB1–D181A, respectively). As shown in Fig. 1B and C, the intracellular and perinuclear localization of these fusion proteins is consistent with their association with the endoplasmic reticulum (ER), in agreement with the known targeting of PTP1B to this compartment by its C-terminal region (see also supplementary information online).
Figure 1.

Expression of yellow fluorescent protein (YFP) fusion constructs in human embryonic kidney (HEK)-293 cells. Cells were transfected with complementary DNAs encoding either YFP or YFP-tagged protein-tyrosine phosphatase 1B (PTP1B) constructs. Expression of YFP in HEK-293 cells results in a fluorescent signal distributed uniformly throughout the cell (A). Expression of wild-type YFP–PTP1B (B) or YFP–PTP1B–D181A (C) results in an intracellular and perinuclear distribution of the fluorescence.
BRET measurements were carried out in human embryonic kidney (HEK) cells expressing a fusion of the IR to Rluc (IR–Rluc), and either YFP–PTP1B or YFP–PTP1B–D181A. In the absence of insulin, a basal BRET signal could be detected with both of the YFP fusion proteins. This signal was much weaker with YFP–PTP1B than with YFP–PTP1B–D181A despite similar levels of expression, which were determined by measuring YFP fluorescence (Fig. 2A). As shown in Fig. 2B, the dynamics of the interaction between IR-luc and the PTP1B fusion proteins were followed in real time. In the absence of insulin, the BRET signal increased steadily over time for both YFP–PTP1B- and YFP–PTP1B–D181A-expressing cells. The reasons for this drift in BRET signal are unclear. Insulin had no effect on the BRET signal in cells co-expressing IR–Rluc and YFP–PTP1B, whereas it markedly increased the association of IR–Rluc with YFP–PTP1B–D181A. After 20 min of stimulation with insulin, the insulin-induced BRET signal (the increase in BRET signal from the basal value at the same time-point) was 196.0 ± 9.0 milli BRET units (mBU) (n = 5) for YFP–PTP1B–D181A as compared with 4.5 ± 1.2 mBU (n = 5) for the wild-type PTP1B construct. This result suggests that whereas the insulin-induced interaction between the IR and wild-type active PTPB1 is too transitory to produce an increase in BRET signal, this interaction is stabilized when a substrate-trapping mutant form of PTP1B with impaired enzymatic activity is used.
Figure 2.
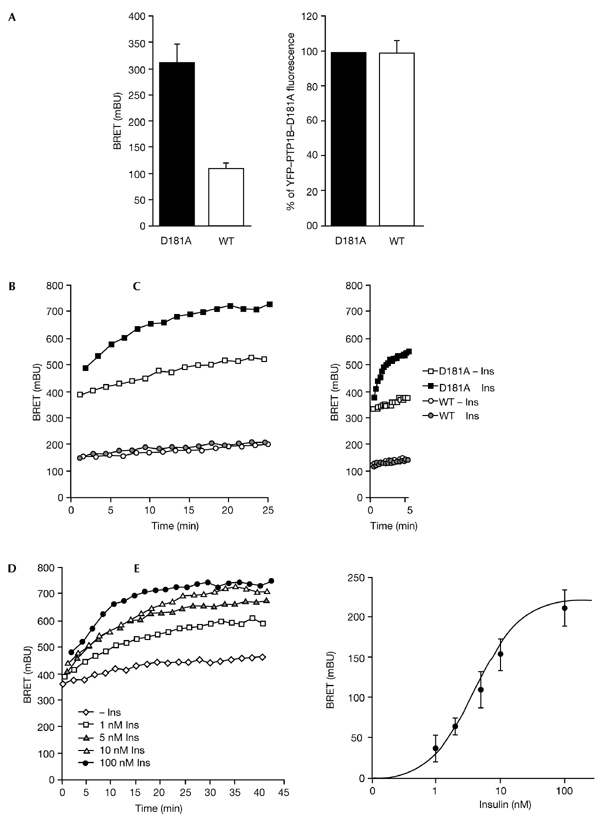
Dynamics of the interaction between the insulin receptor (IR) and protein-tyrosine phosphatase 1B (PTP1B) in intact living cells. (A) Basal bioluminescence resonance energy transfer (BRET) signal (left panel) and yellow fluorescent protein (YFP) fluorescence (right panel) in human embryonic kidney (HEK) cells co-expressing IR–Rluc—a fusion of the IR to Renilla luciferase (Rluc)—and YFP-tagged forms of either wild-type (WT) PTP1B or the D181A mutant form of PTP1B. Results are expressed as the mean ± s.e.m. (n = 5). (B) HEK cells co-expressing IR–Rluc and either YFP–PTP1B or YFP–PTP1B–D181A were incubated either in the absence of insulin, or in the presence of 100 nM insulin. (C) Early effect of insulin on the interaction between the IR and PTP1B. Results are representative of at least five independent experiments. (D) Dose-dependent effect of insulin on the interaction of the IR with the YFP–PTP1B–D181A substrate-trapping mutant. HEK cells were incubated either in the absence of insulin or the presence of different concentrations of insulin. (E) Dose-response curve of the insulin-induced BRET signal at t=20 min. Results are the mean ± s.e.m. of 4–7 independent experiments. Ins, insulin.
This method also allowed us to study the effect of insulin on the BRET signal at early time-points (Fig. 2C). We observed that the insulin-induced interaction between IR–Rluc and YFP–PTP1B–D181A occurs rapidly in cells, as it could be detected 30 s after addition of insulin. This is consistent with work showing that internalized IRs can be detected within 30 s to 1 min after addition of insulin (Burgess et al., 1992; Khan et al., 1989). During the preparation of this manuscript, Haj et al. (2002) have shown that the interaction between epidermal growth factor (EGF) or platelet-derived growth factor (PDGF) receptors and PTP1B can be visualized in cells stably expressing a PTP1B D181A mutant protein after transiently transfecting these cells with GFP-tagged EGF or PDGF receptors (Haj et al., 2002). The interactions between these receptor tyrosine-kinases and PTP1B were detected by fluorescence resonance energy transfer (FRET) after fixation, permeabilization, and incubation of cells with a sulphoindocyanine (Cy3)-conjugated anti-PTP1B antibody. However, these interactions were only detected after 10 min of incubation with the cognate ligands. This is surprising because in a more recent paper, using the same cell system, Haj et al. observed that 1 min after addition of the ligands the tyrosine phosphorylation of EGF and PDGF receptors was markedly increased in fibroblasts derived from PTP1B knockout mice compared with control cells (Haj et al., 2003). This showed that the interaction of these receptors with PTP1B must occur very rapidly. The failure to detect interactions at early time-points in their initial study could result from the lower sensitivity of the technique, which involves optical detection after invasive manipulation of the cells, consisting of permeabilization followed by incubation with a PTP1B antibody.
The high level of sensitivity of the BRET method (Boute et al., 2002) was further demonstrated in dose-response experiments showing that low concentrations of insulin stimulate the interaction between the IR and YFP–PTP1B–D181A (Fig. 2D). A half-maximal effect (Fig. 2E) was observed at 5.4 ± 1.3 nM insulin (n = 7), which is consistent with the effector concentration required for the half-maximal response of insulin as measured by autophosphorylation of the receptor (Boute et al., 2001).
Treatment of HEK cells with hydrogen peroxide showed that our methodology enables the study of the effect of inhibitors of PTP1B on its interaction with the IR (see supplementary information online). We also observed that the effect of insulin on the BRET signal was impaired by an inhibitor of IR autophosphorylation, the tyrphostin AG1024 (see supplementary information online). Moreover, AG1024 also inhibits the basal BRET signal, suggesting that part of this signal is due to an interaction that occurs because of an insulin-independent autophosphorylation of the receptor.
To further explore the mechanisms responsible for the high level of insulin-independent interaction between the PTP1B D181A mutant and the IR seen in our experiments, HEK cells were co-transfected with a fixed amount of IR–Rluc and varied amounts of YFP–PTP1B–D181A (Fig. 3). We found that increasing the level of YFP–PTP1B–D181A expression resulted in an increased basal BRET signal, without any detectable change in the insulin-induced BRET signal. Because it localizes to the ER, one of the functions of PTP1B could be to regulate ligand-independent phosphorylation of insulin receptors during their biosynthesis and maturation (Lammers et al., 1993). An insulin-independent interaction such as this may contribute to the basal BRET signal. Confocal microscopy experiments indicated that in the absence of stimulation with insulin, a significant amount of insulin receptors do indeed colocalize with YFP–PTP1B–D181A in the ER (see supplementary information online). We reasoned that if the basal BRET signal corresponds to an interaction that takes place in the ER, the basal signal should be lower in cells that express a form of PTP1B that is not targeted to this compartment. To test this hypothesis, we made a soluble form of YFP–PTP1B–D181A in which the hydrophobic C-terminal segment was replaced by a hydrophilic segment (YFP–PTP1B–D181A-Cter). Fluorescence microscopy revealed that YFP–PTP1B–D181A–Cter does not localize in the ER, but distributes uniformly within the cell (data not shown). HEK cells were co-transfected with IR–Rluc and either YFP–PTP1B–D181A or YFP–PTP1B–D181A–Cter. We found that the basal BRET signal was markedly reduced when PTP1B–D181A was not directed to the ER, despite similar levels of expression of the two proteins (Fig. 4A). These results show that the insulin-independent interaction between PTP1B and the IR does indeed depend on localization of PTP1B to the ER.
Figure 3.
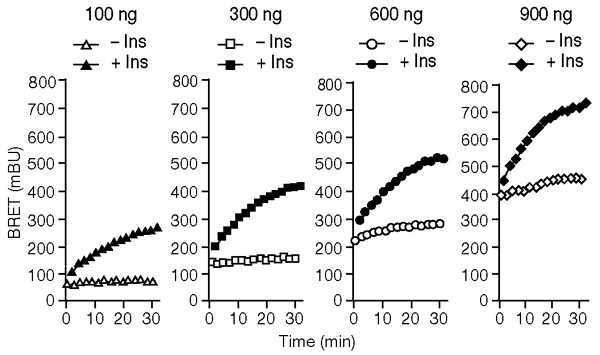
Effect of expressing increasing amounts of a yellow fluorescent protein (YFP)-tagged form of the PTP1B D181A-mutant protein (YFP–PTP1B–D181A) in human embryonic kidney cells. The bioluminescence resonance energy transfer (BRET) signal was measured, either in the absence of insulin or in the presence of 100 nM insulin, in cells co-expressing IR–Rluc—a fusion of the insulin receptor (IR) to Renilla luciferase Rluc. For each transfection, 300 ng of IR–Rluc DNA was used. Different amounts of YFP–PTP1B–D181A DNA (100 ng, 300 ng, 600ng and 900 ng) were used in each transfection. Results are representative of three independent experiments. Ins, insulin.
Figure 4.
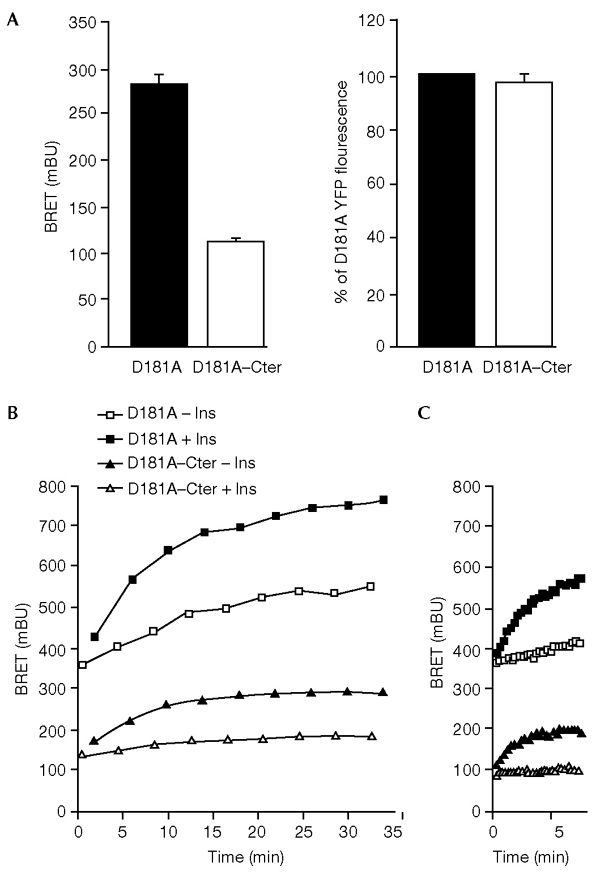
Interaction of the insulin receptor (IR) with the soluble and endoplasmic-reticulum-targeted forms of the protein-tyrosine phosphatase 1B (PTP1B) D181A mutant protein. (A) Basal bioluminescence resonance energy transfer (BRET) signal (left panel) and yellow fluorescent protein (YFP) fluorescence (right panel) in human embryonic kidney (HEK) cells co-expressing IR–Rluc—a fusion of the insulin receptor (IR) to Renilla luciferase—and YFP-tagged fusions of either the D181A mutant protein (YFP–PTP1B–D181A) or a soluble form of this mutant protein (YFP–PTP1B–D181A–Cter). Results are expressed as the mean ± s.e.m. (n = 6). (B) HEK cells co-transfected with IR–Rluc and either YFP–PTP1B–D181A or YFP–PTP1B–D181A–Cter were incubated either in the absence of insulin or in the presence of 100 nM insulin. BRET was used to measure the interaction between IR–Rluc and the PTP1B–D181A proteins. (C) Comparison of the initial rate of association of the IR with either PTP1B–D181A or PTP1B–D181A–Cter. Results are representative of at least three independent experiments. Ins, insulin.
This was further confirmed by subcellular fractionation of HEK cells co-expressing IR–Rluc and YFP–PTP1B–D181A, which showed that the BRET signal markedly increases in calnexin-enriched fractions (see supplementary information online). No such increase was observed in calnexin-enriched fractions from HEK cells co-expressing IR–Rluc and YFP–PTP1B–D181A–Cter.
To confirm that the high basal BRET signal obtained with YFP–PTP1B–D181A corresponds to an interaction that takes place in the ER during biosynthesis of the insulin receptor, HEK cells transfected with IR–Rluc and either YFP–PTP1B–D181A or YFP–PTP1B–D181A–Cter were treated with tunicamycin. It has been shown that treatment with this inhibitor of N-glycosylation inhibits IR processing and results in the accumulation of an unglycosylated IR precursor in the ER (Olson et al., 1988). Western-blotting experiments confirmed that tunicamycin treatment leads to decreased expression of mature IR–Rluc, associated with an increased expression of its uncleaved precursor (data not shown). A 48-h treatment with tunicamycin resulted in a substantial decrease in total luciferase activity and YFP fluorescence in HEK cells co-expressing IR–Rluc and either YFP–PTP1B–D181A or YFP–PTP1B–D181A–Cter (Fig. 5A). However, whereas tunicamycin treatment resulted in a marked decrease in the basal BRET signal in YFP–PTP1B–D181A–Cter-expressing cells, it markedly increased the basal BRET signal in YFP–PTP1B–D181A-expressing cells (Fig. 5B). Thus, accumulation of the IR precursor in the ER seems to increase its basal interaction with YFP–PTP1B–D181A, whereas this interaction is reduced for YFP–PTP1B–D181A–Cter. This result strongly suggests that the elevated basal BRET signal in YFP–PTP1B–D181A-expressing cells is attributable to an interaction of PTP1B with the IR during its biosynthesis in the ER. As expected (Olson et al., 1988), the effect of insulin on the BRET signal was abolished in both cases because of inhibition of expression of the insulin receptor in the plasma membrane under these conditions (data not shown).
Figure 5.
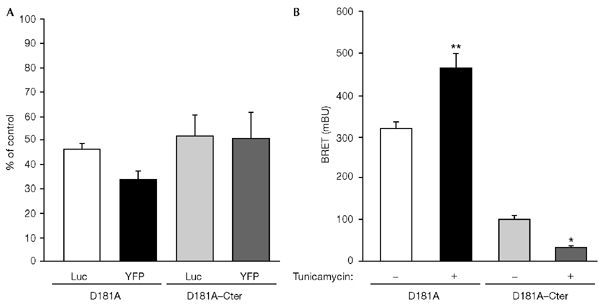
Effect of tunicamycin on basal bioluminescence resonance energy transfer (BRET) signal. Human embryonic kidney cells were cotransfected with a fusion of the insulin receptor (IR) to Renilla luciferase (IR–Rluc) and yellow fluorescent protein (YFP)-tagged fusions of either the protein-tyrosine phosphatase 1B (PTP1B) D181A mutant protein (YFP–PTP1B–D181A) or a soluble form of this mutant protein (YFP–PTP1B–D181A–Cter). Transfected cells were cultured for 48 h either in the absence of tunicamycin, or in the presence of 1 μg ml−1 of tunicamycin. (A) Luciferase activity (Luc) and YFP fluorescence in tunicamycin-treated cells expressed as a percentage of the levels obtained in untreated cells. Results are expressed as the mean ± s.e.m. (n = 4). (B) Basal BRET signal in control (untreated) and tunicamycin-treated cells. Results are expressed as the mean ± s.e.m. (n = 6). *, P < 0.05; **, P < 0.001.
Because the soluble form of PTP1B–D181A is likely to interact with IRs even before their internalization, we expected this interaction to occur more quickly than that between IR and the ER-targeted form of PTPB-D181A. However, the initial rate of association was not increased with YFP–PTP1B–D181A–Cter (see Fig. 4B). This prompted us to determine whether internalization was indeed necessary for interaction of the insulin receptor with the ER-associated PTP1B–D181A. Concanavalin A is a lectin that is known to stimulate the autophosphorylation of the insulin receptor (Shiba et al., 1990). We used concanavalin-A-agarose beads (ConA-agarose) as a non-internalizable ligand (as determined by light microscopy, a single ConA-agarose bead is much larger than a HEK cell). We found that ConA-agarose only modestly stimulates the BRET signal in HEK cells expressing YFP–PTP1B–D181A, whereas a much stronger BRET signal was obtained with YFP–PTP1B–D181A–Cter (Fig. 6A and B). Indeed, 25 min after addition of ConA-agarose, the increase in BRET signal above the basal level in cells expressing YFP–PTP1B–D181A was only 19.4 ± 5.8% of the insulin-induced signal, whereas this increase was 74.3 ± 4.1% of the insulin-induced signal in cells expressing YFP–PTP1B–D181A–Cter (Fig. 6C). Moreover, as concanavalin A has also been shown to inhibit ligand-induced internalization of plasma membrane receptors (Gicquiaux et al., 2002), we wanted to determine whether ConA-agarose would inhibit the effect of insulin on the BRET signal. Cells were pre-incubated for 20 min in the presence of ConA-agarose and then stimulated for 10 min with 5 nM insulin. In cells expressing YFP–PTP1B–D181A, we found that the insulin-induced BRET signal was markedly inhibited by ConA-agarose, whereas it was not inhibited in cells expressing YFP–PTP1B–D181A–Cter (Fig. 6D). These results suggest that internalization of the IR is indeed an important requirement for its interaction with the ER-targeted form of PTP1B.
Figure 6.
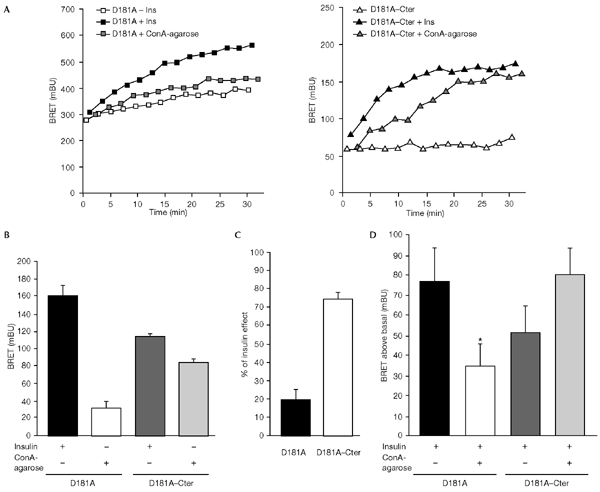
Effect of concanavalin A (ConA)-agarose on the interaction of the insulin receptor (IR) with the soluble and endoplasmic-reticulum (ER)-targeted forms of the protein-tyrosine phosphatase 1B (PTP1B) D181A mutant, as measured by bioluminescence resonance energy transfer (BRET). Cells were stimulated with either ConA-agarose (25 μl of beads per well) or 100 nM insulin. (A) A representative experiment is shown; results for the ER-targeted form of the D181A mutant are shown in the left panel, and those for the soluble form (D181A–Cter) in the right panel. (B) Results of seven or eight independent experiments carried out as described in (A) with BRET measurements taken at t = 25 min are shown, expressed as the mean ± s.e.m. (C) Data from (B) expressed as a percentage of the insulin-induced BRET signal. (D) Human embryonic kidney cells co-transfected with a fusion of the IR to Renilla luciferase (IR–Rluc) and either YFP–PTP1B–D181A or YFP–PTP1B–D181A–Cter were pre-incubated for 20 min in the absence or presence of ConA-agarose. Cells were then incubated for 10 min with 5 nM insulin. The level of the BRET signal above the basal level is shown. Results are expressed as the mean ± s.e.m. of 3–5 independent experiments (*, P < 0.05 when compared with cells not pre-incubated with ConA-agarose). Ins, insulin.
Interestingly, the insulin-induced BRET signal (Fig. 4B) was significantly higher with the ER-targeted PTP1B than with the soluble form (20 min after insulin addition, the mean signal ± s.e.m. was 168.6 ± 10.1 mBU for YFP–PTP1B–D181A as compared with 105.8 ±6.9 mBU for YFP–PTP1B–D181A–Cter; n = 5, p < 0.001). To determine whether this corresponded to a stronger association of IR–Rluc with the ER-targeted form of YFP–PTP1B–D181A, HEK cells co-transfected with IR–Rluc and either YFP–PTP1B–D181A or YFP–PTP1B–D181A–Cter were stimulated with insulin. IR–Rluc was immunoprecipitated with an anti-IR antibody. Western blotting with an anti-PTP1B antibody showed that both forms of the PTP1B–D181A protein could be co-immunoprecipitated with the insulin receptor. However, the amount of PTP1B–D181A co-immunoprecipitated with the IR did not seem to be higher for the ER-targeted form than for the soluble form, either in the absence or presence of insulin (Fig. 7). Thus, it is possible that the lower level of insulin-induced BRET signal observed with YFP–PTP1B–D181A–Cter is due to a structural effect rather than differences in the efficiency of the association. Indeed, the strength of the BRET signal depends not only on the distance between the two partners, but also on their relative orientation (Boute et al., 2002). Alternatively, co-immunoprecipitation of IR with PTP1B involves extraction of membrane proteins with a detergent, incubations and washing steps, which could result in loss of interaction between the two proteins. Indeed, we observed that the extraction of proteins for co-immunoprecipitation markedly reduced the basal and insulin-induced BRET signal with both YFP–PTP1B–D181A and YFP–PTP1B–D181A–Cter. This further emphasizes the importance of using a methodology that allows the study of the interaction between protein partners in their natural subcellular environment.
Figure 7.
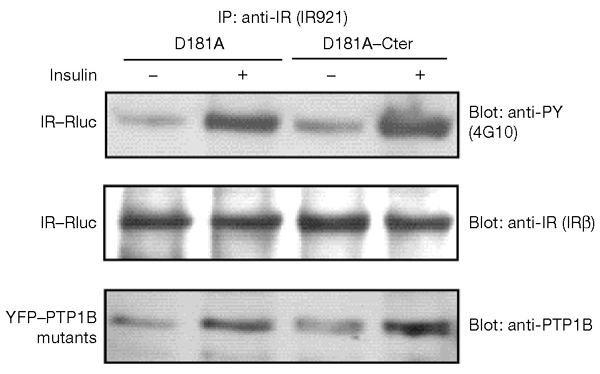
Co-immunoprecipitation of yellow fluorescent protein (YFP)-tagged endoplasmic-reticulum (ER)-targeted and soluble forms of the protein-tyrosine phosphatase 1B (PTP1B) D181A mutant with the insulin receptor (IR). Human embryonic kidney cells co-expressing a fusion of the IR to Renilla luciferase (IR–Rluc) and either the ER-targeted form (D181A) or the soluble form (D181A–Cter) of PTP1B D181A were incubated for 10 min either in the absence of insulin, or in the presence of 100 nM insulin. Immunoprecipitation was carried out using the IR921 antibody. The amounts of IR–Rluc and PTP1B D181A mutant proteins in the immunoprecipitates were assessed by immunoblotting with anti-IR and anti-PTP1B antibodies. Results are representative of three independent experiments.
In summary, we have used the BRET methodology to follow the dynamics of the interaction of the IR with PTP1B. We have shown that the insulin-induced interaction of IR with PTP1B occurs very quickly. We have also shown that an insulin-independent interaction occurs between PTP1B and the IR. This interaction may be important to avoid autoactivation of the IR during its biosynthesis.
Methods
Materials.
All materials have been described previously (Boute et al., 2001), except AG1024 (Calbiochem), the anti-PTP1B antibody (Oncogene Research Products), the anti-calnexin antibody (StressGen Biotechnologies Corp.) and the anti-IRβ antibody that was used for immunoblotting (SantaCruz). The anti-IR antibodies used for immunoprecipitation (IR921) and for immunofluorescence (83-14) were gifts from J. Tavaré and K. Siddle, respectively.
Expression vectors.
The complementary DNA encoding IR–Rluc has been described previously (Boute et al., 2001). Wild-type PTP1B and PTP1B–D181A sequences were subcloned in frame with the 3′ codingsequence of YFP in the pEYFP-C1 expression vector (Clontech). A soluble form of YFP–PTP1B–D181A was generated using an XmnI site in PTP1B and a NotI site in the polylinker of the vector. In this soluble protein (YFP–PTP1B–D181A–Cter) the C-terminal 28 amino acids of the hydrophobic region of PTP1B are replaced by a 14 amino-acid hydrophilic stretch of hydrophilic residues (RPPPRARDPPDLDN).
Cell culture and transfection.
HEK-293 cells were seeded at a density of 2 × 10⁵ cells per 35-mm dish, and were transfected one day later with 300 ng of IR–Rluc cDNA and 600 ng of YFP–PTP1B–D181A cDNA per dish, unless otherwise specified in figure legends. One day after transfection, cells were transferred into 96-well microplates (CulturPlate-96, white; Packard) at a density of 3 × 10⁴ cells per well. BRET measurements were carried out in these microplates on the following day.
BRET measurements.
All BRET measurements were made at 20 °C using a Fusion™ microplate analyser (Packard). Cells were pre-incubated for 15 min in PBS in the presence of 5 μM coelenterazine. Insulin was then added, and light-emission acquisition at 485 nm and 530 nm was started immediately. We were able to monitor the dynamics of the interaction between the IR and the PTP1B proteins for more than 30 min after insulin addition. BRET measurements were carried out every 1.5–2 min (the interval of time between two measurements for a particular well depended on the number of experimental conditions analysed in the experiment). In some experiments, the dynamics of the interaction between IR–Rluc and YFP–PTP1B were monitored at very early time points. In these experiments, only two experimental conditions (with and without insulin) were analysed. This allowed us to carry out the first BRET measurement at t = 20 s (unstimulated well) and t = 30 s (insulin-stimulated well), and the subsequent BRET measurements every 17 s thereafter. BRET signal was expressed in milliBRET units (mBU) as previously described (Angers et al., 2000; Boute et al., 2001). Each BRET measurement corresponded to the signal emitted by the whole population of cells present in a well (approximately 4 × 10⁴ cells).
Immunofluorescence analysis.
The method used for immunolabelling has been previously described (Cazaubon et al., 1997).
Co-immunoprecipitation of YFP–PTP1B proteins with IR–Rluc.
HEK cells cotransfected with IR–Rluc and either YFP–PTP1B–D181A or YFP–PTP1B–D181A–Cter were incubated with or without insulin for 10 min. Proteins were extracted from the cells as described previously (Bandyopadhyay et al., 1997), and insulin receptors were immunoprecipitated using a polyclonal antibody raised against the entire extracellular portion of the insulin receptor (antibody IR921).
Supplementary data are available at EMBO reports online (http://www.nature.com/embor/journal/vaop/ncurrent/extref/4-embor767-s1.mov).
Supplementary Material
supplementary information
Acknowledgments
We thank A. Ullrich for providing us with the PTP1B cDNA, N. Chaverot for help with confocal microscopy, E. Harley and B. Weksler for critical reading of the manuscript, R. Jockers and S. Marullo for useful discussions, and B. Desbuquois for help and advice concerning cell fractionation experiments. This work was supported by the Institut de Recherche Servier, the ARC (grant number 4453) and the Ligue Contre le Cancer (Comité de Paris; grant number 75-02/RS95).
References
- Angers S., Salahpour A., Joly E., Hilairet S., Chelsky D., Dennis M. & Bouvier M. (2000) Detection of beta 2-adrenergic receptor dimerization in living cells using bioluminescence resonance energy transfer (BRET). Proc. Natl Acad. Sci. USA, 97, 3684–3689. [DOI] [PMC free article] [PubMed] [Google Scholar]
- Bandyopadhyay D., Kusari A., Kenner K.A., Liu F., Chernoff J., Gustafson T.A. & Kusari J. (1997) Protein-tyrosine phosphatase 1B complexes with the insulin receptor in vivo and is tyrosine-phosphorylated in the presence of insulin. J. Biol. Chem., 272, 1639–1645. [DOI] [PubMed] [Google Scholar]
- Boute N., Pernet K. & Issad T. (2001) Monitoring the activation state of the insulin receptor using bioluminescence resonance energy transfer. Mol. Pharmacol., 60, 640–645. [PubMed] [Google Scholar]
- Boute N., Jockers R. & Issad T. (2002) The use of resonance energy transfer in high-throughput screening: BRET versus FRET. Trends Pharmacol. Sci., 23, 351–354. [DOI] [PubMed] [Google Scholar]
- Burgess J.W., Wada I., Ling N., Khan M.N., Bergeron J.J. & Posner B.I. (1992) Decrease in betasubunit phosphotyrosine correlates with internalization and activation of the endosomal insulin receptor kinase. J. Biol. Chem., 267, 10077–10086. [PubMed] [Google Scholar]
- Cazaubon S., Chaverot N., Romero I.A., Girault J.A., Adamson P., Strosberg A.D. & Couraud P.O. (1997) Growth factor activity of endothelin-1 in primary astrocytes mediated by adhesion-dependent and -independent pathways. J. Neurosci., 17, 6203–6212. [DOI] [PMC free article] [PubMed] [Google Scholar]
- Combettessouverain M. & Issad T. (1998) Molecular basis of insulin action. Diabetes Metab., 24, 477–489. [PubMed] [Google Scholar]
- Elchebly M. et al. (1999) Increased insulin sensitivity and obesity resistance in mice lacking the protein-tyrosine phosphatase-1B gene. Science, 283, 1544–1548. [DOI] [PubMed] [Google Scholar]
- Flint A.J., Tiganis T., Barford D. & Tonks N.K. (1997) Development of 'substrate-trapping' mutants to identify physiological substrates of protein tyrosine phosphatases. Proc. Natl Acad. Sci. USA, 94, 1680–1685. [DOI] [PMC free article] [PubMed] [Google Scholar]
- Frangioni J.V., Beahm P.H., Shifrin V., Jost C.A. & Neel B.G. (1992) The nontransmembrane tyrosine phosphatase PTP-1B localizes to the endoplasmic reticulum via its 35 amino acid C-terminal sequence. Cell, 68, 545–560. [DOI] [PubMed] [Google Scholar]
- Gicquiaux H., Lecat S., Gaire M., Dieterlen A., Mely Y., Takeda K., Bucher B. & Galzi J.L. (2002) Rapid internalization and recycling of the human neuropeptide Y Y(1) receptor. J. Biol. Chem., 277, 6645–6655. [DOI] [PubMed] [Google Scholar]
- Haj F.G., Verveer P.J., Squire A., Neel B.G. & Bastiaens P.I. (2002) Imaging sites of receptor dephosphorylation by PTP1B on the surface of the endoplasmic reticulum. Science, 295, 1708–1711. [DOI] [PubMed] [Google Scholar]
- Haj F.G., Markova B., Klaman L.D., Bohmer F.D. & Neel B.G. (2003) Regulation of receptor tyrosine kinase signaling by protein tyrosine phosphatase-1B (PTP1B). J. Biol. Chem., 278, 739–744. [DOI] [PubMed] [Google Scholar]
- Khan M.N., Baquiran G., Brule C., Burgess J., Foster B., Bergeron J.J. & Posner B.I. (1989) Internalization and activation of the rat liver insulin receptor kinase in vivo. J. Biol. Chem., 264, 12931–12940. [PubMed] [Google Scholar]
- King M.J. & Sale G.J. (1990) Dephosphorylation of insulin-receptor autophosphorylation sites by particulate and soluble phosphotyrosyl-protein phosphatases. Biochem. J., 266, 251–259. [DOI] [PMC free article] [PubMed] [Google Scholar]
- Klein H.H., Freidenberg G.R., Matthaei S. & Olefsky J.M. (1987) Insulin receptor kinase following internalization in isolated rat adipocytes. J. Biol. Chem., 262, 10557–10564. [PubMed] [Google Scholar]
- Lammers R., Bossenmaier B., Cool D.E., Tonks N.K., Schlessinger J., Fischer E.H. & Ullrich A. (1993) Differential activities of protein tyrosine phosphatases in intact cells. J. Biol. Chem., 268, 22456–22462. [PubMed] [Google Scholar]
- Olson T.S., Bamberger M.J. & Lane M.D. (1988) Post-translational changes in tertiary and quaternary structure of the insulin proreceptor. Correlation with acquisition of function. J. Biol. Chem., 263, 7342–7351. [PubMed] [Google Scholar]
- Shiba T. et al. (1990) Concanavalin A-induced receptor aggregation stimulates the tyrosine kinase activity of the insulin receptor in intact cells. Biochem. J., 267, 787–794. [DOI] [PMC free article] [PubMed] [Google Scholar]
- Xu Y., Piston D.W. & Johnson C.H. (1999) A bioluminescence resonance energy transfer (BRET) system: application to interacting circadian clock proteins. Proc. Natl Acad. Sci. USA, 96, 151–156. [DOI] [PMC free article] [PubMed] [Google Scholar]
Associated Data
This section collects any data citations, data availability statements, or supplementary materials included in this article.
Supplementary Materials
supplementary information


