

Abstract
The origin of the pathogenic endothelial cells in common infantile hemangioma is unknown. We show here that the transcriptomes of human placenta and infantile hemangioma are sufficiently similar to suggest a placental origin for this tumor, expanding on recent immunophenotypical studies that have suggested this possibility [North, P. E., et al. (2001) Arch. Dermatol. 137, 559-570]. The transcriptomes of placenta, hemangioma, and eight normal and diseased tissues were compared by hierarchical and nonhierarchical clustering analysis of >7,800 genes. We found that the level of transcriptome similarity between placenta and hemangioma exceeded that of any other tissue compared and paralleled that observed between a given tissue and its derived tumor, such as normal and cancerous lung. The degree of similarity was even greater when a subset of endothelial cell-specific genes was analyzed. Genes preferentially expressed in both placenta and hemangiomas were identified, including 17-β hydroxysteroid dehydrogenase type 2 and tissue factor pathway inhibitor 2. These data demonstrate the value of global molecular profiling of tissues as a tool for hypothesis-driven research. Furthermore, it suggests that the unique self-limited growth of infantile hemangioma may, in fact, mirror the lifetime of placental endothelium.
Keywords: angiogenesis, endothelium, microarray, gene array
Infantile hemangioma is the most common pediatric tumor, affecting 1 in 10 Caucasian babies (1, 2). Hemangiomas are benign vascular lesions that grow rapidly during infancy and slowly involute during childhood to be replaced by fibro-fatty tissue. Hemangiomas are heterogeneous at all stages of tumor development (3). Proliferating lesions consist of endothelial cells (EC), supporting pericytes, and myeloid cells but include other cells such as fibroblasts and mast cells (3, 4). Recent studies with isolated hemangioma EC (5) and whole lesions (6) indicate that hemangiomas arise from uncontrolled clonal expansion of EC. Both abnormal local cellular signals (7) and somatic mutation in EC and/or pericytes (6) have been proposed as triggers for EC proliferation.
The tissue of origin on the hemangioma EC remains elusive. Hemangioma EC may derive from resident angioblasts, possibly arrested in an early stage of vascular development (8), because early lesions express CD34 and LYVE-1 (9). However, hemangioma EC could derive from cells expressing immature markers that home to receptive tissues from nonlocal sources. One option is bone marrow, because endothelial progenitor cells (10, 11) are found within hemangiomas (10) and are increased in the plasma of patients (10). A second alternative is placenta, because placental progenitor cells could embolize to receptive fetal tissues during gestation (12, 13).
Here, we test the hypothesis that hemangiomas derive from placental EC. A placental origin would explain the unique immunophenotypic similarity between hemangioma and placental vasculature. At least seven markers of hemangioma vessels are uniquely coexpressed in placental vessels. In addition to the four markers identified by North: GLUT1 (14), merosin (12), Lewis Y antigen (12), and Fcγ-RIIb (12), the following three markers have been independently reported in hemangioma and placental vessels: type III iodothyronine deiodinase (15, 16), indoleamine 2,3-deoxygenase (17, 18), and insulin-like growth factor 2 (IGF2)§§ (19, 20). No other tissue jointly expresses these markers. A placental origin would explain the 3-fold higher incidence of hemangiomas in infants born after transcervical chorionic villus sampling (21) and the association between hemangioma and prematurity (22) because prematurity may result from placental complications (13).
The molecular basis for the placental hypothesis is based on shared immunohistochemical markers. To more definitely test this hypothesis, we reasoned that if hemangiomas derive from placenta, then the genomewide gene expression profiles of hemangioma and placenta should exhibit a higher degree of global similarity relative to other tissues. Gene expression profiling permits comparison of the transcriptome as an entity (23, 24). The use of genomewide gene expression profiles as a whole, rather than specific genetic markers, is a powerful diagnostic tool for distinguishing tumor subtypes and prognostic groups (24). Here, we exploit gene expression profiling of tissues in a previously uncharacterized way: not only to identify differentially expressed genes or gene signatures, but primarily to test a biological hypothesis based on a feature of the transcriptome as an entity.
Materials and Methods
Tissue Collection. Human discarded tissues were handled anonymously according to procedures approved by the Committee on Clinical Investigation and the Internal Review Board of Children's Hospital and Brigham and Women's Hospital (Boston). Foreskins and proliferating infantile hemangiomas were obtained immediately after surgery and normal term placentas after Cesarean delivery, frozen in liquid nitrogen, and stored at -80°C until use.
Gene Expression Studies. RNA from placental villous samples (P), and from infantile hemangioma samples (H), RNA target preparation, and hybridization to U95Av2 (12,626 probe sets) GeneChip oligonucleotide microarrays (Affymetrix) were performed as described in ref. 25.
Data Collection and Scaling. P, H, normal skeletal muscle (N) (25), and brain (B) (26) expression profiles were performed in the microarray facility at Children's Hospital and scaled to a target intensity of 1,500 (microarray suite 5.0, Affymetrix). Normal (L) and cancerous lung data (Sq, SmC, and Car) were obtained from ref. 27 as Affymetrix U95Av2 raw image (DAT) files and were analyzed in microarray suite as above. Normal skin (S) and scleroderma (Sc) U95A data (28) downloaded from ref. 28 as text files of the raw numerical data were scaled to an average “signal” target intensity of 1,500 (all sample details are in Table 3, which is published as supporting information on the PNAS web site).
Gene Filtering. Data were filtered with the microarray suite 5.0 present/absent call. Only genes “expressed” in at least one tissue were included; expressed required a “present” call in ≥75% of all samples of that tissue. Filtering left m = 7,815 (of 12,650) genes; thus, the input data matrix for clustering was (m = 7,815) × (n = 63 samples).
Cluster Analysis. The m × n data matrix of signal values was log2-transformed to yield a normal distribution and prevent bias by outlier genes. Samples were standardized to the z score to minimize sample-to-sample variations given different sources. One-way clustering of samples was performed by calculating the entire n × n distance matrix between all samples, making the process independent of the order of the data in the input matrix. Clustering and dendrograms of similarity between the samples were generated with the program clustangraphics 6.0. (Clustan, Ltd, Edinburgh) (29) (details in Fig. 4, which is published as supporting information on the PNAS web site).
Analysis in GEDI. A visual portrait for each sample's profile based on self-organizing maps (30) was created by analyzing the data for hierarchical clustering with the program gedi (31) (specific parameters are in Fig. 5, which is published as supporting information on the PNAS web site).
Placenta and Hemangioma Specific Expression. Differentially expressed genes in H and P versus control tissues were identified by fold difference and q value as criteria (32). Fold difference in two tissues corresponds to the ratio of the averaged signal values over all samples for each respective tissue. q values, which measure significance in terms of false discovery rate rather than false positive rate, were determined by using the program qvalue as described in Table 4, which is published as supporting information on the PNAS web site (32). π0 values were automatically estimated by using the “smoother” method of the program.
Correlation Matrix of EC Expression. An EC-associated gene set was defined based on a pan-endothelial set previously identified by using different sources (33). Our EC-associated set, constituting 29 probe sets and reflecting 21 genes (Table 5, which is published as supporting information on the PNAS web site), comprises all genes expressed ≥4-fold in EC relative to non-EC (33) and represented in the U95Av2 arrays. This set was used to investigate the correlation of EC-expression between different tissues. The 63 × 63 half-matrix of Pearson correlation coefficients r of all samples to each other was calculated by using the signal values and represented as a colored matrix by using the matlab 6.0 program (MathWorks, Natick, MA).
Confirmation of Differentially Expressed Genes. Gene expression levels of tissue factor pathway inhibitor 2 (TFPI2), IGF2, and 17-β hydroxysteroid dehydrogenase type II (HSD17β2) were compared in cells and tissues by real-time quantitative RT-PCR with the Quantitect SYBR Green RT-PCR kit (Qiagen) (primer sequences and details in Table 3). β-2-microglobulin controlled for overall cDNA content. RNA from neonatal foreskin was isolated as described above. RNA from human skeletal muscle, brain, fetal liver, uterus, lung, and bone marrow were obtained from BD Biosciences. RNA from primary cultures of human EC and fibroblasts (FB) was harvested by using RNeasy Mini Kit (Qiagen). ECs from H (5), P (isolated as described in ref. 34), umbilical vein (HUVEC, Cambrex), and neonatal dermal microvascular (HMVEC, Cambrex) were cultured in EGM-2 media (Cambrex). FB from placental villi, H, and foreskin (isolated by collagenase/DNase I digestion) were cultured in DMEM with 10% FCS.
Results
Data Collection. We used oligonucleotide microarrays to compare the transcriptomes of H, P, and eight control tissues: normal muscle (25), normal brain (26), normal lung (27), three pulmonary tumors (squamous carcinoma, small cell carcinoma, and carcinoid) (27), normal skin, and scleroderma (28).
The control tissues share either anatomical or functional similarities with hemangioma and placenta. They should exclude the possibility that similarities between H and P gene expression profiles are caused by common inherent properties unrelated to a common origin. For instance, lung is highly vascular, and, thus, is a control for transcriptome similarity between H and P caused by prominent vascularity. Pulmonary tumors control for high content of proliferating cells and ongoing angiogenesis (35). Scleroderma controls for diseased skin with impaired vascular endothelium. Brain and muscle express some genetic markers shared by placental and hemangioma EC (i.e., GLUT1 in brain and merosin in muscle). Because all H were cutaneous, we included normal skin to exclude the possibility that the hemangioma transcriptome is determined by resident cutaneous cells.
Expression profiles were scaled to ensure comparability and filtered only to include genes expressed in at least 75% of the samples of at least one tissue type (see Materials and Methods). This yielded a data matrix of n = 63 samples × m = 7,815 genes.
Cluster Analysis of Global Expression Profiles. We first performed hierarchical clustering to measure the relative similarity among the transcriptomes. Because the primary aim was not to identify differentially expressed genes, we only clustered in the “sample dimension” (36). This selection gave us more flexibility in the analysis. The entire n × n “distance matrix” between all pairs of tissue samples was calculated and analyzed by using a variety of clustering techniques (37).
Fig. 1a shows hierarchical cluster analysis based on squared Euclidean distance and the “average linkage” method to build the dendrogram. As expected, samples from the same tissue or tumor type sorted into dense clusters (24, 38). Interestingly, H and P formed a common higher-level cluster quite separate from other tissues. Notably, pulmonary carcinoid, a neuroendocrine tumor, coclustered with brain.
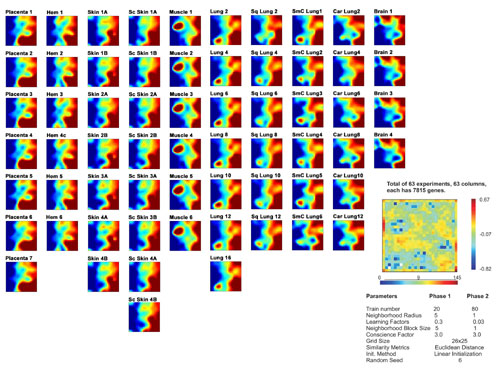
Fig. 1.

High similarity between hemangioma and placental transcriptomes. (a) Hierarchical clustering of 7,815 genes in the “sample dimension.” (b) Self-organizing maps visualized with gedi. Each tile within a mosaic represents a minicluster of genes (≈10 on average) with similar expression patterns across all samples. Tile's color indicates minicluster's average gene expression level. Samples are from: B, brain; H, hemangioma; P, placenta; S, skin; M, muscle; L, lung; Sc, scleroderma; Sq, squamous lung; SmC, small cell lung; Car, carcinoid lung.
Because hierarchical clustering was carried out in a precalculated matrix of distances between the samples, the branching points did not depend on the order of the samples. Still, hierarchical clustering is notorious for its inherent instability and dependence on the specific algorithm for building the dendrogram (39). To evaluate the stability of the H/P cluster, we (i) varied the method for calculating the (dis)similarity matrix and (ii) used 10 methods to build dendrograms (Table 1). As expected for well normalized data, the method for distance matrix calculation did not affect the dendrograms. Furthermore, P and H groups consistently formed a distinct higher-level cluster in all but one method (“centroid”). In contrast, the relations between other clusters varied (Table 1). For example, carcinoid and brain clusters separated in some methods, whereas some clusters of tumor types disassembled (Fig. 4).
Table 1. Methods for cluster analysis and effect on H/P coclustering.
| Clustering | H/P cocluster | Neighboring cluster |
|---|---|---|
| Hierarchical | ||
| Average linkage | Yes | [L, LT, S, Sc] |
| Single linkage | Yes | [L, LT, S, Sc] |
| Complete linkage | Yes | S |
| Increase in sum of square | Yes | M |
| Median | Yes | [L, LT, S, Sc] |
| Centroid | No | |
| Sum of squares | Yes | S |
| Mean proximity | Yes* | M |
| Flexible, β = –0.2 | Yes | [L, LT, Car, S, Sc] |
| Nonhierarchical | ||
| SOM: GEDI | Yes |
Same abbreviations as in Fig. 1. LT, lung tumors (without carcinoid).
H/P cluster invaded by two LT samples
In all methods, the main branches of the P and H clusters joined at a similar level, just as those of normal lung and pulmonary tumor clusters. Thus, the degree of similarity between P and H was around that of normal lung and pulmonary tumors, consistent with the view of placenta as “tumor” and hemangioma as its “metastasis.”
To further assess the stability of the H/P cluster, we used “density of points,” a partially hierarchical clustering technique with a tunable parameter k related to the “stringency” of clustering (29). We first determined the level of stringency at which 10 “natural” clusters corresponded to the 10 tissue types (k = 3). By increasing the stringency to k = 9, some clusters fused into larger ones, leaving only four: (i) muscle, (ii) H/P, (iii) normal and sclerodermic skin, and (iv) brain/lung/pulmonary tumors. Importantly, P and H samples fused to form one distinct cluster. At k = 16, only three clusters remained: (i) muscle, (ii)H/P, and (iii) all other tissues. All clusters collapsed at k = 18 (Fig. 4). These calculations demonstrate that the H/P cluster is as stable as, for example, muscle clustered with muscle. Furthermore, they confirm that the transcriptomes of placenta and hemangioma are highly similar, rivaling the similarity between different samples of the same tissue type.
Hierarchical clustering is based on nonintuitive algorithms that impose a tree structure without a biological rationale, and results are algorithm-dependent. Therefore, we compared our clustering results with those from a nonhierarchical clustering method. gedi is a program for analysis of gene expression data that uses self-organizing maps to transform each microarray (i.e., each sample's expression profile) into a visual mosaic (31). This representation allows for “Gestalt” perception of global similarities between the various samples. In Fig. 1b, four representative GEDI mosaics from each tissue type are presented next to the dendrogram (all mosaics available in Fig. 5). Because similarly behaving miniclusters of genes are placed near each other, recognizable patterns emerge that permit direct comparisons of individual profiles. Note that H and P display very similar patterns.
The GEDI mosaics suggested that the H/P transcriptomes are more similar to those of skin than lung. This relationship was obscured in the hierarchical clustering dendrogram because of the many ways the branching points can rotate for display (36). Only two hierarchical clustering methods placed the cutaneous profiles as an independent cluster next to that formed by H/P.
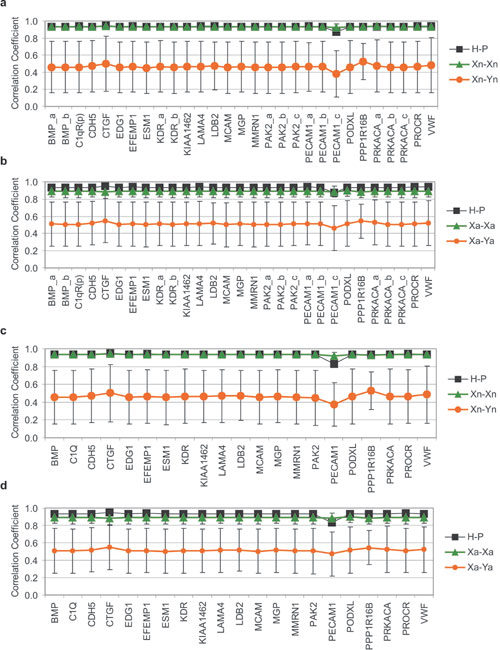
Comparing the Endothelial Compartment. Because hemangioma EC are clonal (5), and endothelium in different tissues display distinct transcriptomes (40-42), we asked whether hemangioma EC might exhibit a similar molecular portrait with placental EC. The microarray data were from whole tissues rather than isolated cells; thus, we “electronically dissected” the endothelial compartments by analyzing the profiles established by EC-associated genes. A set of 29 EC-associated genes (33) was defined (see Materials and Methods and Table 5) and used to investigate the degree of tissue-specific EC similarity. We first performed hierarchical clustering. As in the analysis of the entire transcriptome, all H and P formed a single cluster (Fig. 2). The relative similarity between the samples was then determined with correlation coefficients based on the EC set. Correlations are not affected by variations in the proportion of endothelium in the samples (Fig. 3a). We found a remarkably high correlation between hemangioma and placenta (H-P) (Pearson correlation coefficient, r = 0.94) that surpassed that of most same-tissue comparisons (normal or diseased), including P-P, and all different-tissue pairwise combinations (Fig. 3b). These findings indicate that hemangioma and placental EC are at least as similar to one another, as is endothelium of the same tissue harvested from different patients, including that from placenta, lung, muscle, or skin.
Fig. 2.

Hierarchical clustering of a 29 EC-associated gene subset, demonstrating high similarity in placental and hemangioma endothelium.
Fig. 3.

Pearson correlation coefficient of a 29 EC-associated gene subset (a and b) or 29 random genes (c) (1,000 permutations). (a) Color map, with pairwise comparisons in each square. (b and c) Average of r for same-pairwise comparisons, arranged in decreasing order: green (same-tissue pairs), orange (different-tissue pairs), black with arrow (H-P). Abbreviations are as in Fig. 1.
The high degree of H-P correlation with respect to EC-associated genes cannot be explained by endothelium activation or by ongoing angiogenesis. The EC-associated subset in H correlated more with that of normal lung (H-L, r = 0.73) than pulmonary tumor (r = 0.41-0.31), although the latter exhibits active angiogenesis. Moreover, the correlations for the EC subset of (cutaneous) H and normal skin (H-S, r = 0.59) and H and sclerodermic skin (H-Sc, r = 0.52) were significantly lower than H-P.
To examine the robustness of the EC gene set in representing the similarity, we analyzed the same correlation in 1,000 iterations with 15 randomly selected genes from the 29 EC-associated probe set (data not shown). To expose possible bias by an individual EC-associated gene with extreme expression values, we also performed a jackknife analysis (43), where the correlation coefficient was examined after removing a single gene (Fig. 6, which is published as supporting information on the PNAS web site). In both instances, H-P correlation was comparable to that obtained for same tissue pairs and was significantly higher than for different tissue pairs, demonstrating its independence of any one single EC-associated gene.
To confirm that the correlation between H and P was not so strong that it could be maintained by any 29 probes, we also calculated the H-P correlation from 29 randomly selected genes from the remaining 7,786 genes (7,815 gene sets minus 29 EC sets) (1,000 iterations). The high H-P correlation was lost and was comparable to the mean correlation of all pairwise combinations (r = 0.72 vs. 0.70; Fig. 3c). Thus, the endothelial compartment significantly contributed to the H/P coclustering observed at the tissue level, although non-EC genes and other EC-associated genes not included in the 29-probe subset also contributed to the coclustering.
Genes Differentially Expressed in Placenta and Hemangioma. To identify genetic markers common to hemangioma and placenta, we searched for genes overexpressed in both tissues relative to normal, or both normal and diseased tissues. We compared H vs. P, H vs. all other tissues X, and P vs. all other tissues X, yielding 17 pairwise comparisons for the 7,815 genes. This analysis led to the identification of 17 genes overexpressed by >3-fold in H and P relative to all other tissues (9 genes) or all normal tissues (8 genes) (Table 2). Fig. 7, which is published as supporting information on the PNAS web site, shows a color map of the signal values of these genes and their present or “absent” call. The gene names, accession numbers, average signal for each tissue, standard deviations, ratios, p and q values indicating significance and false-positive discovery rate are listed in Table 4.
Table 2. Genes overexpressed in H and P.
| (H/X and P/X)
|
||||||
|---|---|---|---|---|---|---|
| Affymetrix | Symbol | H/P ratio | Avg. | Min | Max | q value max |
| X = Normal/diseased | ||||||
| 38178_at | HSD17B2 | 1.9 | 115 | 23 | 264 | 0.0019 |
| 37388_at | TFPI2 | 0.8 | 143 | 40 | 292 | 0.0131 |
| 1591_s_at | IGF2 | 0.9 | 51.8 | 3.3 | 110 | 0.0305 |
| 37908_at | GNG11 | 2.8 | 16.0 | 3.1 | 48 | 0.0019 |
| 40399_r_at | NID1 | 2.6 | 14.9 | 3.5 | 78 | 0.0046 |
| 39333_at | COL4A1 | 1.6 | 14.7 | 3.5 | 71 | 0.0019 |
| 1954_at | KDR | 2.4 | 12.9 | 4.7 | 31 | 0.0023 |
| 34663_at | FCGR2B | 0.6 | 12.2 | 3.7 | 30 | 0.0131 |
| 36943_r_at | PLAGL1 | 0.9 | 10.3 | 3.5 | 24 | 0.0022 |
| X = Normal tissue only | ||||||
| 36782_s_at | IGF2 | 1.1 | 192 | 20 | 412 | 0.0063 |
| 1664_at | IGF2 | 0.9 | 33.3 | 5.0 | 67 | 0.0024 |
| 32648_at | DLK1 | 0.5 | 98.8 | 3.1 | 276 | 0.0149 |
| 32526_at | JAM3 | 1.4 | 15.2 | 3.6 | 41 | 0.0004 |
| 35366_at | NID2 | 2.2 | 13.5 | 4.1 | 38 | 0.0019 |
| 1951_at | ANGPT2 | 3.3 | 10.9 | 5.9 | 17 | 0.0085 |
| 753_at | MEOX2 | 3.3 | 10.7 | 3.1 | 32 | 0.0018 |
| 34280_at | GABRE | 1.1 | 10.0 | 3.3 | 21 | 0.0072 |
| 988_at | CEACAM1 | 0.3 | 6.4 | 3.3 | 12 | 0.0004 |
| 33434_at | BET1 | 3.6 | 4.7 | 3.6 | 5.7 | 0.0030 |
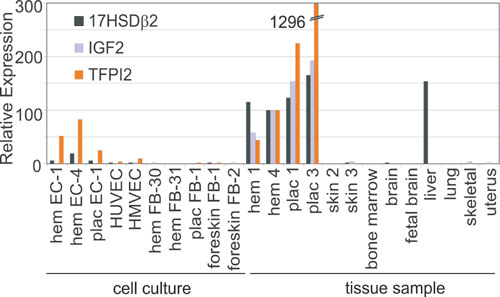
From the 17 genes, we validated the expression patterns of the three most highly overexpressed in H and P, 17HSDβ2, TFPI2, and IGF2, by using quantitative real-time RT-PCR (see Table 6, which is published as supporting information on the PNAS web site). We compared their expression to normal control tissues used above (skin, lung, skeletal muscle, and brain), as well as to normal tissues with active angiogenesis or high endothelial content (uterus, bone marrow, and fetal brain). Liver was included because it expresses 17HSDβ2 (44). We also compared primary cultures of EC and FB isolated from umbilical veins, placentas, proliferating hemangioma, and foreskin tissues. Quantitative RT-PCR confirmed that all three genes are highly expressed in H and P, but not significantly expressed in the control tissues, with the exception of 17HSDβ2 in liver (Fig. 8, which is published as supporting information on the PNAS web site). Primary EC from H and P expressed TFPI2 and 17HSDβ2 but not IGF2. The latter is consistent with recent reports in hemangioma EC (45). None of the genes were expressed by primary FB.
Comparison to Public Databases. Next, we expanded the number of control tissues to increase the stringency of the criteria for tissue specificity of the 17 previously uncharacterized H/P specific marker genes (Table 2). We determined whether the HP-specific genes were still placental-specific when compared against a larger set of tissues in public databases. The HugeIndex database (http://zlab.bu.edu/HugeSearch) and the Gene Expression Atlas (http://expression.gnf.org) contain HugeneFL and U95A array data for 17 and 30 different human tissue types, respectively, and both include P (Table 4). We defined as “placental-specific” those genes expressed at least 3-fold higher in P compared to all other tissues in these databases.
By this analysis, we found that among the H/P-specific genes, IGF2, 17HSDβ2, TFPI2, and γ-aminobutyric acid receptor, epsilon (GABRE) were placental-specific relative to tissues in the HugeIndex database. IGF2, FcγRII, and GABRE were also placental-specific when tested against additional tissues found in the Gene Expression Atlas database (fetal tissues excluded). In the latter database, TFPI2, 17HSDβ2, and δ drosophila homolog-like 1 were predominantly expressed in P, but also highly abundant in at least one other tissue (Table 4). Thus, several genes identified as highly expressed in H are also highly and selectively expressed in P, supporting the hypothesis that hemangiomas could derive from this tissue.
Discussion
Here, we used DNA microarray-based gene expression profiling to test the hypothesis that hemangioma derives from placental cells. Apart from their use for identifying individual differentially expressed genes, expression profiles permit the comparison of transcriptomes as entities (23, 24). As a whole, the transcriptome represents a stable, complex signature of tissues that harbors information about their origin. Notably, metastatic cancers preserve the molecular portrait of the primary tumor (46, 47). We analyzed the transcriptomes of H, P, and eight other tissues and found a striking similarity between the transcriptomes of the former two, supporting the hypothesis of a placental origin of hemangioma. Microarray experiments on P, H, brain, and muscle were all performed in the same facility by using the same protocol for RNA collection and array hybridization, thus, excluding the possibility that the H/P coclustering arose from procedural effects. Moreover, the similarity of expression profiles between hemangioma and placenta was corroborated by the following findings: (i) H and P coclustered in 9 of 10 clustering methods (Table 1); (ii) the HP cluster was the most stable as revealed in the “density method”; (iii) the similarity between H and P was often in the range of similarity between samples of the nominally same tissue types; and (iv) limiting genes used in the cluster analysis to those specific for EC increased the strength of HP coclustering relative to other tissue pairs. The microarray results confirmed previous reports of hemangioma markers expressed in placenta.
Of interest is the tightening of H/P coclustering that surpassed the similarity between most same-tissue comparisons when it was based on a set of 29 genes expressed solely or predominantly in EC. This finding eliminates the possibility that the high similarity between H and P could have resulted simply from a similarity in cellular composition (e.g., richness in EC). The vasculature is a systemic organ that fulfills specialized tasks required by the particular local physiology of the various tissues (42). Thus, EC express different genes depending on their functional state and tissue localization. This vascular specialization and tissue-specific diversity is manifest in distinct expression profiles that are largely maintained in culture demonstrating the stability of EC subtypes (33, 41). Given that hemangioma is a disease of the endothelium, the remarkable correlation between H and P with respect to the endothelial subphenotype further strengthens the hypothesis of a placental origin of hemangioma.
This hypothesis originated from immunohistochemical staining of several markers uniquely colocalized to placental and hemangioma EC (12, 14). We were able to confirm FcγRIIβ (12) and IGF2 (19). Although highly expressed by both H and P (average H/X >20.4, P/X >5.6), indoleamine 2,3-deoxygenase (17) was not within our list because the P/lung ratio was 2.8, barely below our 3-fold threshold. Alpha 1,2 fucosyltransferase (FUT1 and FUT2) that makes Lewis Y was not significantly present in any of the tissues examined. Type III iodothyronine deiodinase was highly and significantly expressed in a subset of P and H (2 of 7 P and 4 of 6 H); none of the other tissues expressed type III iodothyronine deiodinase. Although highly expressed in the hemangioma and placenta vasculature, GLUT1 and merosin were not differentially expressed relative to controls. Because these molecules are expressed by multiple cell types within the control tissues, and our array measurements were performed in whole tissues, this ubiquitous expression could have obscured the difference with regard to EC expression. Using very stringent criteria, we identified four additional HP genes, lending further support to the hypothesis of placental origin. From these genes, IGF2, 17HSDβ2, and δ drosophila homolog-like 1 are highest during the proliferative phase in hemangioma and decrease during involution (19), when endothelial content decreases.
Our data strongly support the hypothesis that hemangiomas are related to placenta in terms of the molecular portrait. But how could placental cells physically reach the fetus? There could be active migration of genetically normal placental angioblasts during gestation or after genetic alteration of placental EC clones that confer a migratory advantage (13). Alternatively, passive shedding of differentiated placental EC into the fetal circulation may allow placental cells to reach the fetus (12, 13).
Placental breakdown, which would increase cellular shedding, occurs during gestation. Fetal nucleated erythrocytes (48) and fetal cells of multilineage potential circulate in maternal blood and increase during placental complications (49). In addition, hematopoietic progenitor cells detected in mouse placentas as early as embryonic day 8.5 appear to arise in situ (50). Because placental-derived progenitor cells may contribute to the colonization of hemopoietic sites (50), the trafficking of placental progenitors to embryonic tissues may occur normally during gestation.
An alternative hypothesis compatible with our results and the H/P relationship is that local angioblasts invading the tissue aberrantly differentiate toward a placental microvascular phenotype in the mesenchyme of skin and subcutis (12). This proposal suggests a common genetic program activated ectopically in the skin, rather than direct physical descent. In this scenario, the resulting hemangioma EC should also be functionally analogous to a placental EC.
In summary, we provide compelling evidence to support the existence of a common genetic program between placental and hemangioma endothelium, supporting the idea of a placental origin of hemangioma. The unique hemangioma cycle marked by rapid EC proliferation, EC apoptosis, and tumor involution may mirror the lifetime of a placental EC, destined to proliferate for only 9 months, as has been suggested in ref. 12. Further studies employing this type of genome-based analysis will lead to a better understanding of the cellular and developmental basis for the similarity between the hemangioma and placenta and for the characteristic postnatal evolution of hemangioma.
Supplementary Material
Acknowledgments
We thank Drs. Paula North and Martin Mihm for helpful suggestions while reviewing this manuscript; Drs. Tao Lu and Bruce Yankner for sharing their brain data; Dr. Deborah Freedman (Children's Hospital) for helping to edit this manuscript and for providing foreskin FB; Dr. Joyce Bischoff for helpful discussions; Dr. Ho Yun Chung for assistance in isolating placental EC; Dr. Mei Han for assistance with GeneChip analyses; and Kristin Johhson for help with the figures. C.M.B. was supported by the Cancer Research Institute/Oliver R. Grace Jr. Fellowship and Postdoctoral Fellowship PF-03-111-01-CSM from the American Cancer Society. S.H. was supported by the Air Force Office of Scientific Research (F49620-01-1-0564) and A.K. and E.J.C. were supported by National Institutes of Health (NIH) Grant P01 CA45548-18. D.S. and A.H.B. were supported by NIH Grant R01 AR44345. Microarray experiments were performed in the Harvard Neuromuscular Disease Project Gene Expression Core Laboratory with support from National Institute for Neurological Disorders and Stroke Grant P01 NS40928.
Author contributions: C.M.B., S.H., A.K., A.H.B., J.F., and S.J.F. designed research; C.M.B., A.K., D.S., and E.J.C. performed research; Y.Y., J.B.M., and S.J.F. contributed new reagents/analytic tools; C.M.B., S.H., D.S., G.S.E., Y.G., D.E.I., and A.H.B. analyzed data; and C.M.B. and S.H. wrote the paper.
Conflict of interest statement: No conflicts declared.
Abbreviations: EC, endothelial cell; FB, fibroblast; H, infantile hemangioma samples; IGF2, insulin-like growth factor II; P, placental villous samples; 17HSDβ2, 17-β hydroxysteroid dehydrogenase type II; TFPI2, tissue factor pathway inhibitor 2.
Footnotes
North, P., De Aos, I., Lal, A., Riggins, G., Marchuk, D., Waner, M. & Mihm, M. (2004) Mod. Pathol. 17, 97A (abstr.).
References
- 1.Fishman, S. J. & Mulliken, J. B. (1993) Pediatr. Clin. North Am. 40, 1177-1200. [DOI] [PubMed] [Google Scholar]
- 2.Mulliken, J. B., Fishman, S. J. & Burrows, P. E. (2000) Curr. Probl. Surg. 37, 517-584. [DOI] [PubMed] [Google Scholar]
- 3.Gonzalez-Crussi, F. & Reyes-Mugica, M. (1991) Am. J. Surg. Pathol. 15, 769-778. [PubMed] [Google Scholar]
- 4.Nguyen, V. A., Furhapter, C., Romani, N., Weber, F. & Sepp, N. (2004) Hum. Pathol. 35, 739-744. [DOI] [PubMed] [Google Scholar]
- 5.Boye, E., Yu, Y., Paranya, G., Mulliken, J. B., Olsen, B. R. & Bischoff, J. (2001) J. Clin. Invest. 107, 745-752. [DOI] [PMC free article] [PubMed] [Google Scholar]
- 6.Walter, J. W., North, P. E., Waner, M., Mizeracki, A., Blei, F., Walker, J. W., Reinisch, J. F. & Marchuk, D. A. (2002) Genes Chromosomes Cancer 33, 295-303. [DOI] [PubMed] [Google Scholar]
- 7.Bielenberg, D. R., Bucana, C. D., Sanchez, R., Mulliken, J. B., Folkman, J. & Fidler, I. J. (1999) Int. J. Oncol. 14, 401-408. [DOI] [PubMed] [Google Scholar]
- 8.Smoller, B. R. & Apfelberg, D. B. (1993) J. Cutan. Pathol. 20, 330-336. [DOI] [PubMed] [Google Scholar]
- 9.Dadras, S. S., North, P. E., Bertoncini, J., Mihm, M. C. & Detmar, M. (2004) Mod. Pathol. 17, 1068-1079. [DOI] [PubMed] [Google Scholar]
- 10.Kleinman, M. E., Tepper, O. M., Capla, J. M., Bhatt, K. A., Ceradini, D. J., Galiano, R. D., Blei, F., Levine, J. P. & Gurtner, G. C. (2003) Lymphat. Res. Biol. 1, 301-307. [DOI] [PubMed] [Google Scholar]
- 11.Yu, Y., Flint, A. F., Mulliken, J. B., Wu, J. K. & Bischoff, J. (2004) Blood 103, 1373-1375. [DOI] [PubMed] [Google Scholar]
- 12.North, P. E., Waner, M., Mizeracki, A., Mrak, R. E., Nicholas, R., Kincannon, J., Suen, J. Y. & Mihm, M. C., Jr. (2001) Arch. Dermatol. 137, 559-570. [PubMed] [Google Scholar]
- 13.North, P. E., Waner, M. & Brodsky, M. C. (2002) Ophthalmology 109, 633-634. [DOI] [PubMed] [Google Scholar]
- 14.North, P. E., Waner, M., Mizeracki, A. & Mihm, M. C., Jr. (2000) Hum. Pathol. 31, 11-22. [DOI] [PubMed] [Google Scholar]
- 15.Huang, S. A., Tu, H. M., Harney, J. W. Venihaki, M., Butte, A. J., Kozakewich, H. P., Fishman, S. J. & Larsen, P. R. (2000) N. Engl. J. Med. 343, 185-189. [DOI] [PubMed] [Google Scholar]
- 16.Huang, S. A., Dorfman, D. M., Genest, D. R., Salvatore, D. & Larsen, P. R. (2003) J. Clin. Endocrinol. Metab. 88, 1384-1388. [DOI] [PubMed] [Google Scholar]
- 17.Ritter, M. R., Moreno, S. K., Dorrell, M. I., Rubens, J., Ney, J., Friedlander, D. F., Bergman, J., Cunningham, B. B., Eichenfield, L., Reinisch, J., et al. (2003) Lymphat. Res. Biol. 1, 291-299. [DOI] [PubMed] [Google Scholar]
- 18.Ligam, P., Manuelpillai, U., Wallace, E. M. & Walker, D. (2005) Placenta 26, 498-504. [DOI] [PubMed] [Google Scholar]
- 19.Ritter, M. R., Dorrell, M. I., Edmonds, J., Friedlander, S. F. & Friedlander, M. (2002) Proc. Natl. Acad. Sci. USA 99, 7455-7460. [DOI] [PMC free article] [PubMed] [Google Scholar]
- 20.Thomsen, B. M., Clausen, H. V., Larsen, L. G., Nurnberg, L., Ottesen, B. & Thomsen, H. K. (1997) Placenta 18, 145-154. [DOI] [PubMed] [Google Scholar]
- 21.Burton, B. K., Schulz, C. J., Angle, B. & Burd, L. I. (1995) Prenat. Diagn. 15, 209-214. [DOI] [PubMed] [Google Scholar]
- 22.Amir, J., Metzker, A., Krikler, R. & Reisner, S. H. (1986) Pediatr. Dermatol. 3, 331-332. [DOI] [PubMed] [Google Scholar]
- 23.Huang, S. (2001) Pharmacogenomics 2, 203-222. [DOI] [PubMed] [Google Scholar]
- 24.Chung, C. H., Bernard, P. S. & Perou, C. M. (2002) Nat. Genet. 32, Suppl., 533-540. [DOI] [PubMed] [Google Scholar]
- 25.Sanoudou, D., Haslett, J. N., Kho, A. T., Guo, S., Gazda, H. T., Greenberg, S. A., Lidov, H. G. W., Kohane, I. S., Kunkel, L. M. & Beggs, A. H. (2003) Proc. Natl. Acad. Sci. USA 100, 4666-4671. [DOI] [PMC free article] [PubMed] [Google Scholar]
- 26.Lu, T., Pan, Y., Kao, S. Y., Li, C., Kohane, I., Chan, J. & Yankner, B. A. (2004) Nature 429, 883-891. [DOI] [PubMed] [Google Scholar]
- 27.Bhattacharjee, A., Richards, W. G., Staunton, J., Li, C., Monti, S., Vasa, P., Ladd, C., Beheshti, J., Bueno, R., Gillette, M., et al. (2001) Proc. Natl. Acad. Sci. USA 98, 13790-13795. [DOI] [PMC free article] [PubMed] [Google Scholar]
- 28.Whitfield, M. L., Finlay, D. R., Murray, J. I., Troyanskaya, O. G., Chi, J.-T., Pergamenschikov, A., McCalmont, T. H., Brown, P. O., Botstein, D. & Connolly, M. K. (2003) Proc. Natl. Acad. Sci. USA 100, 12319-12324. [DOI] [PMC free article] [PubMed] [Google Scholar]
- 29.Wishard, D. (1969) in Numerical Taxonomy, ed. Cole, A. J. (Academic, New York), pp. 282-311.
- 30.Kohonen, T. (1997) Self-Organizing Maps (Springer, Berlin).
- 31.Eichler, G. S., Huang, S. & Ingber, D. E. (2003) Bioinformatics 19, 2321-2322. [DOI] [PubMed] [Google Scholar]
- 32.Storey, J. D. & Tibshirani, R. (2003) Proc. Natl. Acad. Sci. USA 100, 9440-9445. [DOI] [PMC free article] [PubMed] [Google Scholar]
- 33.Ho, M., Yang, E., Matcuk, G., Deng, D., Sampas, N., Tsalenko, A., Tabibiazar, R., Zhang, Y., Chen, M., Talbi, S., et al. (2003) Physiol. Genomics 13, 249-262. [DOI] [PubMed] [Google Scholar]
- 34.Schutz, M. & Friedl, P. (1996) Eur. J. Cell Biol. 71, 395-401. [PubMed] [Google Scholar]
- 35.Juczewska, M., Chyczewski, L., Telego, M., Chyczewska, E., Niklinski, J., Tanska, M. & Laudanski, J. (1997) Rocz. Akad. Med. Bialymst. 42, Suppl. 1, 254-270. [PubMed] [Google Scholar]
- 36.Eisen, M. B., Spellman, P. T., Brown, P. O. & Botstein, D. (1998) Proc. Natl. Acad. Sci. USA 95, 14863-14868. [DOI] [PMC free article] [PubMed] [Google Scholar]
- 37.Milligan, G. W. & Cooper, M. C. (1985) Psychometrica 50, 159-179. [Google Scholar]
- 38.Meyerson, M., Franklin, W. A. & Kelley, M. J. (2004) Semin. Oncol. 31, 4-19. [DOI] [PubMed] [Google Scholar]
- 39.Morgan, B. T. & Ray, A. P. G. (1995) Appl. Stat. 44, 117-134. [Google Scholar]
- 40.Pasqualini, R., Arap, W. & McDonald, D. M. (2002) Trends Mol. Med. 8, 563-571. [DOI] [PubMed] [Google Scholar]
- 41.Chi, J.-T., Chang, H. Y., Haraldsen, G., Jahnsen, F. L., Troyanskaya, O. G., Chang, D. S., Wang, Z., Rockson, S. G., van de Rijn, M., Botstein, D. & Brown, P. O. (2003) Proc. Natl. Acad. Sci. USA 100, 10623-10628. [DOI] [PMC free article] [PubMed] [Google Scholar]
- 42.Aird, W. C. (2004) Blood 103, 3994-3995. [Google Scholar]
- 43.Efron, B. & Tibshirani, R. (1998) An Introduction to the Bootstrap (CRC, Boca Raton, FL).
- 44.Moghrabi, N., Head, J. R. & Andersson, S. (1997) J. Clin. Endocrinol. Metab. 82, 3872-3878. [DOI] [PubMed] [Google Scholar]
- 45.Yu, Y., Wylie-Sears, J., Boscolo, E., Mulliken, J. B. & Bischoff, J. (February 1, 2005) Mol. Med., 10.21.19/2004-00045.Bischoff. [DOI] [PMC free article] [PubMed]
- 46.Ramaswamy, S., Tamayo, P., Rifkin, R., Mukherjee, S., Yeang, C.-H., Angelo, M., Ladd, C., Reich, M., Latulippe, E., Mesirov, J. P., et al. (2001) Proc. Natl. Acad. Sci. 98, 15149-15154. [DOI] [PMC free article] [PubMed] [Google Scholar]
- 47.Su, A. I., Welsh, J. B., Sapinoso, L. M., Kern, S. G., Dimitrov, P., Lapp, H., Schultz, P. G., Powell, S. M., Moskaluk, C. A., Frierson, H. F., Jr., et al. (2001) Cancer Res. 61, 7388-7393. [PubMed] [Google Scholar]
- 48.Bianchi, D. W., Zickwolf, G. K., Yih, M. C., Flint, A. F., Geifman, O. H., Erikson, M. S. & Williams, J. M. (1993) Prenat. Diagn. 13, 293-300. [DOI] [PubMed] [Google Scholar]
- 49.Bianchi, D. W. (2000) Am. J. Med. Genet. 91, 22-28. [DOI] [PubMed] [Google Scholar]
- 50.Alvarez-Silva, M., Belo-Diabangouaya, P., Salaun, J. & Dieterlen-Lievre, F. (2003) Development (Cambridge, U.K.) 130, 5437-5444. [DOI] [PubMed] [Google Scholar]
Associated Data
This section collects any data citations, data availability statements, or supplementary materials included in this article.