Abstract
Tenosynovial giant-cell tumor (TGCT) and pigmented villonodular synovitis (PVNS) are related conditions with features of both reactive inflammatory disorders and clonal neoplastic proliferations. Chromosomal translocations involving chromosome 1p13 have been reported in both TGCT and PVNS. We confirm that translocations involving 1p13 are present in a majority of cases of TGCT and PVNS and show that CSF1 is the gene at the chromosome 1p13 breakpoint. In some cases of both TGCT and PVNS, CSF1 is fused to COL6A3 (2q35). The CSF1 translocations result in overexpression of CSF1. In cases of TGCT and PVNS carrying this translocation, it is present in a minority of the intratumoral cells, leading to CSF1 expression only in these cells, whereas the majority of cells express CSF1R but not CSF1, suggesting a tumor-landscaping effect with aberrant CSF1 expression in the neoplastic cells, leading to the abnormal accumulation of nonneoplastic cells that form a tumorous mass.
Keywords: pigmented villonodular synovitis, receptor tyrosine kinase, macrophage, COL6A3
Through the human genome project, many genes with the protein kinase sequence (collectively referred to as “the Kinome”) have been identified, including 90 potential tyrosine kinases (1). Receptor tyrosine kinases (RTKs) relay external signals to regulate diverse cellular processes including growth, cell migration, differentiation, and survival. Genes encoding RTK genes or their ligands are frequently altered by translocation or mutation in neoplastic cells, including carcinomas (e.g., EGFR in lung adenocarcinoma), germ-cell tumors (e.g., KIT in seminoma), leukemias (e.g., ABL in chronic myelogenous leukemia), and soft tissue tumors [e.g., KIT or PDGFRA in gastrointestinal stromal tumor (GIST); PDGFB in dermatofibrosarcoma protuberans (DFSP)]. Several of these RTKs can now be targeted with small-molecule inhibitors (2, 3), and clinical trials suggest that tumors harboring mutations involving these genes are particularly susceptible to small-molecule inhibitors because the tumors are “addicted” to oncogenic signaling through these kinase pathways.
One such inhibitor [imatinib mesylate (Gleevec)] is active against members of the RTK type III subgroup that includes KIT, PDGFRA, and PDGFRB and has been used successfully in the treatment of GIST and DFSP (1, 3, 4). GISTs are sarcomas of the intestinal tract that have activating mutations of either KIT or PDGFRA. DFSP, a sarcoma of the dermis, has a translocation involving PDGFB, the ligand for PDGFRB. A different inhibitor (SU11248) has been reported to be active against another member of this group, CSF1R (5).
The tissue microarray (TMA) technique, by arraying representative cores of tissue in a single paraffin block, is useful in evaluating protein and RNA expression levels in large series of tumors (6–8). The intention of our study was to test the feasibility and potential of systematically analyzing expression of mRNAs encoding tyrosine receptor kinases in large numbers of soft-tissue tumors by in situ hybridization (ISH) on TMAs. We confirmed high expression of KIT/PDGFRA in GIST and PDG-FRB in DFSP. In addition, we observed that tenosynovial giant-cell tumors (TGCT) showed exceptionally high expression of CSF1R.
TGCT are benign tumors, but whether they are reactive or neoplastic remains controversial, and the cell of origin is unknown. They were suggested to be reactive by Jaffe (9) in the initial classification of TGCT and related lesions. There have subsequently been reports of clonal cytogenetic abnormalities, most commonly involving 1p11, in TGCT, supporting a neoplastic origin with activation of a growth-promoting gene through a balanced translocation (10–15). The finding that the cells of TGCT are polyclonal, by analysis of X-chromosome inactivation (16), and the identification of similar chromosomal translocations in hemorrhagic synovitis or rheumatoid synovitis (11) has cast doubt on the neoplastic nature of TGCT.
TGCT and the morphologically similar but more clinically aggressive disorder pigmented villonodular synovitis (PVNS) are composed of mononuclear and multinucleated cells. Here, we show by ISH, that both cell types express high levels of CSF1R. In addition, we found that CSF1, encoding the ligand of CSF1R, is translocated in 23 of 30 TCGT and five of eight PVNS, and that only a minority of tumor cells (2–16%) carry the translocation and express CSF1. These data suggest that only a minority of cells in TGCT and PVNS are neoplastic and that the majority of cells in these tumors are nonneoplastic cells that are recruited by the local overexpression of CSF1. Although tumors in which the neoplastic clone constitutes a small minority of the cells present are well recognized in the case of some lymphomas, this phenomenon has not been described for a mesenchymal tumor.
Results and Discussion
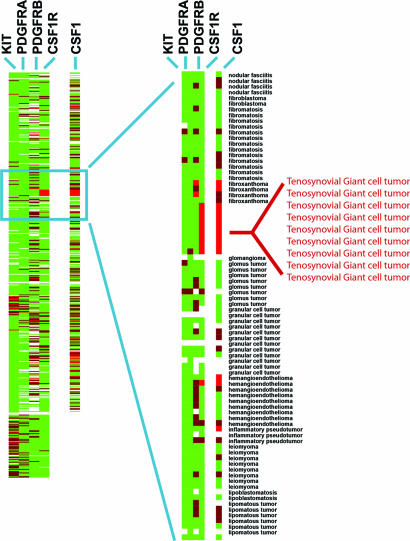
We conducted a survey to determine which other soft-tissue tumors could potentially respond to small-molecule inhibitors by examining type III RTK family expression in 507 soft-tissue tumors represented on TMAs of paraffin-embedded tissue (Fig. 1) (17). mRNA levels of four RTKs were studied by ISH: KIT, CSF1R, PDGFRA, and PDGFRB. As reported in ref. 8, KIT mRNA expression was largely confined to GISTs. PDGFRA mRNA expression was also seen in GIST but in a smaller subset of cases, corresponding to those GISTs with PDGFRA mutations (8). DFSP, which has a translocation involving the ligand PDGFB (18), demonstrated high levels of expression of PDG-FRB in the vast majority of cases, correlating with our prior gene-array findings (19). Several tumors showed expression of more than one RTK: KIT and PDGFRA were often coexpressed, whereas CSF1R was more frequently found to be coexpressed with PDGFRB (see Fig. 8, which is published as supporting information on the PNAS web site).
Fig. 1.
RTK expression in 507 soft-tissue tumors. Tumors are grouped along the y axis by diagnosis. Results of ISH using four RTK antisense probes: CSF1R, KIT, PDGFRA, and PDGFRB and one ligand, CSF1, are shown on the x axis. Bright red, strong expression; dark red, weak expression; green, no expression; white, no data as a result of tissue loss.
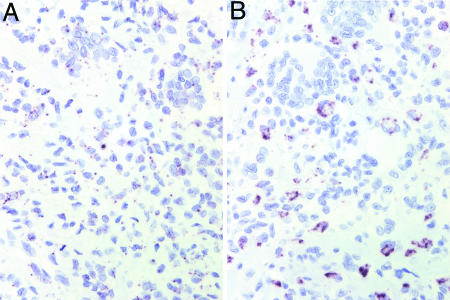
CSF1R was very strongly expressed in all nine cases of TGCT (Fig. 2A), with expression evident in the majority of both the mononuclear cells and the multinucleated giant cells of the tumor. Our observation of high CSF1R expression in TGCT led us to study the expression of the ligand (CSF1) in this lesion. As shown in Fig. 2B, only a small subset of mononuclear cells in TGCT highly expressed CSF1 mRNA. Each TGCT case demonstrated this pattern of CSF1 expression (Fig. 1). Similar results were obtained in stains of the related lesion PVNS (data not shown).
Fig. 2.
CSF1 and CSF1R ISH in TGCT. (A) CSF1R ISH in TGCT; dark granules denote sites of hybridization. All scorable TGCT and PVNS were positive for CSF1R mRNA expression in the vast majority of cells. (B) CSF1 ISH in TGCT. All CSF1-positive cases of TGCT and PVNS showed similar low numbers of cells expressing CSF1.
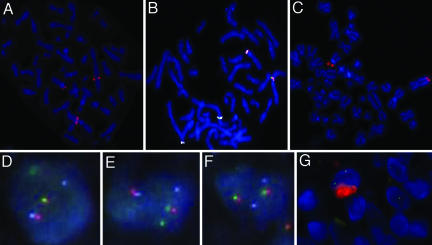
TGCT and PVNS are both composed of a mixture of giant cells, mononuclear cells, and inflammatory cells, the origin and neoplastic nature of which is controversial (16). TGCT has been analyzed by G-banding, and a breakpoint in the region 1p11–13 has been observed in the majority of cases (10–15). FISH probe analysis showed that the breakpoints clustered to one region located in 1p13.2 in 18 of 21 cases (12). The gene(s) involved in these chromosomal abnormalities have not been identified, but CSF1 is localized to this region. Using a bacterial artificial chromosome (BAC) probe RP11–19F3 containing the CSF1 gene, we performed FISH on a metaphase spread of a TGCT case (ST-143) and observed that the CSF1 locus is divided between abnormal chromosomes 1 and 2 (Fig. 3A) (for a description of FISH probes see Fig. 9, which is published as supporting information on the PNAS web site). Examining additional cases in a TMA format with probes RP11–354C7 (centromeric to CSF1) and RP11–96F24 (telomeric to CSF1), we found that 87% (20 of 23 scorable cases) of TGCT, 35% (9 of 26 scorable cases) of PVNS, and no (0 of 4 scorable cases) giant-cell tumors of bone show evidence for translocation involving the CSF1 locus (see Fig. 10, which is published as supporting information on the PNAS web site). Interestingly, only a small percentage of cells in each lesion (range 2–16%) demonstrated the split-probe signal. This finding correlated with the low number of CSF1-expressing cells in TGCT and PVNS, as assayed by ISH for CSF1 mRNA. Thus, the majority of cells that comprise the tumor do not express CSF1 and do not have a translocation involving CSF1.
Fig. 3.
FISH on TGCT. (A) FISH with the CSF1-spanning BAC probe RP11–19F3B on TGCT confirms that the CSF1 gene is split by the translocation in TGCT. (B) The fusion of CSF1 and COL6A3 was confirmed by FISH. The COL6A3 locus is represented by CTD-2344F21 (labeled in white), the region telomeric to CSF1 is represented by RP11–96F24 (labeled in green), and the region centromeric to CSF1 is represented by RP11–354C7 (labeled in orange). (C) In metaphase TGCT, FISH with BAC probe RP11–25803 that covers the region telomeric to COL6A3, which fails to split. (D and E) Two nuclei with the fusion of CSF1 and COL6A3 demonstrated by FISH on interphase TMA sample of TGCT. The COL6A3 locus is represented by CTD-2344F21 (labeled in white), the region telomeric to CSF1 is represented by RP11–96F24 (labeled in green), and the region centromeric to CSF1 is represented by RP11–354C7 (labeled in orange). (F) Lack of translocation in a nucleus from the same sample as D and E shows an intact CSF1 gene. (G) Combined interphase FISH with the region telomeric to CSF1 represented by RP11–96F24 (labeled in green) and the region centromeric to CSF1 represented by RP11–354C7 (labeled in orange), and CSF1 immunohistochemistry (labeled in red) demonstrated that only the cells with the translocation expressed CSF1.
Prior studies noted that the most common fusion partner of chromosome 1 in TGCT is chromosome 2; G-banding showed involvement of 2q35–37 in 8 of 26 cases (12). A metaphase spread from the same TGCT case (case ST-143) described above showed that FISH BAC probes RP11–354C7 (1p13) and RP11–497D24 (2q37) came together in TCGT, indicating that the translocation involves chromosomes 1p13 and 2q37. The BAC probes, CTD-2344F21, RP11–96F24, RP11–354C7, and RP11–25803 identify COL6A3 as the gene on 2q37 involved in the translocation (Fig. 3 B and C). FISH on interphase nuclei in TMA showed similar findings (Fig. 3 D–F). Combined interphase FISH and CSF1 immunohistochemistry demonstrated that only the cells with the translocation expressed CSF1 (Fig. 3G). Of the scorable cases with translocations at the CSF1 locus, 3 of 10 TGCT and two of five PVNS cases also involved the COL6A3 locus. Our data confirm earlier findings that the majority of TGCT cases have a translocation involving chromosome 1 and that a subset of these cases show fusion with chromosome 2 and identify CSF1 and COL6A3, respectively, as the specific genes involved in these translocations.
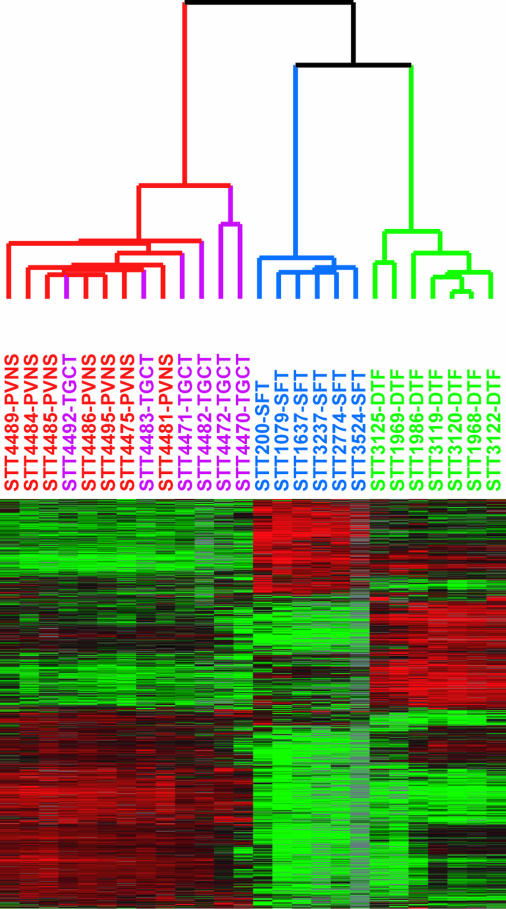
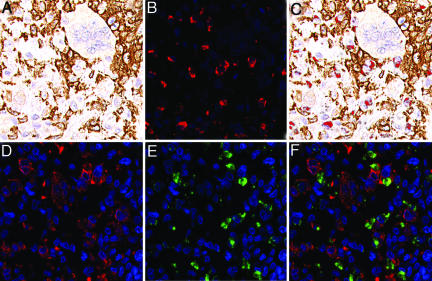
Only a low percentage of cells in TGCT and PVNS express CSF1 and have the translocation, whereas the majority express CSF1R, suggesting that the majority of cells in these lesions are reactive, their presence presumably a consequence of CSF1 production by the neoplastic cells. To investigate the nature of the presumed CSF1-responsive cell population in TGCT and PVNS, we compared the RNA-expression profiles of six TGCT and seven PVNS against two other previously studied bland soft-tissue tumors [six cases of solitary fibrous tumor (SFT) and seven cases of desmoid-type fibromatosis (DTF)] by using DNA microarrays. Because only a minority of cells in the tumor had the translocation, we anticipated that expression profiles would primarily reflect the biology of the nonneoplastic cells responding to expressed CSF1 rather than the neoplastic cells. Hierarchical clustering of the tumors based on similarities in their gene expression patterns separated the tumors according to pathologic type (Fig. 4). PVNS and TCGT clustered together on a main branch. Although the data confirmed that PVNS and TGCT consistently expressed CSF1R, CSF1 expression did not pass filtering criteria, consistent with the low number of cells that express CSF1 as seen by ISH. Among the genes most consistently highly expressed in TGCT and PVNS relative to SFT or DTF, many were associated with macrophage function and biology. This finding was supported by a significance analysis of microarrays (SAM)-generated list of TGCT and PVNS genes. Gene-Ontology analysis of this list found a significant representation of genes involved in immune response, including CD163. An immunostain for CD163, one of the highly expressed macrophage markers (20), confirmed that many cells in the tumor have a macrophage phenotype (Fig. 5A). In double stains for CD163 and CSF1, there was little overlap, indicating that the CSF1-expressing cells differ from the more abundant macrophages (Fig. 5 B and C). It has been reported that synovial-lining cells stain with the macrophage marker CD68 (21). Doubling staining demonstrated that cells expressing CSF1 also express CD68. This finding and the lack of CD163 coexpression suggest that the CSF1-expressing neoplastic cells are derived from synovial-lining cells (Fig. 5 D–F). Only synovial-lining cells in reactive synovitis express CSF1, providing additional support for this hypothesis (Fig. 6).
Fig. 4.
Unsupervised hierarchical clustering of seven cases of PVNS (in red), six cases of TGCT (purple), six cases of SFT (blue), and seven cases of DTF (green) based on expression profiling with DNA microarrays. In the heatmap, red represents high expression, black represents median expression, green represents low expression, and gray represents no data.
Fig. 5.
Double staining for CSF1 mRNA and CD163 or CD68 protein in TGCT. (A) CD163 immunohistochemistry (DAB). (B) CSF1 ISH with fluorescence (red). (C) Combined A and B; CSF1 ISH with fluorescence (red) and CD163 immunohistochemistry (DAB). (D) CD68 immunohistochemistry with fluorescence (red). (E) CSF1 ISH with fluorescence (green). (F) Combined D and E; CSF1 ISH with fluorescence (green) and CD68 immunohistochemistry with fluorescence (red).
Fig. 6.
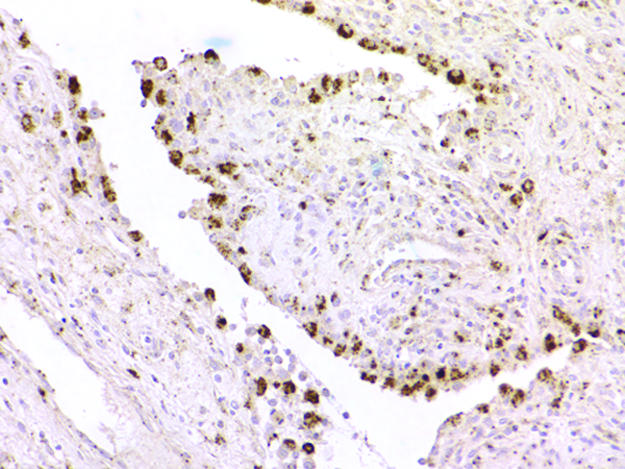
CSF1 ISH in reactive synovitis, showing strong reactivity in synovial-lining cells.
The CSF1–COL6A3 translocation in TGCT and PVNS is reminiscent of the translocation that defines DFSP. In this malignancy, t(17;22) brings PDGF-B under control of the strong COL1A1 promoter. The posttranslationally processed form of the fusion protein is a fully functional PDGF-B protein that may stimulate oncogenesis through its receptor, PDGFRB. The PDGFRB receptor is also up-regulated in DFSP, suggesting an autocrine loop (19). However, TGCT differs from DFSP and other soft-tissue tumors in that only a minority of cells in the tumor contain the translocation and express CSF1 RNA, but most of the cells within the tumor express CSF1R RNA.
Three conclusions are supported by our findings. First, TGCT and PVNS are neoplasms. Although cytogenetic studies had identified a variety of translocations in TGCT cases (10–15), other studies using human androgen receptor (HUMARA) assays failed to demonstrate clonality (16). Our finding that the CSF1 gene is translocated in only a small percentage of the mononuclear cells in TGCT and PVNS explains this discrepancy.
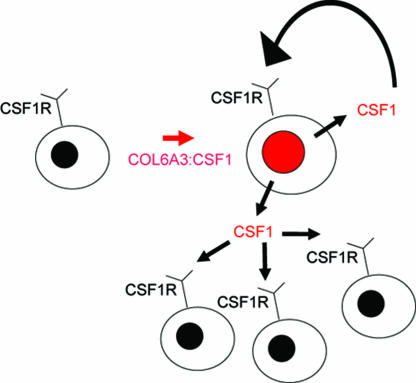
Second, the neoplastic cells in TGCT constitute only a small minority of the tumor-cell population; the majority of the cells are apparently reactive, nonneoplastic cells. These conclusions are consistent with the biology of CSF1. CSF1 mediates the proliferation, differentiation, and function of macrophages and their precursors (22). The cells with the CSF1 translocation most likely recruit CSF1R-expressing macrophages (23) and may induce the formation of multinucleated giant cells (Fig. 7). Thus, the neoplastic cells create a tumor “landscape” comprised of nonneoplastic cells responding to secreted CSF1. These tumors may be a prototype for a unique form of tumor landscaping (24).
Fig. 7.
Autocrine and paracrine scheme for CSF1 landscaping effect. CSF1 is produced by neoplastic cells, with translocation resulting in increased numbers of neoplastic cells through an autocrine loop with CSF1R. CSF1 also recruits nonneoplastic CD163- and CSF1R-expressing cells of monocyte/macrophage lineage.
Third, the translocation involving COL6A3 and CSF1 results in high levels of CSF1 expression in TGCT and PVNS. TGCT is a small, localized tumor that usually occurs on the fingers and is easily controlled by surgery. PVNS is a more aggressive tumor in and around large joints that can recur and cause significant morbidity. The evidence suggesting a central role for CSF1 in the pathogenesis of these tumors suggests that they might respond to treatment with specific inhibitors of this pathway (e.g., SU11248) (5).
Materials and Methods
TMA Construction. TMAs were constructed by using a manual tissue arrayer (Beecher Instruments, Silver Spring, MD) following techniques described in ref. 17. A previously constructed set of two TMAs (TA38 and TA39) that represented >50 different soft-tissue-tumor entities by a total of 460 600-μM cores in duplicate (a total of 920 cores) formed the initial target of ISH for the four RTKs studied. These cores represent material from 421 patients, with several patients having more than one specimen appearing on the arrays (8, 17). The cores were taken from soft-tissue-tumor samples archived at the Stanford University Medical Center Department of Pathology between 1995 and 2001. Three new TMAs (TA117, TA137, and TA153) were constructed for the purpose of this study, and the cases represented on them are shown in Table 1, which is published as supporting information on the PNAS web site. TA137 has nine cases of TGCT from TA38. TA38, TA39, and TA117 were used for the initial RTK screening, representing 507 cases of soft-tissue tumors. TA137 and TA153 were used for further FISH and ISH analysis of TGCT and PVNS. Digital images of all stains on all tumors in searchable format were stored at the publicly available Stanford Tissue Microarray Consortium.
RNA ISH. ISH of TMA sections was performed based on a protocol published in ref. 8. More details are provided in the supporting information, which is published on the PNAS web site. The primer sequences are given in Table 2, which is published as supporting information on the PNAS web site. TA38, 39, 137, 153, and 117 were stained with oligodT to assess preservation of tissue RNA by using the INFORM ISH oligodT control probe (Ventana Medical Systems, Tuscon, AZ). ISH scoring was based on recognizing a strong dot-like staining pattern associated with cells. Only cores that had RNA as detected by an oligodT probe were scored.
Immunohistochemistry. Primary antibodies toward CD163 (NovoCastra, Newcastle Upon Tyne, U.K.) and CSF1 (GeneTex, San Antonio, TX) were used. More details are provided in supporting information, which is published on the PNAS web site. Digital images of all cores stained by hematoxylin and eosin or immunohistochemistry were collected by using the BLISS system from Bacus Laboratories (Lombard, IL).
Combined ISH and Immunohistochemistry. For double staining, ISH was performed first, followed by immunostaining. A streptavidin Alexa Fluor 594 conjugate (S-32356, Invitrogen) diluted at 1:500 was used to visualize the ISH probe for CSF1. The slide was imaged by using a Nikon E1000 microscope with UV-2E DAPI and Texas red HYQ filter cubes (Nikon) fitted with a CoolSNAP K4 (Photometrics, Tucson, AZ) camera. Subsequently, the coverslip was removed, and the slide was restained with anti-CD163 antibody (NovoCastra, diluted 1:100) by using the DAKO EnVision+ System and the Vector VIP substrate kit and counterstained with hematoxylin. The slide was imaged again by using bright-field and RGB color filters. The fluorescence image was aligned to and superimposed on the bright-field image by selecting the DAPI channel and using photoshop cs Version 8 (Adobe Systems, San Jose, CA). For the final image, the DAPI channel was removed, leaving the Texas red channel superimposed on the bright-field image.
FISH. Sections (6-μm thick) of the TMA slides were pretreated as described in ref. 25. Metaphases and metaphase slides were produced by using standard methods. Locus-specific FISH analysis was performed by using the following BACs from the Human BAC Library RPCI-11 (BACPAC Resources Centre, Children's Hospital Oakland Research Institute, Oakland, CA) unless otherwise noted. Listed centromeric to telomeric: 354C7, 19F3 and 96F24 (chromosome 1), and 155J6, 205L13, 585E12, 97L10, CTD-2344F21 (CITB Human D BAC library, Invitrogen), 279M4, 258O3, and 497D24 (chromosome 2). BACs were directly labeled with either Spectrum green or Spectrum orange (Vysis, Downer's Grove, IL). The chromosomal locations of all BACs were validated by using normal metaphases (results not shown). Probe labeling and FISH was performed by using Vysis reagents according to the manufacturer's protocols. Slides were counterstained with DAPI for microscopy. For all slides, FISH signals and patterns were identified on a Zeiss Axioplan epifluorescent microscope. Signals were interpreted manually, and images were captured by using the isis FISH imaging software (MetaSystems Group, Belmont, MA). A cutoff of ≥2 breaks per 100 nuclei was selected for a positive score based on examining 230 other soft-tissue tumors. Efficiency of the break-apart FISH probes on TMAs was demonstrated with the t(X;18) in synovial sarcomas (26).
Combined FISH and Immunohistochemistry. Combined FISH and immunohistochemistry was performed by using the pretreatment steps of the standard immunohistochemistry, followed by application of the antibody, followed by hybridization with the FISH probes. BACs were directly labeled with either Spectrum green or Spectrum orange (Vysis). The immunohistochemistry was labeled with Cy5.
Gene Array. Tumors were collected from three academic institutions [Vancouver General Hospital (Vancouver), University of Washington Medical Center, and Stanford University Medical Center], with institutional review board approval. After resection, a representative sample was quickly frozen and stored at –80°C. Before processing, frozen sections of the tissue were cut and histologically examined to ensure that the tissue represented the diagnostic entity. Only cases with classic histologic findings were used. Eight cases of PVNS and seven cases of TGCT were compared with six cases of SFT and seven cases of DFT. In the cases of SFT and DTF, all cases except two (STT3237 and STT3524) have been published in ref. 27. Spot cDNA microarrays (42,000) were used to measure the relative mRNA-expression levels in the tumors. The details of isolating mRNA, labeling, and hybridizing are described in ref. 28. The raw data files are publicly available at Stanford Microarray Database. Data were filtered by using the following criteria: Only cDNA spots with a ratio of signal-over-background of at least 1.5 in both the Cy3 and the Cy5 channel were included, only cDNA spots that fulfill these criteria on at least 70% of the arrays were included, and only cDNAs were selected that had an absolute value at least four times greater in at least two arrays than the geometric mean. Data were evaluated with unsupervised hierarchical clustering and significance analysis of microarrays (SAM) (29).
Supplementary Material
Acknowledgments
T.O.N. and D.H. are scholars of the Michael Smith Foundation for Health Research, Vancouver.
Conflict of interest statement: No conflicts declared.
This paper was submitted directly (Track II) to the PNAS office.
Abbreviations: BAC, bacterial artificial chromosome; DFSP, dermatofibrosarcoma protuberans; DTF, desmoid-type fibromatosis; GIST, gastrointestinal stromal tumor; ISH, in situ hybridization; PVNS, pigmented villonodular synovitis; RTK, receptor tyrosine kinase; SFT, solitary fibrous tumor; TGCT, tenosynovial giant-cell tumor; TMA, tissue microarray.
References
- 1.Manning, G., Whyte, D. B., Martinez, R., Hunter, T. & Sudarsanam, S. (2002) Science 298, 1912–1934. [DOI] [PubMed] [Google Scholar]
- 2.Heinrich, M. C., Corless, C. L., Demetri, G. D., Blanke, C. D., von Mehren, M., Joensuu, H., McGreevey, L. S., Chen, C. J., Van den Abbeele, A. D., Druker, B. J., et al. (2003) J. Clin. Oncol. 21, 4342–4349. [DOI] [PubMed] [Google Scholar]
- 3.Rubin, B. P., Schuetze, S. M., Eary, J. F., Norwood, T. H., Mirza, S., Conrad, E. U. & Bruckner, J. D. (2002) J. Clin. Oncol. 20, 3586–3591. [DOI] [PubMed] [Google Scholar]
- 4.Buchdunger, E., Cioffi, C. L., Law, N., Stover, D., Ohno-Jones, S., Druker, B. J. & Lydon, N. B. (2000) J. Pharmacol. Exp. Ther. 295, 139–145. [PubMed] [Google Scholar]
- 5.Murray, L. J., Abrams, T. J., Long, K. R., Ngai, T. J., Olson, L. M., Hong, W., Keast, P. K., Brassard, J. A., O'Farrell, A. M., Cherrington, J. M. & Pryer, N. K. (2003) Clin. Exp. Metastasis 20, 757–766. [DOI] [PubMed] [Google Scholar]
- 6.Kononen, J., Bubendorf, L., Kallioniemi, A., Barlund, M., Schraml, P., Leighton, S., Torhorst, J., Mihatsch, M. J., Sauter, G. & Kallioniemi, O. P. (1998) Nat. Med. 4, 844–847. [DOI] [PubMed] [Google Scholar]
- 7.Subramanian, S., West, R. B., Marinelli, R. J., Nielsen, T. O., Rubin, B. P., Goldblum, J. R., Patel, R. M., Zhu, S., Montgomery, K., Ng, T. L., et al. (2005) J. Pathol. [DOI] [PubMed]
- 8.West, R. B., Corless, C. L., Chen, X., Rubin, B. P., Subramanian, S., Montgomery, K., Zhu, S., Ball, C. A., Nielsen, T. O., Patel, R., et al. (2004) Am. J. Pathol. 165, 107–113. [DOI] [PMC free article] [PubMed] [Google Scholar]
- 9.Jaffe, H., Lichtenstein, L. & Sutro, C. (1941) Arch. Pathol. 31, 731. [Google Scholar]
- 10.Dal Cin, P., Sciot, R., Samson, I., De Smet, L., De Wever, I., Van Damme, B. & Van den Berghe, H. (1994) Cancer Res. 54, 3986–3987. [PubMed] [Google Scholar]
- 11.Mertens, F., Orndal, C., Mandahl, N., Heim, S., Bauer, H. F., Rydholm, A., Tufvesson, A., Willen, H. & Mitelman, F. (1993) Genes Chromosomes Cancer 6, 212–217. [DOI] [PubMed] [Google Scholar]
- 12.Nilsson, M., Hoglund, M., Panagopoulos, I., Sciot, R., Dal Cin, P., Debiec-Rychter, M., Mertens, F. & Mandahl, N. (2002) Virchows Arch. 441, 475–480. [DOI] [PubMed] [Google Scholar]
- 13.Ohjimi, Y., Iwasaki, H., Ishiguro, M., Kaneko, Y., Tashiro, H., Emoto, G., Ogata, K. & Kikuchi, M. (1996) Cancer Genet. Cytogenet. 90, 80–85. [DOI] [PubMed] [Google Scholar]
- 14.Rowlands, C. G., Roland, B., Hwang, W. S. & Sevick, R. J. (1994) Hum. Pathol. 25, 423–425. [DOI] [PubMed] [Google Scholar]
- 15.Sciot, R., Rosai, J., Dal Cin, P., de Wever, I., Fletcher, C. D., Mandahl, N., Mertens, F., Mitelman, F., Rydholm, A., Tallini, G., et al. (1999) Mod. Pathol. 12, 576–579. [PubMed] [Google Scholar]
- 16.Vogrincic, G. S., O'Connell, J. X. & Gilks, C. B. (1997) Hum. Pathol. 28, 815–819. [DOI] [PubMed] [Google Scholar]
- 17.West, R. B., Harvell, J., Linn, S. C., Liu, C. L., Prapong, W., Hernandez-Boussard, T., Montgomery, K., Nielsen, T. O., Rubin, B. P., Patel, R., et al. (2004) Am. J. Surg. Pathol. 28, 1063–1069. [DOI] [PubMed] [Google Scholar]
- 18.Simon, M. P., Pedeutour, F., Sirvent, N., Grosgeorge, J., Minoletti, F., Coindre, J. M., Terrier-Lacombe, M. J., Mandahl, N., Craver, R. D., Blin, N., et al. (1997) Nat. Genet. 15, 95–98. [DOI] [PubMed] [Google Scholar]
- 19.Linn, S. C., West, R. B., Pollack, J. R., Zhu, S., Hernandez-Boussard, T., Nielsen, T. O., Rubin, B. P., Patel, R., Goldblum, J. R., Siegmund, D., et al. (2003) Am. J. Pathol. 163, 2383–2395. [DOI] [PMC free article] [PubMed] [Google Scholar]
- 20.Nguyen, T. T., Schwartz, E. J., West, R. B., Warnke, R. A., Arber, D. A. & Natkunam, Y. (2005) Am. J. Surg. Pathol. 29, 617–624. [DOI] [PubMed] [Google Scholar]
- 21.O'Connell, J. X., Fanburg, J. C. & Rosenberg, A. E. (1995) Hum. Pathol. 26, 771–775. [DOI] [PubMed] [Google Scholar]
- 22.Barreda, D. R., Hanington, P. C. & Belosevic, M. (2004) Dev. Comp. Immunol. 28, 509–554. [DOI] [PubMed] [Google Scholar]
- 23.Guilbert, L. J. & Stanley, E. R. (1980) J. Cell Biol. 85, 153–159. [DOI] [PMC free article] [PubMed] [Google Scholar]
- 24.Kinzler, K. W. & Vogelstein, B. (1998) Science 280, 1036–1037. [DOI] [PubMed] [Google Scholar]
- 25.Makretsov, N., He, M., Hayes, M., Chia, S., Horsman, D. E., Sorensen, P. H. & Huntsman, D. G. (2004) Genes Chromosomes Cancer 40, 152–157. [DOI] [PubMed] [Google Scholar]
- 26.Terry, J., Barry, T. S., Horsman, D. E., Hsu, F. D., Gown, A. M., Huntsman, D. G. & Nielsen, T. O. (2005) Diagn. Mol. Pathol. 14, 77–82. [DOI] [PubMed] [Google Scholar]
- 27.West, R. B., Nuyten, D. S., Subramanian, S., Nielsen, T. O., Corless, C. L., Rubin, B. P., Montgomery, K., Zhu, S., Patel, R., Hernandez-Boussard, T., et al. (2005) PLoS Biol. 3, e187. [DOI] [PMC free article] [PubMed] [Google Scholar]
- 28.Nielsen, T. O., West, R. B., Linn, S. C., Alter, O., Knowling, M. A., O'Connell, J. X., Zhu, S., Fero, M., Sherlock, G., Pollack, J. R., et al. (2002) Lancet 359, 1301–1307. [DOI] [PubMed] [Google Scholar]
- 29.Tusher, V. G., Tibshirani, R. & Chu, G. (2001) Proc. Natl. Acad. Sci. USA 98, 5116–5121. [DOI] [PMC free article] [PubMed] [Google Scholar]
Associated Data
This section collects any data citations, data availability statements, or supplementary materials included in this article.


