

Abstract
Dietary conjugated linoleic acid (CLA) reduces body fat in animals and some humans. Here we show that trans-10, cis-12 CLA, but not cis-9, trans-11 CLA, when added to cultures of stromal vascular cells containing newly differentiated human adipocytes, caused a time-dependent decrease in triglyceride content, insulin-stimulated glucose and fatty acid uptake, incorporation into lipid, and oxidation compared with controls. In parallel, gene expression of peroxisome proliferator-activated receptor-γ and many of its downstream targets were diminished by trans-10, cis-12 CLA, whereas leptin gene expression was increased. Prior to changes in gene expression and metabolism, trans-10, cis-12 CLA caused a robust and sustained activation of mitogen-activated protein kinase kinase/extracellular signal-related kinase (MEK/ERK) signaling. Furthermore, the trans-10, cis-12 CLA-mediated activation of MEK/ERK could be attenuated by pretreatment with U0126 and pertussis toxin. In parallel, pretreatment with U0126 blocked the ability of trans-10, cis-12 CLA to alter gene expression and attenuate glucose and fatty acid uptake of the cultures. Intriguingly, the induction by CLA of MEK/ERK signaling was linked to hypersecretion of adipocytokines interleukin-6 and interleukin-8. Collectively, these data demonstrate for the first time that trans-10, cis-12 CLA decreases the triglyceride content of newly differentiated human adipocytes by inducing MEK/ERK signaling through the autocrine/paracrine actions of interleukins-6 and 8.
Conjugated linoleic acid (CLA)1 refers to a naturally occurring group of dienoic derivatives of linoleic acid. The two predominant isomers of CLA, which are found primarily in ruminant meats and milk products and commercial preparations, are cis-9, trans-11 CLA and trans-10, cis-12 CLA. Originally identified as potential anticarcinogenic compounds (1, 2), CLA isomers have also been shown to prevent or attenuate obesity (3, 4). Animal studies have clearly demonstrated that a crude mixture of CLA isomers, and specifically trans-10, cis-12 CLA, prevents the development of obesity (5–10) in vivo and triglyceride (TG) content in adipocytes in vitro (11, 12). However, the effects and potential mechanism(s) of action of CLA on human adiposity are less clear and conflicting (for review, see Refs. 3 and 4).
Intriguingly, there are striking similarities between the effects of tumor necrosis factor-α (TNF-α) and CLA treatment in murine and human adipocytes (13–31). In adipocytes, initiation of TNF-α receptor signaling activates all three members of the mitogen-activated protein kinase (MAPK) family (24–26), including the p44/p42 (also termed extracellular signal-related kinases, ERK1/2), the c-Jun-NH2-terminal kinases (JNK; also termed stress-activated protein kinases, SAPK), and p38 MAPK (also termed stress/cytokine-activated kinases). It has been clearly demonstrated that MAPK activation results in regulation of gene expression by phosphorylating a variety of transcription factors and altering their transcriptional efficiency in a variety of cell types (32). Importantly in adipocytes, both ERK and JNK can phosphorylate PPAR-γ, which results in repression of its transcriptional activation potential, and adipogenesis (33–36). TNF-α signaling has also been shown to repress PPAR-γ gene expression, which blocks adipogenic conversion and causes dedifferentiation of mature 3T3-L1 adipocytes (16). Furthermore, ERK activation in adipocytes has been linked to insulin resistance (37) and increased lipolysis (38), two phenomena seen with CLA treatment in murine and human adipocytes (5, 12). In addition to TNF-α, other proinflammatory cytokines such as IL-1 and IL-6 and chemokines such as IL-8, monocyte chemotactic protein (MCP)-1, and macrophage inflammatory protein (MIP)-1α have been shown to promote adipocyte delipidation and insulin resistance (39–44). Importantly, all cytokines (i.e. TNF-α, IL-1, IL-6) or chemokines (i.e. IL-8, MCP-1, MIP-1α) that suppress adipogenesis utilize ERK as a critical signal downstream of their respective receptor systems in multiple cell types (24–26, 45–50).
Based on these observations, we examined the role of MEK/ERK signaling and adipocytokines in the isomer-specific, TG-lowering actions of CLA. Here, we demonstrate that trans-10, cis-12 CLA activates ERK1/2, but not p38 or JNK MAPKs, unlike TNF-α, which activates all three MAPKs (24). The importance of CLA-induced ERK activation was demonstrated by the fact that pretreatment with the MEK inhibitor U0126 blocked the ability of CLA to alter gene expression and attenuate glucose and fatty acid (FA) uptake of the cultures. The novel delayed, yet sustained kinetics of ERK activation by CLA, and the involvement of a pertussis toxin (PTX)-sensitive G protein-coupled receptor (GPCR), suggested that a secretory network must exist for CLA to activate ERK. Finally, using protein array technology, we have identified IL-6 and IL-8 as critical autocrine/paracrine regulators of CLA-induced ERK activation. Collectively, these studies demonstrate for the first time that trans-10, cis-12 CLA induces the expression and secretion of the proinflammatory adipocytokines IL-6 and IL-8, and through autocrine and paracrine networks, these mediators reduce human adipocyte TG content by activating MEK/ERK signaling.
EXPERIMENTAL PROCEDURES
Chemicals and Reagents
All cell cultureware and scintillation mixture (Scintisafe) were purchased from Fisher Scientific. d-[U-14C]Glucose was purchased from ICN Biochemicals, Inc. (Irvine, CA). 2-d-[1,2-3H]deoxyglucose, [1-14C]oleic acid, and Western Lightning Plus chemiluminescence Substrate were purchased from PerkinElmer Life Sciences. Bicinchoninic acid protein assay and Restore™ Western blot stripping buffer were purchased from Pierce. NUPAGE precast gels and buffers for SDS-PAGE were purchased from Invitrogen. Gene-specific primers for real time PCR were purchased from DNA Technology A/S (Aarhus, Denmark), and the real time PCR kit was from Applied Biosystems (Copenhagen, Denmark). Fetal bovine serum was purchased from Cambrex/BioWhittaker (Walkersville, MD). Linoleic acid (99% pure) was purchased from Nu-Check-Prep (Elysian, MN), and isomers of CLA (+98% pure) were purchased from Matreya (Pleasant Gap, PA). Rubber stoppers and an inverted center well hanging bucket for oxidation assays were purchased from Kontes Glass Company (Vineland, NJ). Recombinant human TNF-α was purchased from Upstate Biotechnology (Lake Placid, NY). Recombinant IL-6 and IL-8 proteins were purchased from Research Diagnostics Inc. (Boston). PTX, PP2, calphostin C, rapamycin, H-89, brefeldin A, and bisindolymaleimide-1 were purchased from Calbiochem. Antibodies for total and phospho-specific MAPKs and U0126 were purchased from Cell Signaling Technologies (Beverly, MA). Phospho-p38 (pT180/pY182) monoclonal antibody were purchased from BD Transduction Laboratories (Franklin Lakes, NJ). Mouse monoclonal PPAR-γ antibody was purchased from Santa Cruz Biotechnology (Santa Cruz, CA). Rhodamine red and fluorescein isothiocyanate-conjugated IgG were purchased from Jackson Immunoresearch (West Grove, PA). Cytokine arrays were purchased from Raybiotech, Inc. (Norcross, GA). Monoclonal neutralization antibodies targeted against TNF-α, IL-6, and IL-8 were purchased from R & D Systems, Inc. (Minneapolis). All other chemicals and reagents were purchased from Sigma Chemical, unless otherwise stated.
Culturing of Stromal Vascular (SV) Cells Isolated from Human Adipose Tissue
Abdominal adipose tissue was obtained from females with a body mass index <30.0 during liposuction or elective surgery with consent from the Institutional Review Board at University of North Carolina-Greensboro, or purchased from Zen Bio, Inc. (Research Triangle Park, NC) as described previously (13, 14). SV cells isolated from single subjects were used in some experiments, and another set of pooled SV cells obtained from Zen Bio, Inc. representing six independent human donors was used in parallel. Data obtained from single subject isolations and from pooled lots responded similarly, thus the data were merged. Cells were isolated and cultured as defined previously (11, 12). Under these isolation and culturing conditions, ~50 –80% of the cells had visible lipid droplets when the treatments were initiated. Experimental treatment of cultures of SV cells containing newly differentiated adipocytes began on day 12–15 of differentiation.
Fatty Acid Preparation
Both isomers of CLA and linoleic acid were complexed to FA-free (>98%) bovine serum albumin (BSA) at a 4:1 molar ratio using 1 mm BSA stocks.
Lipid Staining and Triglyceride Content Determination
The presence of intracellular lipid was visualized by staining the cultures with oil red O, and TG content was determined using a colorimetric assay (GPO Trinder, Sigma) as described previously (11, 12).
2-[3H]Deoxyglucose Uptake
Cultures were seeded at 4 × 10⁴ cells/cm2 in 35-mm culture plates and allowed to differentiate for 12 days as described in the cell culture protocol. For chronic 72-h treatment (see Fig. 2), vehicle or FA treatments were added in adipocyte medium for 48 h on day 12. Then, for an additional 24 h, cultures were incubated in 1 ml of serum-free basal DMEM containing 1,000 mg/liter d-(+)-glucose with or without 20 pm human insulin in the presence of vehicle or FA treatments, to give a total of 72-h exposure to treatments. For U0126 and PTX rescue experiments (see Fig. 8), 12-day-old cultures were serum starved for 24 h in DMEM/Ham’s F-12 medium, pretreated with inhibitors for 1 h, and then the medium was spiked with treatments for an additional 24 h. Immediately after experimental incubations, 2-[3H]deoxyglucose uptake was measured as described previously (12).
Fig. 2. Isomer-specific regulation by CLA of insulin-stimulated glucose uptake and metabolism.

Cultures of SV cells containing newly differentiated human adipocytes were treated (TRT) continuously for 72 h with either a BSA vehicle or 30 μm cis-9, trans-11 CLA (9,11) or trans-10, cis-12 CLA (10,12). A, basal and insulin-stimulated uptakes of 4 nmol of 2-[3H]deoxyglucose were measured after a 90-min incubation in the absence (−) or presence (+) of 100 nm insulin; the basal control (BSA, –insulin) rate of uptake was ~100 pmol/(h·mg of protein). B, basal and insulin-stimulated de novo conversions of 2.2 nmol of [14C]glucose into [14C]lipid were measured after a 3-h incubation in the absence or presence of 100 nm insulin; the basal control rate was ~10 pmol/(h·mg of protein). C, basal and insulin-stimulated [14C]CO2 production from 2.2 nmol of [14C]glucose were measured after a 3-h incubation in the absence or presence of 100 nm insulin; the basal control rate was ~11 pmol/(h·mg of protein). All data are expressed as a percentage of basal vehicle control (BSA, – insulin) rate. Means (± S.E.; n = 6) not sharing common superscript differ, p < 0.05.
Fig. 8. Trans-10, cis-12 CLA-induced alterations in glucose and FA uptake are blocked by pretreatment with U0126 and PTX.
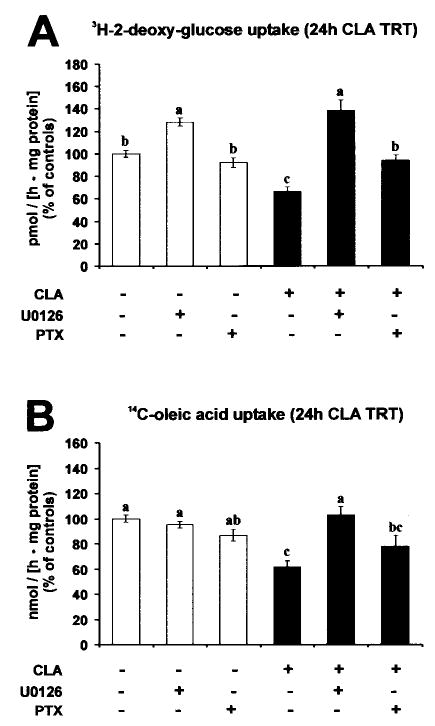
Cultures of SV cells containing newly differentiated human adipocytes were serum starved for 24 h and pretreated with or without 10 μm U0126 or 100 ng/ml PTX for 1 h. Subsequently, cultures were treated with either a BSA vehicle or 30 μm trans-10, cis-12 CLA complexed to BSA for an additional 24 h. A, insulin-stimulated uptake of 4 nmol of 2-[3H]deoxyglucose was measured after a 90-min incubation in the absence or presence of 100 nm insulin; the control rate of uptake was ~130 pmol/(h·mg of protein). B, [14C]oleic acid (12.5 nmol) uptake was measured after a 2-h incubation; the control rate of uptake was ~11 nmol/(h·mg of protein). Data are expressed as a percentage of vehicle control (BSA) rate. Means (± S.E.; n = 6) not sharing common superscripts differ, p < 0.05.
[14C]CO2 Production and de Novo Lipid Synthesis from [14C]Glucose
Cultures were seeded at 4 × 10⁴ cells/cm2 in 35-mm culture plates and allowed to differentiate for 12 days as described in the cell culture protocol. For chronic 72-h treatment (see Fig. 2), vehicle or FA treatments were added in adipocyte medium for 48 h, on day 12. Then, for an additional 24 h, cultures were incubated in 1 ml of serum-free basal DMEM containing 1,000 mg/liter d-(+)-glucose with or without 20 pm human insulin in the presence of vehicle or FA treatments, to give a total of 72-h exposure to treatments. After experimental incubation, culture medium was removed and replaced with 1 ml of Hanks’ balanced salt solution (HBSS) buffer containing 100 nm human insulin for 10 min. After insulin preincubation, 20 μl of HBSS containing 2.2 nmol of d-[U-14C]glucose (specific activity = 231 mCi/mmol) was added to each plate, and the plate was placed quickly in an air-tight CO2 collection chamber as described previously (12). The CO2 collection chamber was incubated at 37 °C for 3 h (a time course study indicated a linear increase in radiolabeled production and incorporation into lipid CO2 from [14C]glucose over a 4-h period; data not shown). After the 3-h incubation, the center well collection bucket was cut out of the collection chamber and delivered to a liquid scintillation counting vial, the cells were extracted and partitioned, and fractions were subjected to liquid scintillation counting as described previously (11, 12).
[14C]Oleic Acid Uptake and Metabolism
Cultures were seeded at 4 × 10⁴ cells/cm2 in 35-mm culture plates and allowed to differentiate for 12 days as described in the cell culture protocol. For chronic 72-h treatment (see Fig. 3), vehicle or FA treatments were added in adipocyte medium for 48 h on day 12. Then, for an additional 24 h, cultures were incubated in 1 ml of serum-free basal DMEM containing 1,000 mg/liter d-(+)-glucose in the presence of vehicle or FA treatments, to give a total of 72-h exposure to treatments. For U0126 and PTX rescue experiments (see Fig. 8), 12-day-old cultures were serum starved for 24 h in DMEM/Ham’s F-12 medium, pretreated with inhibitors for 1 h, and then the medium was spiked with treatments for an additional 24 h. After experimental incubation, culture medium was removed and replaced with 1 ml of HBSS buffer containing 100 nm human insulin. Prior to incubation, [14C]oleic acid was complexed to FA-free (>98%) BSA at a 4:1 molar ratio using 1 mm BSA stocks. Then, 12.5 nmol of [14C]oleic acid (specific activity = 40–60 mCi/mmol) complexed to BSA was added to each well and incubated at 37 °C for 2 h (a time course study indicated a linear incorporation of [14C]oleic acid into [14C]CO2-, [14C]lipid-, and 14C-water-soluble cellular fractions over a 4-h period; data not shown). After 2 h, medium containing unincorporated isotope was removed, and monolayers were washed three times with HBSS. After the 2-h incubation, the center well collection bucket was cut out of the collection chamber and delivered to a liquid scintillation counting vial, the cells were extracted and partitioned, and fractions were subjected to liquid scintillation counting as described previously (12). Total cellular uptake was derived by combining the dpm collected in both the lipid-soluble and the water-soluble cellular fractions, excluding those captured in CO2.
Fig. 3. Isomer-specific regulation of FA uptake and metabolism by CLA.
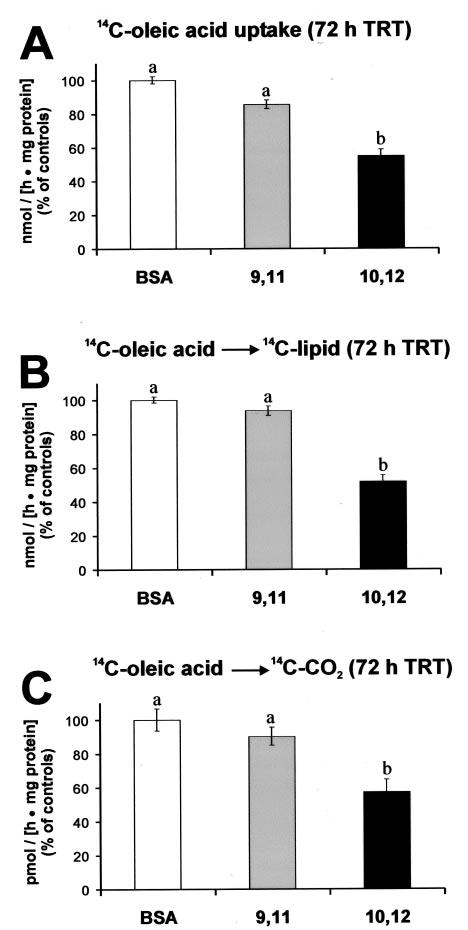
Cultures of SV cells containing newly differentiated human adipocytes were treated (TRT) continuously for 72 h with either a BSA vehicle, 30 μm cis-9, trans-11 CLA (9,11) or trans-10, cis-12 CLA (10,12). A, [14C]oleic acid (12.5 nmol) uptake was measured after a 2-h incubation; the control rate of uptake was ~15 nmol/(h·mg of protein). B, [14C]oleic acid (12.5 nmol) incorporation into [14C]lipid was measured after a 2-h incubation; the control rate was ~ 12 nmol/(h·mg of protein). C, [14C]CO2 production from [14C]oleic acid was measured after a 2-h incubation; the control rate was ~100 pmol/(h·mg of protein). Data are expressed as a percentage of vehicle control (BSA) rate. Means (± S.E.; n = 6) not sharing a common superscript differ, p < 0.05.
RNA Isolation and Quantitative Real Time PCR
Total RNA was isolated using Tri Reagent (Molecular Research Center, Inc., Cincinnati, OH) following the manufacturer’s protocol. First strand cDNA synthesis and real time quantitative PCR were carried out using the ABI PRISM 7700 Sequence Detection System (Applied Biosystems), as described previously (12). Primer sets for acyl-CoA-binding protein (ACBP), FA-binding protein (aP2), CAAT/enhancer binding protein-α (C/EBP-α), glycerol-3-phosphate dehydrogenase (GPDH), leptin, perilipin, PPAR-γ1, PPAR-γ2, and TATA-binding protein have been described previously (12). The following primer sets used were also used in this work: adiponectin (accession no. NM_004797) sense (5′-GAACCTGGAGAAGGTGCCTATG-3′), antisense (5′-CAATCCCACACTGAATGCTGA-3′); cbl-associated protein (CAP) (accession no. HSA489942) sense (5′-GGCAGCAATGGGCAAGAC-3′), antisense (5′-AGAGCGTGCGCGTAAAGG-3′); insulin-dependent glucose transporter 4 (GLUT4) (accession no. NM_001042) sense (5′-GTCATCAATGCCCCTCAGAA-3′), antisense (5′-CCAGCCACGTCTCATTGTA-3′); lipoprotein lipase (accession no. NM_000237) sense (5′-AGCTATCCGCGTGATTGCA-3′), antisense (5′-ACTAGCTGGTCCACATCTCCAAG-3′); IL-6 (accession no. NM_000600) sense (5′-AGCTCTATCTCGCCTCCAGGA-3′), antisense (5′-CGCTTGTGGAGAAGGAGTTCATA-3′); IL-8 (accession no. NM_000584) sense (5′-CACCGGAAGGAACCATCTCA-3′), antisense (5′-CGGCCAGCTTGGAAGTCAT-3′).
MAPK Activation Assays
Activation of MAPKs was determined by measuring the phosphorylation state of MEK, ERK, JNK, and p38 (51). Cultures were seeded at 4 × 10⁴ cells/cm2 in 35-mm culture plates and allowed to differentiate for 12 days as described in the cell culture protocol. On day 12, cultures were serum starved for 24 h in DMEM/Ham’s F-12 medium prior to FA stimulation. After serum starvation, the medium was spiked with FA treatments because changing the medium alone transiently activates MAPK pathways in the cultures.2 After experimental FA incubations, the medium was removed quickly, and the monolayers were washed gently once with ice-cold HBSS. The cells were then solubilized by the direct addition of a modified radioimmune precipitation assay lysis buffer containing PBS (pH 7.5), 1% Nonidet P-40, 0.1% SDS, 0.5% sodium deoxycholate, 2 mm Na3VO4, 20 mm β-glycerophosphate, 10 mm NaF, and a protease inhibitor mixture (Calbiochem) including 500 μm AEBSF, 1 μg/ml aprotinin, 1 μm E-64, 500 μm EDTA, and 1 μm leupeptin. Monolayers were immediately scraped, transferred to prechilled microfuge tubes, and triturated to break up cells. Cell lysates were then sonicated three times for 5 s and stored on ice for an additional 20 min. Cell debris was pelleted by centrifugation at 14,000 rpm at 4 °C, and the resulting supernatant was collected for analysis. The protein concentration of each sample was determined using a bicinchoninic acid assay (Pierce). SDS-PAGE and transfer of protein to polyvinylidene difluoride membranes were carried out on the same day as the protein harvest to prevent freeze-thaw degradation of phosphoproteins, as described previously (12). After transfer, membranes were blocked in Tris-buffered saline (TBS), supplemented with 0.1% Tween 20 (TBS-T) and 5% nonfat dried milk for 1 h at room temperature. The membranes were washed twice with TBS-T and incubated in TBS-T supplemented with 5% BSA and the following primary antibodies overnight at 4 °C: rabbit polyclonal phospho-MEK1/2 (Ser217/Ser221), phospho-p44/42 (P-ERK1/2, Thr202/Tyr204), and phospho-SAPK/JNK (Thr183/Tyr185), all from Cell Signaling Technologies, and mouse monoclonal phospho-p38 (pT180/pY182) from BD Transduction Laboratories. The next morning, primary antibody was washed four times for 5 min with TBS-T, and the membranes were immediately incubated with the appropriate horseradish peroxidase-conjugated secondary antibodies for 1 h. After four washes with TBS-T, chemiluminescence was initiated by the addition of Western Lightning Plus (PerkiuElmer Life Sciences) and subsequent exposure to x-ray film (X-Omat; Eastman Kodak). Membranes were subsequently stripped with Restore™ Western blot stripping buffer, and reprobed with antibodies for total ERK1/2 and total MEK1/2 to determine equal loading of lanes.
In Vitro Kinase Assay
ERK1/2 MAPK activity was measured using a commercially available kit (Cell Signaling Technologies), following the manufacturer’s protocol. Briefly, cell lysates were harvested as described in MAPK activation assays and were incubated with an immobilized monoclonal antibody targeted for active ERK1/2 (phospho-p44/42, Thr202/Tyr204) overnight at 4 °C. The resulting immunoprecipitate was washed and then incubated in the presence of its substrate (recombinant ELK-1 protein) in a kinase buffer containing 200 μm ATP for 30 min at 30 °C. The resulting kinase reaction was then subjected to SDS-PAGE, and immunodetection of phosphorylated ELK-1 was conducted with a phospho-specific ELK-1 primary antibody. Fully active recombinant ERK 2 was used as a positive control, as well as a cell extract treated with 100 ng/ml TNF-α for 30 min, which has been shown previously to activate endogenous ERK1/2 robustly (24, 26).
Immunofluorescence Microscopy
Cultures were seeded at 4 × 10⁴ cells/cm2 on coverslips and induced to differentiate as described in cell culture protocol for 12 days. On day 12, cultures were serum starved for 24 h in DMEM/Ham’s F-12 medium. For active ERK1/2 immunodetection (see Fig. 6C) cultures were treated with either a vehicle control (BSA), 30 μm cis-9, trans-11 CLA, or 30 μm trans-10, cis-12 CLA for 24 h, or with the known ERK activator (24, 26) TNF-α (100 ng/ml) for 30 min. Cells were fixed in 3% paraformaldehyde in PBS for 20 min and permeabilized with 0.2% Triton X-100 on ice for 10 min. Coverslips were then quenched and blocked in PBS containing 1 mg/ml saponin, 10 mm glycine, and 1.25 mg/ml goat IgG for 1 h. Immunodetection was carried out by incubating cells with 1:25 dilution of a rabbit polyclonal phospho-p44/42 (P-ERK1/2, Thr202/Tyr204) antibody followed by three washes with PBS. Coverslips were then incubated with a 1:100 dilution of fluorescein isothiocyanate-conjugated goat anti-rabbit IgG for 1 h. For cytokine localization (see Fig. 10), cultures were pretreated with 1 μg/ml brefeldin A for 1 h to prevent cytokine secretion (cells not pretreated with brefeldin A lack detectable IL-6 or IL-8; data not shown) and subsequently treated with either a vehicle (BSA) or 30 μm trans-10, cis-12 CLA for 24 h. After fixation and permeabilization with 1 mg/ml saponin, the cells were blocked as described above. Fixed monolayers were then incubated with a 1:500 dilution of a polyclonal rabbit anti-aP2 antibody (a gift from David Bernlohr, University of Minnesota) for 12 h followed by rhodamine red-conjugated anti-rabbit IgG. This was followed by extensive washing, a second blocking step, and a 12-h incubation with either an anti-IL-6 (MAB206) or anti-IL-8 (MAB208) mouse monoclonal antibody. Cytokine immunodetection was carried out using a fluorescein isothiocyanate-conjugated anti-mouse IgG. To positively identify nuclei, 1 μg/ml Hoechst stain was used. After adequate washing with PBS, fluorescent images were captured with a SPOT digital camera mounted on an Olympus BX60 fluorescence microscope.
Fig. 6. Effect of pharmacological inhibitors on trans-10, cis-12 CLA-mediated activation and nuclear accumulation of P-ERK1/2.
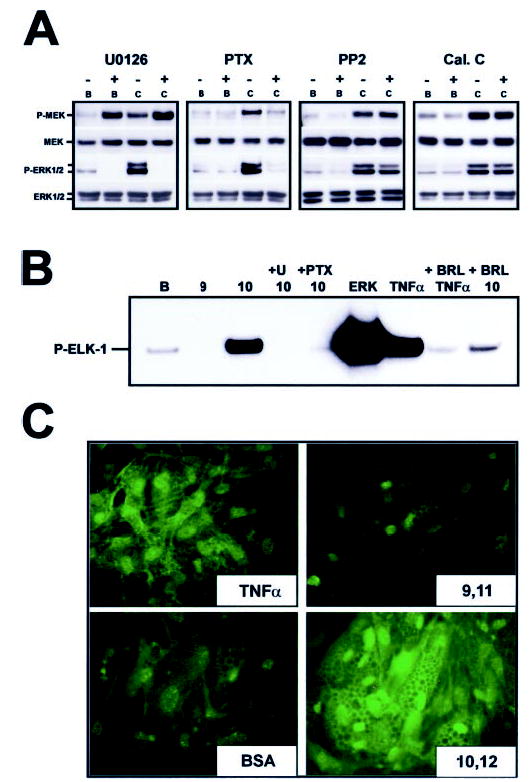
Cultures of SV cells containing newly differentiated human adipocytes were serum starved for 24 h and then treated as follows. A, cultures were pretreated with the MEK inhibitor U0126 (10 μm), the GPCR-Gi/o coupling inhibitor PTX (100 ng/ml), the c-SRC kinase inhibitor PP2 (1 μm), or the protein kinase C inhibitor calphostin C (Cal. C, 200 nm) for 1 h and subsequently treated with either a BSA vehicle (B) or 30 μm trans-10, cis-12 CLA complexed to BSA (C) for an additional 24 h. Cell extracts were immunoblotted for the active phosphorylated forms of MEK (P-MEK) and ERK (P-ERK1/2) and subsequently were stripped and reprobed with antibodies recognizing total MEK (MEK), and total ERK (ERK1/2). Data shown are representative of two to three independent experiments for each panel. B, cultures were pretreated with a vehicle (dimethyl sulfoxide) for 1 h, 10 μm U0126 for 1 h, 100 ng/ml PTX for 1 h, or 1 μm BRL49653 for 24 h, and subsequently treated with a BSA vehicle (B), 30 μm cis-9, trans-11 CLA complexed to BSA (9), or 30 μm trans-10, cis-12 CLA complexed to BSA (10) for an additional 24 h. Active ERK was then immunoprecipitated from total cell extracts and used in an in vitro kinase reaction with its known substrate, recombinant ELK-1. The resulting kinase reaction was subjected to SDS-PAGE and probed for phosphorylated ELK-1 using a phospho-specific antibody. A 30-min TNF-α treatment (100 ng/ml) of human adipocytes and active ERK-2 (ERK) was used as positive control for enzyme activation. C, cultures were pretreated with either a BSA vehicle control, 30 μm cis-9, trans-11 CLA (9,11), or 30 μm trans-10, cis-12 CLA (10,12) for 24 h. A 30-min treatment with TNF-α was used as a positive control for MAPK activation. Active ERK1/2 was then detected using immunofluorescence microscropy. Data shown are representative of two to three independent experiments for each panel.
Fig. 10. CLA-induced IL-6 and IL-8 production predominates from nonadipocyte SV cells.
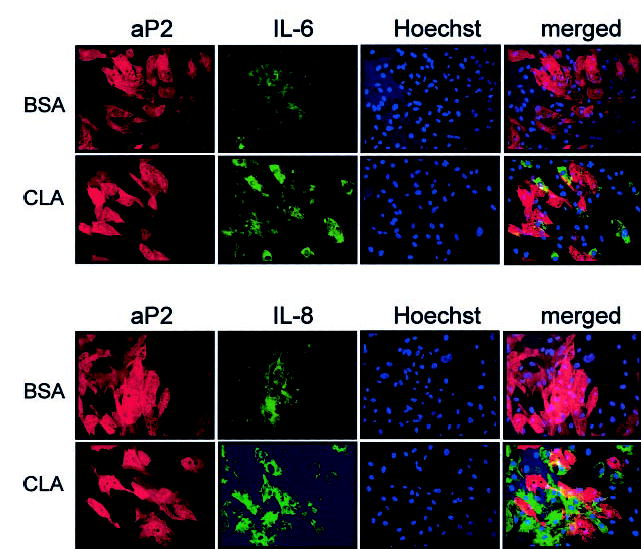
Cultures of SV cells containing newly differentiated human adipocytes were serum starved for 24 h and pretreated with 1 μg/ml brefeldin A for 1 h to prevent cytokine or chemokine secretion. Subsequently, cultures were treated with either a BSA vehicle or 30 μm trans-10, cis-12 CLA for an additional 12 h. Cultures were double stained for aP2 (rhodamine-conjugated anti-rabbit IgG = red) and subsequently for individual cytokines IL-6 or IL-8 (fluorescein isothiocyanate-conjugated anti-mouse IgG = green). Hoechst staining was conducted to identify nuclei positively. Fluorescent images (magnification, ×20) were captured as described under “Experimental Procedures.” Results shown are representative of two separate experiments from independent human subjects.
Cytokine Array
Cultures were seeded at 4 × 10⁴ cells/cm2 in 60-mm culture plates and allowed to differentiate for 12 days as described in the cell culture protocol. On day 12, cultures were serum starved for 24 h in 4 ml of DMEM/Ham’s F-12 medium, pretreated with 10 μm U0126 for 1 h, and then the medium was spiked with vehicle or FA treatments for an additional 24 h. After experimental incubation, conditioned medium was removed, and cell debris was pelleted by centrifugation. Cytokine detection was carried out using the manufacturer’s recommendations, with minor alterations (RayBiotech Inc.). Briefly, array membranes were incubated in the provided blocking buffer for 30 min. After blocking, array membranes were incubated with 3 ml of conditioned medium for 2 h, and membranes were washed extensively. Biotinylated anti-cytokine antibody mixture was added for 1.5 h. After extensive washing, horseradish peroxidase-conjugated streptavidin was added for 45 min, and membranes were again washed extensively. Chemiluminescence was initiated by the addition of ECL reagent and subsequent exposure to x-ray film (for a complete map of the 42 cytokine array template (human cytokine array) see www.raybiotech.com/images/map_all.htm#c).
Statistical Analyses
Unless otherwise indicated, data are expressed as the mean ± S.E. Data were analyzed using one-way analysis of variance followed by Student’s t tests for each pair for multiple comparisons. Differences were considered significant if p < 0.05. All analyses were performed using JMP IN version 4.04 (SAS Institute; Cary, NC) software. For the real time qPCR data presented in Figs. 4, 7, and 9B, data from one representative experiment of three to four independent experiments are presented, and therefore no statistics were performed on these data. Although the magnitude of change in response to treatment varied among experiments because of subject to subject variation, the treatment patterns were the same for all replicates.
Fig. 4. Chronic trans-10, cis-12 CLA treatment alters gene expression.
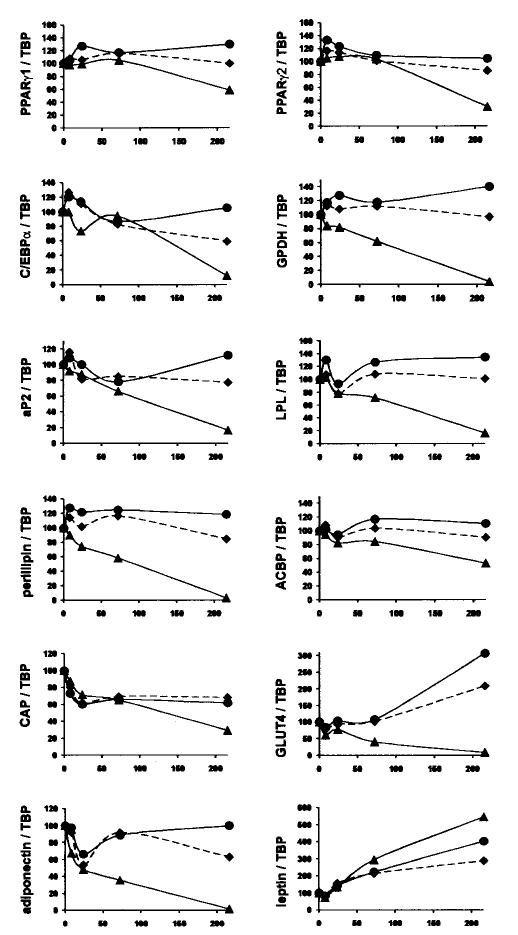
Cultures of SV cells containing newly differentiated human adipocytes were treated continuously for 8, 24, 72, or 216 h with either a BSA (♦) vehicle, or 30 μm cis-9, trans-11 CLA (•), or trans-10, cis-12 CLA (▴). After treatment, total RNA was harvested and used for first strand cDNA synthesis. Real time quantitative PCR analyses were performed to examine the expression of acyl-CoA-binding protein (ACBP), adiponectin, ap2, CAP, C/EBP-α, GLUT4, GPDH, leptin, lipoprotein lipase (LPL), perilipin, and PPAR-γ1 and PPAR-γ2. Results shown are representative of three separate experiments from independent human subjects.
Fig. 7. Trans-10, cis-12 CLA-induced alterations in adipocyte gene expression are blocked by pretreatment with the MEK inhibitor U0126.
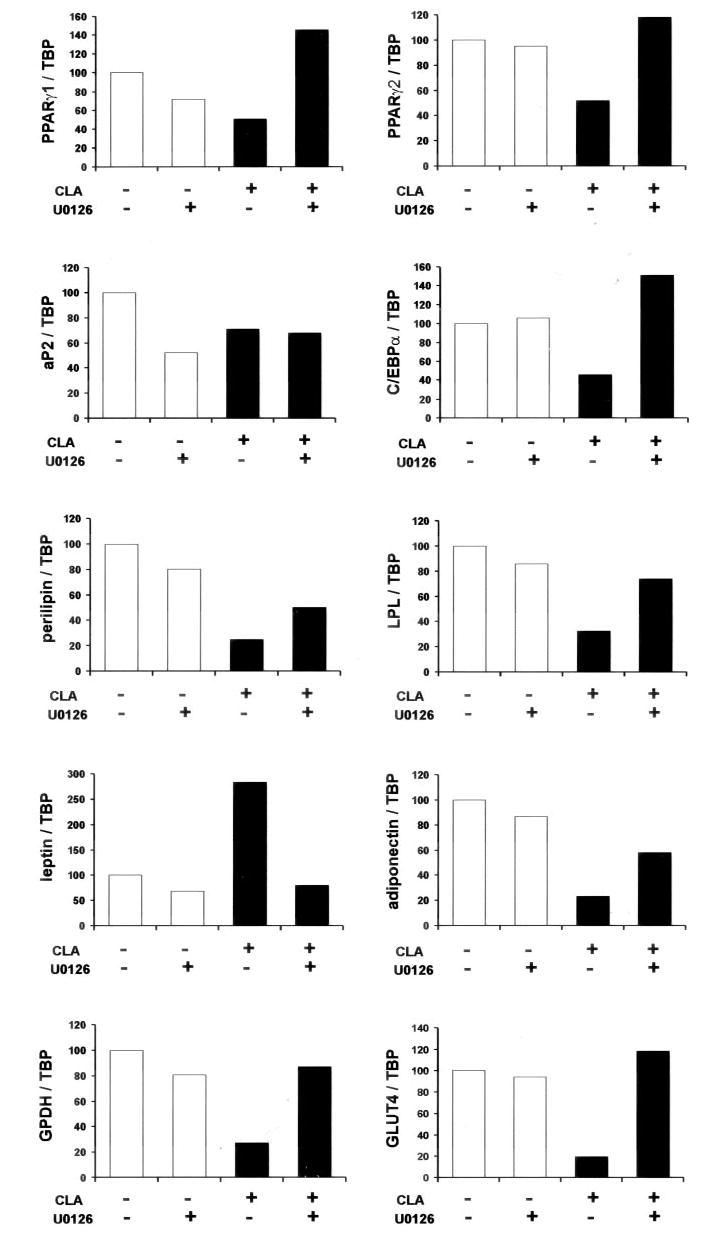
Cultures of SV cells containing newly differentiated human adipocytes were serum starved for 24 h and pretreated with or without 10 μm U0126 for 1 h. Subsequently, cultures were treated with either a BSA vehicle or 30 μm trans-10, cis-12 CLA for an additional 24 h. After 24 h of treatment, total RNA was harvested and used for first strand cDNA synthesis. Real time quantitative PCR analyses were performed to examine the expression of adiponectin, aP2, C/EBP-α, GLUT4, GPDH, leptin, lipoprotein lipase (LPL), perilipin, and PPAR-γ1 and PPAR-γ2. Results shown are representative of four separate experiments from independent human subjects.
Fig. 9. Trans-10, cis-12 CLA induces MEK/ERK-dependent cytokine secretion and mRNA expression.
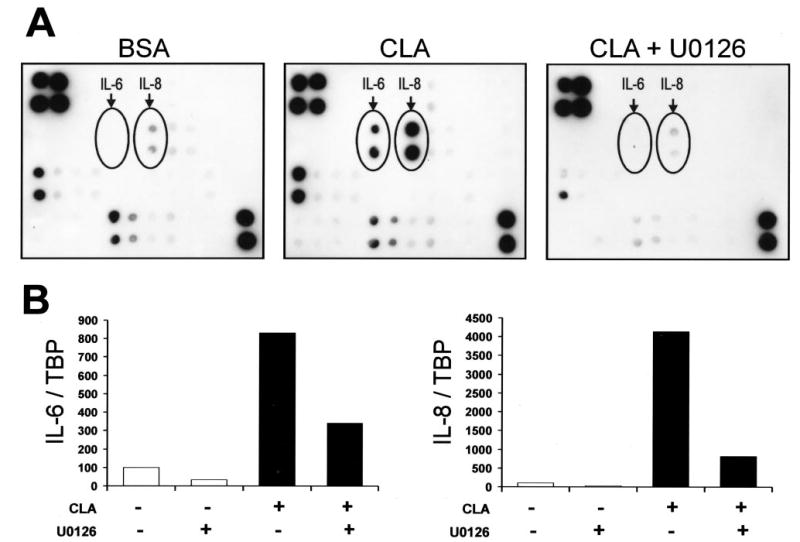
Cultures of SV cells containing newly differentiated human adipocytes were serum starved for 24 h and pretreated with or without 10 μm U0126 for 1 h. Subsequently, cultures were treated with either a BSA vehicle or 30 μm trans-10, cis-12 CLA for an additional 24 h. A, conditioned medium was collected and utilized to detect the secretion of multiple cytokines using protein array technology. Positive control spots (used to normalize between membranes) are located in the upper left corner (n = 4) and the lower right corner (n = 2), and CLA-induced cytokines spotted in duplicate are indicated as IL-6 and IL-8. B, total RNA was harvested and used for first strand cDNA synthesis. Real time quantitative RT-PCR analyses were performed to examine the expression of IL-6 and IL-8. Results shown are representative of two (A) or four (B) separate experiments from independent human subjects.
RESULTS
Trans-10, Cis-12 CLA Decreases TG Content and Alters Cell Morphology
To determine the isomer-specific influence of CLA on TG content and lipid droplet morphology, cultures of SV cells containing newly differentiated adipocytes were treated with 30 μm trans-10, cis-12 CLA, cis-9, trans-11 CLA, linoleic acid (FA control), or vehicle (BSA) for either 1, 2, or 3 weeks. As shown in Fig. 1A, the TG content of cultures treated with trans-10, cis-12 CLA decreased over time, whereas the TG content increased over time in all other cultures. Changes in lipid droplet morphology in the trans-10, cis-12 CLA-treated cultures were apparent after 1 week of treatment (data not shown). After 3 weeks of treatment, cultures treated with trans-10, cis-12 CLA had fewer adipocytes with unilocular lipid droplets and more adipocytes with multilocular lipid droplets compared with cis-9, trans-11 CLA, linoleic acid, or control cultures (Fig. 1B).
Fig. 1. Trans-10, cis-12 CLA decreases TG content.
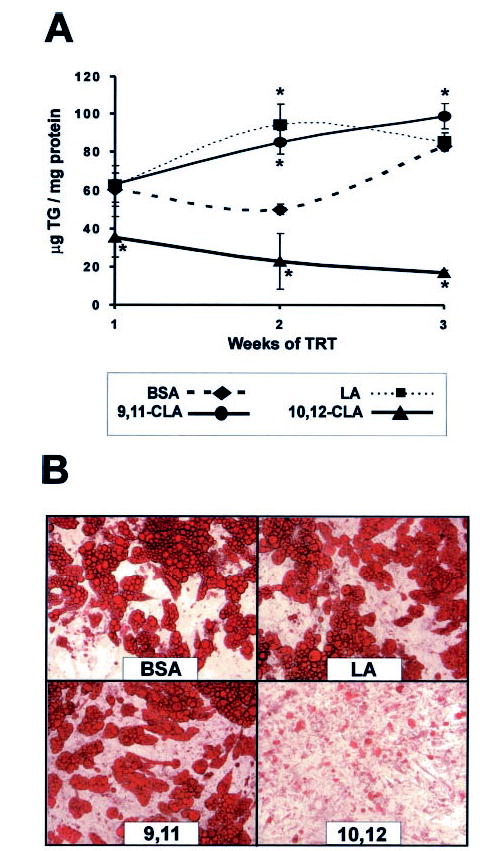
Cultures of SV cells containing newly differentiated adipocytes were treated (TRT) continuously for 1, 2, or 3 weeks with either a BSA vehicle or 30 μm linoleic acid (LA), cis-9, trans-11 CLA (9,11), or trans-10, cis-12 CLA (10,12). A, after 1, 2, or 3 weeks of treatment, cultures were harvested, and TG content was determined using a colorimetric assay. Data are expressed as μg of TG/mg of total cellular protein. Means (± S.E.; n = 8) with asterisks differ significantly (p < 0.05) from the 1 week controls. B, after 3 weeks of treatment, cultures were stained with oil red O, and phase-contrast photomicrographs were taken using an Olympus inverted microscope with a 20× objective.
Trans-10, Cis-12 CLA Decreases Glucose Uptake, Incorporation into Lipid, and Oxidation
To determine the extent to which trans-10, cis-12 CLA decreased the TG content by decreasing glucose uptake or utilization, cultures of SV cells containing newly differentiated adipocytes were treated with 30 μm trans-10, cis-12 CLA, cis-9, trans-11 CLA, or vehicle (BSA) for 72 h and then radiolabeled glucose uptake, conversion to lipid, and oxidation were measured. As seen in Fig. 2A, 2-[3H]deoxyglucose uptake was lower in insulin-stimulated, but not basal (e.g. –insulin), cultures treated with trans-10, cis-12 CLA compared with all other treatments. De novo lipogenesis, as measured by [14C]glucose incorporation into [14C]lipid, was lower in trans-10, cis-12 CLA-treated cultures under basal and insulin-stimulated conditions compared with their respective controls (Fig. 2B). Glucose oxidation, as determined by [14C]CO2 production from [14C]glucose, was lower in insulin-stimulated cultures treated with trans-10, cis-12 CLA compared with all other treatments (Fig. 2C). In contrast, in the absence of insulin, glucose oxidation was not significantly affected by CLA. These data show that trans-10, cis-12 CLA decreases adipocyte TG content, in part, by reducing insulin-stimulated glucose uptake and de novo lipogenesis of the cultures.
Trans-10, Cis-12 CLA Decreases FA Uptake, Incorporation into Lipid, and Oxidation
To determine the extent to which trans-10, cis-12 CLA decreased the TG content by decreasing FA uptake or utilization, cultures of SV cells containing newly differentiated adipocytes were treated with 30 μm cis-9, trans-11 CLA, trans-10, cis-12 CLA, or vehicle (BSA) for 72 h and then radiolabeled FA uptake, incorporation into lipid, and oxidation were measured. [14C]Oleic acid uptake (Fig. 3A), incorporation into [14C]lipid (Fig. 3B), and oxidation to [14C]CO2 (Fig. 3C) were lower in cultures treated with trans-10, cis-12 CLA compared with all other treatments. These data demonstrate that trans-10, cis-12 CLA decreases adipocyte TG content, in part, by decreasing FA uptake of the cultures. This is important because quantitatively, human adipocytes derive most of their FAs for TG synthesis from exogenous FAs compared with de novo lipogenesis (12).
Chronic Trans-10, Cis-12 CLA Treatment Decreases the Expression of Markers of Adipocyte Differentiation
To determine the extent to which the trans-10, cis-12 CLA-mediated reductions in glucose and lipid uptake and utilization were caused by suppression of genes that regulate these processes, we examined the time-dependent effects of CLA on the expression of PPAR-γ, the master regulator of adipocyte differentiation, and several of its downstream targets. As seen in Fig. 4, there was a time-dependent decrease in the mRNA levels of all genes except leptin in cultures treated with trans-10, cis-12 CLA. Messenger RNA levels of PPAR-γ1 and PPAR-γ2 were markedly lower in cultures treated for 9 days with trans-10, cis-12 CLA compared with BSA or cis-9, trans-11 CLA-treated cultures. Similarly, mRNA levels of PPAR-γ target genes such as C/EBP-α, aP2, lipoprotein lipase, acyl-CoA-binding protein, CAP, perilipin, adiponectin, and GLUT4 were lower in trans-10, cis-12 CLA-treated cultures on day 9 compared with the other treatments. Messenger RNA levels of GPDH, a mid-late marker of adipocyte differentiation, were barely detectable on day 9 in CLA-treated cultures. In contrast, the expression of leptin, an adipocyte-specific secreted protein that has been shown to be repressed by ligand-bound PPAR-γ (52), was higher in cultures treated with trans-10, cis-12 CLA on day 9 compared with all other treatments. Within this targeted panel of genes which are known to be up-regulated during adipocyte differentiation, GPDH, perilipin, adiponectin, and GLUT4 seemed to be the earliest genes affected (i.e. reduced levels seen within 8–24 h), and these genes were essentially nondetectable after 9 days of trans-10, cis-12 CLA treatment. Collectively, these data suggest that the trans-10, cis-12 CLA-mediated reductions in glucose and FA uptake and utilization demonstrated in Figs. 2 and 3 are likely the result of decreased expression and/or activity of PPAR-γ and downstream PPAR-γ-target genes that are abundantly expressed in adipocytes and regulate adipocyte metabolism.
Sustained Activation of MEK/ERK Signaling by Trans-10, Cis-12 CLA Is Blocked by U0126 and PTX
Based on the striking similarities between treatment with CLA and TNF-α in adipocytes (i.e. adipocyte delipidation, insulin resistance, and decreased PPAR-γ target gene expression), we examined in serum-starved cultures the phosphorylation status of three MAPKs (ERK1/2, JNK, p38) known to be activated by TNF-α. As shown in Fig. 5A, a 30-min treatment of cultures of SV cells containing newly differentiated adipocytes with TNF-α stimulated hyperphosphorylation of p38, JNK, and ERK1/2. In contrast, trans-10, cis-12 CLA only induced ERK1/2 phosphorylation, not p38 or JNK. Because MAPKs are stress-induced and normally activated acutely and transiently (32), we determined the effects of vehicle (BSA) and the duration of treatment on ERK1/2 phosphorylation and its upstream activator, MEK. When cultures were exposed acutely to the BSA vehicle, MEK and ERK1/2 were transiently activated between 0.5 and 8.0 h (Fig. 5B). In contrast, cultures treated with trans-10, cis-12 (complexed to BSA) exhibited the transient activation seen with vehicle alone but also showed a second phase of MEK/ERK activation beginning at 12 h. Furthermore, robust and sustained activation of MEK/ERK signaling was demonstrated after chronic (12–72 h) treatment with trans-10, cis-12 CLA, which was not seen with the BSA vehicle alone. Surprisingly, when we used dimethyl sulfoxide as a vehicle to deliver CLA acutely (5 min–24 h), we did not see ERK1/2 activation by CLA other than the transient activation caused by the vehicle alone (data not shown).
Fig. 5. Isomer-specific regulation of MEK/ERK signaling by CLA.
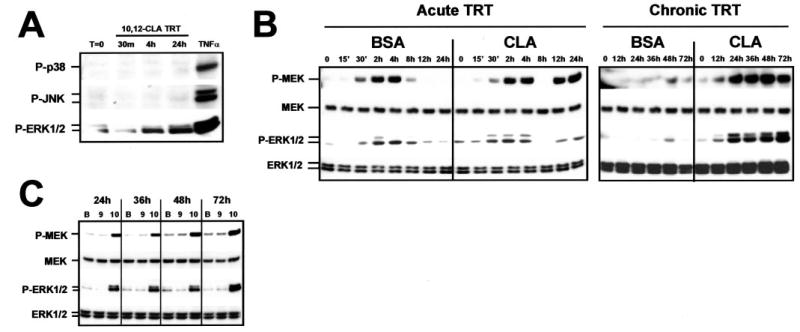
Cultures of SV cells containing newly differentiated human adipocytes were serum starved for 24 h and then treated (TRT) for the indicated time points with the indicated treatments. A, cultures were treated with 30 μm trans-10, cis-12 CLA for 30 min, 4 h, or 24 h. A 30-min treatment with TNF-α was used as a positive control for MAPK activation. Cell extracts were immunoblotted for the phosphorylated forms of p38 MAPK, JNK-MAPK, or p44/p42 (ERK1/2) MAPK. B, cultures were treated acutely (≤24 h) or chronically (12–72 h) with either a BSA vehicle or 30 μm trans-10, cis-12 CLA complexed to BSA. Cell extracts were immunoblotted for the phosphorylated forms of the MAPK kinase (P-MEK) and p44/p42 extracellular signal-related MAPK (P-ERK1/2) and subsequently were stripped and reprobed with antibodies recognizing total MEK (MEK), and total ERK (ERK1/2). C, cultures were treated with either a BSA vehicle (B), 30 μm cis-9, trans-11 CLA (9), or 30 μm trans-10, cis-12 CLA (10) complexed to BSA for 24–72 h. Cell extracts were immunoblotted for P-MEK, P-ERK1/2, total MEK, and total ERK1/2. Data shown are representative of three to seven independent experiments for each panel.
To determine whether this novel robust and sustained activation of MEK/ERK was isomer-specific, cultures were treated with 30 μm cis-9, trans-11 CLA or trans-10, cis-12 CLA for 24 –72 h. As shown in Fig. 5C, MEK/ERK activation was specific for the trans-10, cis-12 isomer of CLA. These data show that the isomer-specific effects of CLA on TG content and gene expression of the cultures correlate with MEK/ERK activation.
To determine critical signaling steps involved in trans-10, cis-12 CLA-induced MEK/ERK signaling, we used pharmacological inhibitors to block upstream regulators of ERK1/2. First, the effects of the MEK inhibitor U0126 were tested in the presence and absence of trans-10, cis-12 CLA. U0126 binds to MEK, thereby inhibiting its catalytic activity and phosphorylation of ERK1/2. As shown in Fig. 6A, pretreatment with U0126 blocked the trans-10, cis-12 CLA activation of ERK1/2 after 24 h of treatment. However, U0126 pretreatment paradoxically increased MEK hyperphosphorylation. Similarly, PTX, an inhibitor of GPCR-Gi/o coupling, blocked trans-10, cis-12 CLA activation of MEK and ERK1/2, indicating that a PTX-sensitive GPCR is critical for CLA-induced MEK/ERK activation. In contrast, neither a c-SRC kinase inhibitor (PP2; Fig. 6A), two protein kinase C inhibitors (calphostin C; Fig. 6A or bisindolylmaleimide-1; data not shown), a protein kinase A inhibitor (H-89; data not shown), a FRAP/mTOR inhibitor (rapamycin; data not shown), nor a phosphatidylinositol 3-kinase inhibitor (LY294002; data not shown) blocked the CLA activation of MEK/ERK signaling. Consistent with these data, trans-10, cis-12 CLA treatment conferred the ability of ERK1/2 to phosphorylate its nuclear substrate ELK-1 in vitro (Fig. 6B). In parallel with the inhibition of ERK1/2 phosphorylation, pretreatment with either U0126 or PTX blocked the CLA-mediated ability of ERK1/2 to phosphorylate ELK-1 in vitro. Enzyme activation of ERK1/2 (as evidenced by in vitro phosphorylation of ELK-1) by TNF-α and trans-10, cis-12 CLA could be attenuated by pretreatment with the PPAR-γ agonist BRL49653. Lastly, we demonstrated in Fig. 6C that both TNF-α and trans-10, cis-12 CLA treatment for 30 min and 24 h, respectively, increased the abundance of P-ERK1/2 in the nucleus of both nonadipocyte SV cells and newly differentiated adipocytes using immunofluorescence microscopy. This is important because nuclear ERK1/2 has been shown to phosphorylate a variety of transcription factors including PPAR-γ (33–36), which could potentially be implicated in CLA transcriptional attenuation of adipogenesis. However, trans-10, cis-12 CLA-mediated activation of MEK/ERK signaling did not result in the hyperphosphorylation of PPAR-γ in total cell extracts (data not shown), whereas phorbol ester (12-O-tetradecanoylphorbol-13-acetate) treatment caused PPAR-γ1 and PPAR-γ2 hyperphosphorylation as demonstrated previously (33).
Taken together, these data demonstrate that: 1) CLA-mediated hyperphosphorylation and activation of ERK enzyme activity are isomer-specific and can be blocked by pretreatment with the MEK inhibitor U0126, the GPCR-Gi/o coupling inhibitor PTX, and the PPAR-γ agonist BRL49653; and 2) neither c-SRC kinase, protein kinase C, protein kinase A, FRAP/mTOR, nor phosphatidylinositol 3-kinase is required for CLA sustained activation of MEK/ERK signaling. These data suggest CLA activation of MEK/ERK signaling is dependent on an upstream GPCR-Gi/o protein-coupled receptor. Additionally, because of the time lag prior to MEK/ERK activation (e.g. 12 h after CLA treatment), the impact of CLA on the MEK/ERK signaling pathway is most likely an indirect, rather than a direct effect.
Trans-10, Cis-12 CLA-mediated Regulation of Gene Expression Is Blocked by U0126
To determine the obligatory role of MEK/ERK signaling in the CLA regulation of gene expression, we investigated the impact of U0126 on the expression PPAR-γ and several of its target genes saliently expressed in adipocytes and GPDH in serum-starved cultures. As shown in Fig. 7, the levels of mRNA for PPAR-γ1, PPAR-γ2, C/EBP-α, perilipin, lipoprotein lipase, adiponectin, GLUT4, and GPDH were lower in cultures treated with trans-10, cis-12 CLA for 24 h compared with controls. Interestingly, U0126 pretreatment prevented or attenuated this CLA-induced decrease in gene expression, with the exception of aP2. Likewise, the CLA-induced increase in leptin expression was completely blocked by U0126.
Trans-10, Cis-12 CLA Attenuation of Glucose and FA Uptake Is Reversed by U0126 and PTX
To determine whether GPCR-Gi/o coupling and MEK/ERK signaling are obligate for the attenuation of glucose and lipid metabolism by CLA, we investigated the influence of PTX and U0126 on glucose and FA uptake in cultures of SV cells containing newly differentiated adipocytes. 2-[3H]Deoxyglucose (Fig. 8A) and [14C]oleic acid (Fig. 8B) uptake were lower in cultures treated with trans-10, cis-12 CLA for 24 h compared with controls. However, PTX and U0126 pretreatment prevented or attenuated this CLA-mediated decrease in glucose and FA uptake. Collectively, these data show the obligatory role of GPCR-mediated activation of MEK/ERK signaling in the trans-10, cis-12 CLA regulation of glucose and FA uptake and metabolism.
Trans-10, Cis-12 CLA Markedly Increases IL-6 and IL-8 Secretion and Gene Expression, Which Are Attenuated by U0126
Although CLA did not affect TNF-α gene expression, protein expression, or secretion (data not shown), we tested whether other adipocytokines known to oppose adipocyte differentiation and promote insulin resistance were involved. To this end, we treated cultures for 24 h with either vehicle (BSA) or 30 μm trans-10, cis-12 CLA with or without U0126 pretreatment and then measured the levels of 42 cytokines or chemokines in conditioned media using a membrane-based human cytokine antibody array and the mRNA levels of selected adipocytokines in the cells using real time qPCR. We used TNF-α treatment as a positive control for induction of cytokine synthesis and secretion. As seen in Fig. 9A, the levels of IL-6 and IL-8 were increased markedly in conditioned media of cultures treated with CLA compared with controls, which were reversed by U0126. As expected, TNF-α treatment also increased IL-6 and IL-8 levels (data not shown). Similarly, the mRNA levels of IL-6 and IL-8 were increased 7- and 40-fold, respectively, in cultures treated with CLA compared with controls, and this induction was attenuated by U0126 pretreatment (Fig. 9B). These data demonstrate for the first time in cultures of SV cells containing newly differentiated human adipocytes that trans-10, cis-12 CLA increases mRNA levels and protein secretion of IL-6 and IL-8, which are dependent, at least in part, on MEK/ERK signaling.
Trans-10, Cis-12 CLA Increases IL-6 and IL-8 Production Predominately from SV Cells
Using immunolocalization microscopy of cultures pretreated for 1 h with brefeldin A to prevent cytokine secretion, trans-10, cis-12 CLA induced IL-6 and IL-8 synthesis, which appeared to be localized primarily in nonadipocytes (e.g. cells devoid of lipid droplets and without staining for aP2) (Fig. 10). These data demonstrate for the first time in cultures of SV cells containing newly differentiated human adipocytes that trans-10, cis-12 CLA increases IL-6 and IL-8 production primarily in nonadipocyte SV cells.
Il-6 Neutralization Reverses Trans-10, Cis-12 CLA Activation of ERK1/2
To determine whether IL-6 or IL-8 could activate MEK/ERK signaling in the cultures, we examined the effects of recombinant IL-6 and IL-8 on ERK1/2 phosphorylation over a short time course (0–30 min). Recombinant TNF-α treatment was used as a positive control because it has been shown previously to activate ERK robustly in human adipocytes (24, 26). Recombinant IL-6 caused robust ERK1/2 phosphorylation within 10–30 min (Fig. 11A). In addition, ERK activation by IL-6 was effectively attenuated by the addition of a monoclonal IL-6 neutralization antibody (Fig. 11B). Intriguingly, antibody neutralization of IL-6 also attenuated trans-10, cis-12 CLA activation of ERK1/2 (Fig. 11B), implicating IL-6 in CLA-mediated ERK activation. Furthermore, recombinant IL-8 caused ERK1/2 phosphorylation that peaked at 10 min (Fig. 11A), and a monoclonal IL-8 neutralization antibody attenuated ERK activation (Fig. 11B). However, antibody neutralization of IL-8 did not attenuate trans-10, cis-12 CLA-mediated activation of ERK. Although TNF-α activated ERK1/2 (Fig. 11A) as reported previously (24, 26), antibody neutralization of TNF-α did not reverse CLA activation of ERK1/2 (Fig. 11B). Collectively, these data demonstrate that IL-6, IL-8, and TNF-α all induce ERK activation in cultures of SV cells containing newly differentiated human adipocytes. In addition, these data implicate IL-6, and possibly IL-8, as early mediators of trans-10, cis-12 CLA activation of MEK/ERK signaling.
Fig. 11. The autocrine/paracrine actions of IL-6 are necessary for trans-10, cis-12 CLA-mediated induction of MEK/ERK signaling.
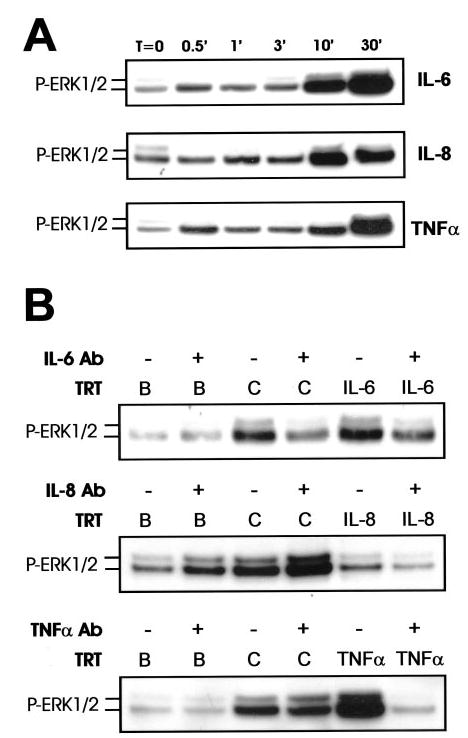
Cultures of SV cells containing newly differentiated human adipocytes were serum starved for 24 h and A, treated with human recombinant IL-6, IL-8, or TNF-α (all 100 ng/ml) for 0–30 min; or B, pretreated with or without neutralizing antibodies (Ab) for IL-6 (50 μg/ml), IL-8 (50 μg/ml), or TNF-γ (20 μg/ml) and subsequently treated with either a BSA vehicle (B) or 30 μm trans-10, cis-12 CLA for an additional 24 h or recombinant IL-6, IL-8, or TNF-α for an additional 30 min. Total cell extracts were immunoblotted for P-ERK1/2. Data shown are representative of two to three independent experiments for each panel.
DISCUSSION
Several studies (13, 54–56) have demonstrated that although trans-10, cis-12 CLA decreased adipose tissue mass in vivo, it promoted insulin resistance and/or lipodystrophy. However, the underlying mechanism causing these effects is unclear. In this article, we demonstrate for the first time that trans-10, cis-12 CLA decreases the TG content of cultures of SV cells containing newly differentiated human adipocytes through MEK/ERK-dependent transcriptional control of genes involved in glucose and FA uptake and metabolism. Furthermore, our data demonstrate that CLA-induced MEK/ERK activation depends on a proinflammatory signaling network involving hypersecretion of IL-6 and IL-8 and activation of their respective receptor systems in the cultures. Taken together, we propose in our working model (Fig. 12) that trans-10, cis-12 CLA 1) increases the production of proinflammatory cytokines and chemokines, particularly IL-6 and IL-8, which in turn 2) activate their respective cell surface receptors IL-6R and CXCR1 3) through unidentified signaling transducers, 4) activate MEK/ERK phosphorylation, which 5) promotes P-ERK1/2 translocation to the nucleus and subsequent phosphorylation of transcription factors, including ELK-1, and potentially others that then 6) down-regulate PPAR-γ and downstream adipogenic gene expression, thereby attenuating insulin-sensitive glucose and FA uptake and 7) lead to insulin resistance, impaired adipocyte FA clearance, and reduced cellular TG content. Importantly, trans-10, cis-12 CLA is the first noncytokine (nutrient) effector of MEK/ERK signaling described in human adipocytes. These data are also the first to demonstrate a specific mechanism by which trans-10, cis-12 CLA reduces the TG content of cultures of SV cells containing newly differentiated human adipocytes. They also support the notion raised by several human studies that trans-10, cis-12 CLA supplementation causes insulin resistance (54, 55), which could potentially be linked IL-6 and IL-8 hypersecretion from adipose tissue. However, further studies are needed to test this hypothesis.
Fig. 12. Model of trans-10, cis-12 CLA-mediated adipocyte delipidation: metabolic control through adipocytokine-initiated, MEK/ERK-dependent repression of PPAR-γ.
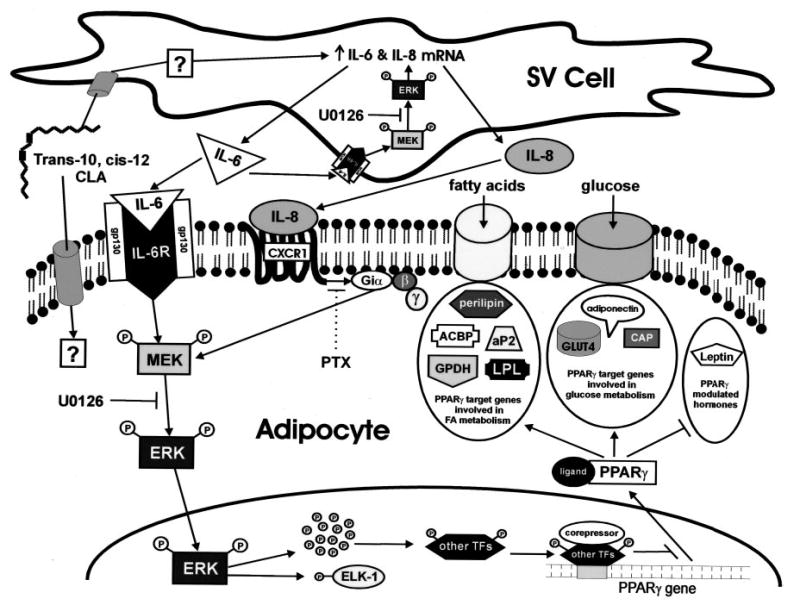
CLA can either enter into the adipocyte, where it may have direct effects or enter into the supporting SV cells to initiate an autocrine/paracrine signaling network. In the SV cell, CLA through a currently unidentified mechanism, increases the mRNA expression and secretion of IL-6 and IL-8. The resulting nascent IL-6 binds to its obligate transmembrane receptor (IL-6R), both on the surface of the adipocyte and the SV cell, where it activates MEK/ERK signaling in both cell populations. In addition, nascent IL-8 binds to its obligate heptahelical receptor (CXCR1), a PTX-sensitive GPCR only expressed in adipocytes, to amplify further MEK/ERK signaling in the adipocyte. The autocrine actions of nacent IL-6 in SV cells result in sustained activation of MEK/ERK signaling, which augments IL-6 and IL-8 mRNA expression, thereby feed-forwarding their synthesis and secretion. The collective paracrine actions of both IL-6 and IL-8 in the adipocyte results in sustained MEK and ERK hyperphosphorylation. Hyperphosphorylated ERK is then shuttled into the nucleus where it can phosphorylate multiple transcription factors (TFs) including ELK-1 and potentially other unidentified transcription factors. The ERK-dependent phosphorylation of other transcription factors may repress the expression of PPAR-γ itself. Collectively, ERK-dependent repression of PPAR-γ gene expression blocks the ability of PPAR-γ to modulate its traditional downstream target genes. The final result is decreased expression of genes involved in FA uptake and metabolism such as perilipin, acyl-CoA binding protein (ACBP), aP2, GPDH, and lipoprotein lipase (LPL) and genes involved in glucose uptake and metabolism such as GLUT4, CAP, and adiponectin. In addition, the ability of ligand-bound PPAR-γ to repress leptin expression is alleviated by CLA, thereby augmenting leptin, a critical regulator of lipid metabolism.
In what has become an exciting new area of adipocyte biology, several groups have demonstrated that cytokines and chemokines are either expressed at the mRNA level or secreted from adipose tissue. The ever-growing list (e.g. TNF-α, IL-6, IL-8, MCP-1, MIP-1α, adiponectin, plasminogen activator inhibitor-1, resistin, leptin) of secreted proteins that arise from adipose tissue have been collectively coined adipocytokines, yet this name may be misleading in light of several recent reports. Recent reports from Xu et al. (57) and Weisberg et al. (58) suggest that the actual amount of cytokines and chemokines secreted by adipocytes is minimal compared with that of neighboring reticuloendothelial cells, adipocyte precursors, or macrophages that all reside in adipose tissue. For example, expression analyses of macrophage and nonmacrophage cells from adipose tissue demonstrate that almost all of the TNF-α expression and significant amounts of IL-6 are derived from adipose tissue macrophages (58). Similarly, inflammatory- and macrophage-specific genes were up-regulated in white adipose tissue in a mouse model of obesity, and rosiglitazone reversed these changes in gene expression (57). Adipose tissue of obese mice were infiltrated with macrophages, but not neutrophils or lymphocytes, suggesting that macrophage-related inflammatory activities correlate with insulin resistance associated with obesity. Therefore, based on these studies and our data, we propose (Fig. 12) that CLA induces IL-6 and IL-8 synthesis and secretion primarily in the supporting SV cells, which through paracrine signaling, leads to decreased adipogenesis and insulin resistance in adipocytes. However, future studies are needed to test this hypothesis. To this end, we are currently examining the impact of CLA on cytokine production and gene expression in cultures of freshly isolated mature adipocytes and in undifferentiated cultures of SV cells isolated from human adipose tissue.
TNF-α, by far, has been the most comprehensively studied of all of the adipocytokines, yet the importance of adipocyte-derived IL-6 has come to light more recently. Unlike TNF-α, which is secreted in low abundance and is thought to act primarily through autocrine/paracrine actions locally in adipose tissue, IL-6 has been reported to be secreted abundantly from adipose tissue, contributing ~30% of total systemic IL-6 (59). Furthermore, adipose tissue-derived IL-6 is thought to act through autocrine, paracrine, and endocrine networks because its receptor system is present in many cells types including human adipocytes (41, 59). The IL-6 receptor system utilizes classical JAK/STAT signal transduction, but ERK has been shown to be a critical downstream intermediate of IL-6 signaling in multiple cell types, including adipocytes (60, Fig. 11A) Importantly, IL-6 treatment of murine and human adipocytes has pleotrophic effects on differentiation, metabolism, and gene expression similar to those seen with trans-10, cis-12 CLA treatment. In support of this concept, IL-6 treatment of murine and human adipocytes results in diminished TG content, insulin-stimulated glucose uptake, de novo lipogenesis, and increased lipolysis (41, 42, 59). Furthermore, IL-6 treatment down-regulates adipogenic markers FA synthase, GPDH, aP2, PPAR-γ, and C/EBP-α in murine adipocytes (42). In addition, IL-6 treatment of 3T3-L1 cells reduces the expression and secretion of adiponectin, an effect that was blocked by pharmacological inhibition of ERK (60). These data demonstrate that IL-6 reduces the TG content, insulin sensitivity, and adipocyte-specific gene expression in a manner strikingly similar to what we see after treatment of cultures of SV cells containing newly differentiated human adipocytes with trans-10, cis-12 CLA. In further support of this concept, dietary supplementation with trans-10, cis-12 CLA in humans results in increased circulating levels of C-reactive protein (55), an acute phase protein that is well known to be transcriptionally induced by IL-6 in the liver (61).
In contrast to IL-6, the role of IL-8 in adipocytes is less clear, and only recently has IL-8 been implicated as a true adipose tissue-derived cytokine (43, 62). Intriguingly, elevated IL-8 mRNA expression in subcutaneous adipose tissue has been correlated positively with insulin resistance (41) and lipodystrophy (63) in humans, two metabolic phenomena also seen with in vivo administration of trans-10, cis-12 CLA (13, 54 –56). Gerhardt et al. (43) was the first to demonstrate that primary cultures of SV cells containing newly differentiated human adipocytes produce significant amounts of IL-8. In addition, they demonstrated that mature human adipocytes, but not preadipocytes, express the receptor systems for IL-8 (i.e. CXCR1 and CXCR2), which are known to be classic PTX-sensitive heptahelical GPCRs (46). Importantly, using immunolocalization techniques Gerhardt et al. (43) also found that CXCR1 and CXCR2 receptors were only present on the surface of adipocytes in culture and not present in the supporting SV cells (43). Collectively, the selective expression of CXCR1 and CXCR2 in adipocytes and the fact that they are induced with differentiation point toward a functional role for IL-8 in mature human adipocytes and not in the supporting stroma. Furthermore, CXCR1 and CXCR2 can functionally couple, through PTX-sensitive G proteins, to ERK activation (46, 47, Fig. 11A). This could potentially explain the PTX-sensitive portion of CLA-induced ERK activation (Fig. 6, A and B) because IL-8 is hypersecreted in response to trans-10, cis-12 CLA (Fig. 9A).
The fact that adipocytokines (e.g. TNF-α, IL-6, IL-8, MCP-1, MIP-1α) that oppose adipocyte differentiation all activate ERK downstream of their respective receptors (45–50) indicates that ERK activation may be a critical TG-lowering signal in adipocytes. Although the role of MEK/ERK signaling in adipocytes has been studied extensively, conclusions from these studies are conflicting. In support of this concept, although MEK/ERK activation during the early stages of adipocyte differentiation promotes adipogenesis (34), MEK/ERK activation in mature adipocytes promotes delipidation and insulin resistance (24, 26, 38, 53, 64, 65). Importantly, trans-10, cis-12 CLA-induced MEK/ERK activation is sustained for several days (Fig. 5B) and has even been detected after weeks of treatment (data not shown). To our knowledge, this is the longest activation of ERK ever documented in cultures of adipocytes (e.g. cell lines and primary cultures) by any known effector.
In summary, our in vitro data identify molecular mechanisms that may explain the observations from several in vivo studies that trans-10, cis-12 CLA causes insulin resistance and lipodystrophy. We propose that primarily IL-6, and potentially IL-8, are autocrine and paracrine activators of MEK/ERK signaling, leading to impaired glucose and FA uptake and TG synthesis. Based on new emerging data on the source of antiadipogenic proinflammatory cytokines and chemokines (57, 58), we propose that CLA activates IL-6 and IL-8 gene expression and secretion, which is dependent on an autocrine activation of MEK/ERK signaling in nonadipocyte SV cells, which in turn, through paracrine actions impacts MEK/ERK signaling in newly differentiated adipocytes, leading to insulin resistance and delipidation. Studies are under way in our laboratory to determine how trans-10, cis-12 CLA increases IL-6 and IL-8 gene expression and secretion, the specific type of cells secreting these adipocytokines (i.e. adipocytes versus undifferentiated SV cells), and the direct versus indirect effects of these proinflammatory agents on MEK/ERK signaling.
Acknowledgments
We are very grateful to GlaxoSmithKline for supplying the Rosiglitazone. We also thank Dr. D. Bernlohr for a polyclonal rabbit anti-aP2 antibody and Dr. Robin Hopkins for excellent technical assistance.
Footnotes
This work was supported by NIDDK/Office of Dietary Supplements, National Institutes of Health, Grant R01DK-63070 and North Carolina Agriculture Research Service Grant 06520 (to M. K. M.) and by the Danish Dairy Research Foundation and the Innovation Act under the Danish Government (to S. M.).
The abbreviations used are: CLA, conjugated linoleic acid; aP2, adipocyte-specific fatty acid-binding protein; BSA, bovine serum albumin; CAP, cbl-associated protein; C/EBP-α, CAAT/enhancer-binding protein-α; DMEM, Dulbecco’s modified Eagle’s medium; ERK, extracellular signal-related kinase; FA, fatty acid; GLUT4, insulin-dependent glucose transporter 4; GPCR, G protein-coupled receptor; GPDH, glycerol-3-phosphate dehydrogenase; HBSS, Hanks’ balanced salt solution; IL, interleukin; JNK, c-Jun-NH2-terminal kinase; MAPK, mitogen-activated protein kinase; MEK, mitogen-activated protein kinase/extracellular signal-regulated kinase kinase; MCP-1, monocyte chemotactic protein-1; MIP-1α, macrophage inflammatory protein-1α; PBS, phosphate-buffered saline; PPAR-γ, peroxisome proliferator-activated receptor-γ; PTX, pertussis toxin; SV, stromal vascular; TBS, Tris-buffered saline; TG, triglyceride; TNF-α, tumor necrosis factor-α.
J. M. Brown, M. Sandberg Boysen, S. Chung, O. Fabiyi, R. F. Morrison, S. Mandrup, and M. K. McIntosh, unpublished observations.
References
- 1.Ha Y, Grimm N, Pariza M. Carcinogenesis. 1987;8:1881–1887. doi: 10.1093/carcin/8.12.1881. [DOI] [PubMed] [Google Scholar]
- 2.Belury M. J Nutr. 2002;132:2995–2998. doi: 10.1093/jn/131.10.2995. [DOI] [PubMed] [Google Scholar]
- 3.Evans M, Brown JM, McIntosh M. J Nutr Biochem. 2002;13:508–516. doi: 10.1016/s0955-2863(02)00211-5. [DOI] [PubMed] [Google Scholar]
- 4.Brown JM, McIntosh M. J Nutr. 2003;133:3041–3046. doi: 10.1093/jn/133.10.3041. [DOI] [PMC free article] [PubMed] [Google Scholar]
- 5.Park Y, Albright K, Liu W, Storkson J, Cook M, Pariza M. Lipids. 1997;32:853–858. doi: 10.1007/s11745-997-0109-x. [DOI] [PubMed] [Google Scholar]
- 6.Park Y, Storkson J, Albright K, Liu W, Cook M, Pariza M. Lipids. 1999;34:235–241. doi: 10.1007/s11745-999-0358-8. [DOI] [PubMed] [Google Scholar]
- 7.Park Y, Albright K, Storkson J, Liu W, Pariza M. Lipids. 1999;33:243–248. doi: 10.1007/s11745-999-0359-7. [DOI] [PubMed] [Google Scholar]
- 8.Delany J, Blohm F, Truett A, Scimeca J, West D. Am J Physiol. 1999;276:R1172–R1179. doi: 10.1152/ajpregu.1999.276.4.R1172. [DOI] [PubMed] [Google Scholar]
- 9.Cook, M., Jerome, D., Crenshaw, T., Buege, P., Pariza, M., Albright, K., Schmidt, S., Scimeca, J., Lotgren, P., and Hentges, E. (1999) Adipocyte Biology and Hormone Signaling Symposium, Madison, Wisconsin, June 7–9, 1999, Abstr. P26, University of Wisconsin-Madison Department of Biochemistry, Madison, WI
- 10.Ostrowska E, Muralitharian M, Cross R, Bauman D, Dunshea F. J Nutr. 1999;129:2037–2042. doi: 10.1093/jn/129.11.2037. [DOI] [PubMed] [Google Scholar]
- 11.Brown JM, Halvorsen YD, Lea-Currie R, Geigerman C, McIntosh M. J Nutr. 2001;131:2316–2321. doi: 10.1093/jn/131.9.2316. [DOI] [PubMed] [Google Scholar]
- 12.Brown JM, Boysen MS, Jensen SS, Morrison RF, Storkson J, Lea-Currie R, Pariza M, Mandrup S, McIntosh M. J Lipid Res. 2003;44:1287–1300. doi: 10.1194/jlr.M300001-JLR200. [DOI] [PMC free article] [PubMed] [Google Scholar]
- 13.Tsuboyama-Kasaoka N, Takahashi M, Tanemura K, Kim H, Tange T, Okuyama H, Kasai M, Ikemoto S, Ezaki O. Diabetes. 2000;49:1534–1542. doi: 10.2337/diabetes.49.9.1534. [DOI] [PubMed] [Google Scholar]
- 14.Torti FM, Torti SV, Larrick JW, Ringold GM. J Cell Biol. 1989;108:1105–1113. doi: 10.1083/jcb.108.3.1105. [DOI] [PMC free article] [PubMed] [Google Scholar]
- 15.Petruschke T, Hauner H. J Clin Endocrinol Metab. 1993;76:742–747. doi: 10.1210/jcem.76.3.8445033. [DOI] [PubMed] [Google Scholar]
- 16.Xing H, Northrop JP, Grove JR, Kilpatrick KE, Su JL, Ringold GM. Endocrinology. 1997;138:2776–2783. doi: 10.1210/endo.138.7.5242. [DOI] [PubMed] [Google Scholar]
- 17.Hotamisligil GS, Murray DL, Choy LN, Spiegelman BM. Proc Natl Acad Sci U S A. 1994;91:4854–4858. doi: 10.1073/pnas.91.11.4854. [DOI] [PMC free article] [PubMed] [Google Scholar]
- 18.Stephens JM, Lee J, Pilch PF. J Biol Chem. 1997;272:971–976. doi: 10.1074/jbc.272.2.971. [DOI] [PubMed] [Google Scholar]
- 19.Marshall MK, Doerrler W, Feingold KR, Grunfeld C. Endocrinology. 1994;135:141–147. doi: 10.1210/endo.135.1.8013346. [DOI] [PubMed] [Google Scholar]
- 20.Stahl A, Evans JG, Pattel S, Hirsch D, Lodish HF. Dev Cell. 2002;2:477–488. doi: 10.1016/s1534-5807(02)00143-0. [DOI] [PubMed] [Google Scholar]
- 21.Beutler B, Greenwald D, Hulmes JD, Change M, Pan YC, Mathison J, Uleyitch R, Cerami A. Nature. 1985;316:552–554. doi: 10.1038/316552a0. [DOI] [PubMed] [Google Scholar]
- 22.Feingold KR, Doerrler W, Dinarello CA, Fiers W, Grunfeld C. Endocrinology. 1992;130:10–16. doi: 10.1210/endo.130.1.1370149. [DOI] [PubMed] [Google Scholar]
- 23.Hauner H, Petruschke T, Russ M, Rohrig K, Eckel J. Diabetologia. 1995;38:764–771. doi: 10.1007/s001250050350. [DOI] [PubMed] [Google Scholar]
- 24.Ryden M, Dicker A, van Harmelen V, Hauner H, Brunnberg M, Perbeck L, Lonnqvist F, Arner P. J Biol Chem. 2002;277:1085–1091. doi: 10.1074/jbc.M109498200. [DOI] [PubMed] [Google Scholar]
- 25.Souza S, Palmer H, Kang Y, Yamamoto M, Muliro K, Paulson K, Greenberg A. J Cell Biochem. 2003;89:1077–1086. doi: 10.1002/jcb.10565. [DOI] [PubMed] [Google Scholar]
- 26.Zhang H, Halbeib M, Ahmad F, Manganiello V, Greenberg A. Diabetes. 2002;51:2929–2935. doi: 10.2337/diabetes.51.10.2929. [DOI] [PubMed] [Google Scholar]
- 27.Weiner FR, Smith P, Wertheimer S, Rubin CS. J Biol Chem. 1991;266:23525–23528. [PubMed] [Google Scholar]
- 28.Grunfeld C, Zhao C, Fuller J, Pollack A, Moser A, Freidman J, Feingold KR. J Clin Invest. 1996;97:2152–2157. doi: 10.1172/JCI118653. [DOI] [PMC free article] [PubMed] [Google Scholar]
- 29.Williams PM, Chang DJ, Danesh U, Ringold GM, Heller RA. Mol Endocrinol. 1992;6:1135–1141. doi: 10.1210/mend.6.7.1508226. [DOI] [PubMed] [Google Scholar]
- 30.Stephens JM, Pekala PH. J Biol Chem. 1991;266:21839–21845. [PubMed] [Google Scholar]
- 31.Pape ME, Kim KH. Mol Endocrinol. 1988;2:395–403. doi: 10.1210/mend-2-5-395. [DOI] [PubMed] [Google Scholar]
- 32.Yang SH, Sharrocks AD, Whitmarsh AJ. Gene (Amst) 2003;320:3–21. doi: 10.1016/s0378-1119(03)00816-3. [DOI] [PubMed] [Google Scholar]
- 33.Hu E, Kim JB, Sarraf P, Spiegelman B. Science. 1996;274:2100–2103. doi: 10.1126/science.274.5295.2100. [DOI] [PubMed] [Google Scholar]
- 34.Zhang B, Berger J, Zhou G, Elbrecht A, Biswas S, White-Carrington S, Szalkowski D, Moller D. J Biol Chem. 1996;271:31771–31774. doi: 10.1074/jbc.271.50.31771. [DOI] [PubMed] [Google Scholar]
- 35.Adams M, Reginato M, Shao D, Lazar M, Chatterjee V. J Biol Chem. 1997;272:5128–5132. doi: 10.1074/jbc.272.8.5128. [DOI] [PubMed] [Google Scholar]
- 36.Camp H, Tafuri S. J Biol Chem. 1997;272:10811–10816. doi: 10.1074/jbc.272.16.10811. [DOI] [PubMed] [Google Scholar]
- 37.Fujishiro M, Gotoh Y, Katagiri H, Sakoda H, Ogihara T, Anai M, Onishi Y, Ono H, Abe M, Shojima N, Fukushima Y, Kikuchi M, Oka Y, Asano T. Mol Endocrinol. 2003;17:487–497. doi: 10.1210/me.2002-0131. [DOI] [PubMed] [Google Scholar]
- 38.Greenberg A, Shen W, Muliro K, Patel S, Souza S, Roth R, Kraemer F. J Biol Chem. 2001;276:45456–45461. doi: 10.1074/jbc.M104436200. [DOI] [PubMed] [Google Scholar]
- 39.Suzawa M, Takada I, Yanagisawa J, Ohtake F, Ogawa S, Yamauchi T, Kadowaki T, Takeuchi Y, Shibuya H, Gotoh Y, Matsumoto K, Kato S. Nat Cell Biol. 2003;5:224–230. doi: 10.1038/ncb942. [DOI] [PubMed] [Google Scholar]
- 40.Sartipy P, Loskutoff DJ. Proc Natl Acad Sci U S A. 2003;100:7265–7270. doi: 10.1073/pnas.1133870100. [DOI] [PMC free article] [PubMed] [Google Scholar]
- 41.Rotter V, Nagaev I, Smith U. J Biol Chem. 2003;278:45777–45784. doi: 10.1074/jbc.M301977200. [DOI] [PubMed] [Google Scholar]
- 42.Lagathu C, Bastard JP, Auclair M, Maachi M, Capeau J, Caron M. Biochem Biophys Res Commun. 2003;311:372–379. doi: 10.1016/j.bbrc.2003.10.013. [DOI] [PubMed] [Google Scholar]
- 43.Gerhardt C, Romero, Cancello L, Camoin R, Camoin L, Strosberg A. Mol Cell Endocrinol. 2001;175:81–92. doi: 10.1016/s0303-7207(01)00394-x. [DOI] [PubMed] [Google Scholar]
- 44.Mohamed-Ali V, Goodrick S, Rawesh A, Katz D, Miles J, Yudkin J, Klein S, Coppack S. J Clin Endocrinol Metab. 1997;82:4196–4200. doi: 10.1210/jcem.82.12.4450. [DOI] [PubMed] [Google Scholar]
- 45.Chang F, Steelman LS, Lee J, Shelton J, Navolanic P, Blalock W, Franklin R, McCubrey J. Leukemia. 2003;17:1263–1293. doi: 10.1038/sj.leu.2402945. [DOI] [PubMed] [Google Scholar]
- 46.Atta-ur-Rahman, Harvey K, Siddiqui R. Curr Pharm Des. 1999;5:241–253. [PubMed] [Google Scholar]
- 47.Browning D, Diehl W, Hsu M, Schraufstatter I, Ye R. Am J Physiol. 2000;279:L1129–L1136. doi: 10.1152/ajplung.2000.279.6.L1129. [DOI] [PubMed] [Google Scholar]
- 48.Werle M, Schmal U, Hanna K, Kreuzer J. Cardiovasc Res. 2002;56:284–292. doi: 10.1016/s0008-6363(02)00600-4. [DOI] [PubMed] [Google Scholar]
- 49.Lentzsch S, Gries M, Janz M, Bargou R, Dorken B, Mapara MY. Blood. 2003;101:3568–3573. doi: 10.1182/blood-2002-08-2383. [DOI] [PubMed] [Google Scholar]
- 50.Saklatvala J, Davis W, Guesdon F. Philos Trans R Soc Lond B Biol Sci. 1996;351:151–157. doi: 10.1098/rstb.1996.0011. [DOI] [PubMed] [Google Scholar]
- 51.Luttrell LM, Della Rocca GJ, Van Biesen T, Luttrell DK, Lefkowitz RJ. J Biol Chem. 1997;272:4637–4644. doi: 10.1074/jbc.272.7.4637. [DOI] [PubMed] [Google Scholar]
- 52.Kallen CB, Lazar MA. Proc Natl Acad Sci U S A. 1996;93:5793–5796. doi: 10.1073/pnas.93.12.5793. [DOI] [PMC free article] [PubMed] [Google Scholar]
- 53.Kim S, Muise A, Lyons P, Ro H. J Biol Chem. 2001;276:10199–10206. doi: 10.1074/jbc.M010640200. [DOI] [PubMed] [Google Scholar]
- 54.Riserus U, Arner P, Brismar K, Vessby B. Diabetes Care. 2002;25:1516–1521. doi: 10.2337/diacare.25.9.1516. [DOI] [PubMed] [Google Scholar]
- 55.Riserus U, Basu S, Jovinge S, Fredrickson G, Arnlov J, Vessby B. Circulation. 2002;106:1925–1929. doi: 10.1161/01.cir.0000033589.15413.48. [DOI] [PubMed] [Google Scholar]
- 56.Clement L, Poirier H, Niot I, Bocher V, Guerre-Millo M, Krief S, Staels B, Besnard P. J Lipid Res. 2002;43:1400–1409. doi: 10.1194/jlr.m20008-jlr200. [DOI] [PubMed] [Google Scholar]
- 57.Xu H, Barnes G, Yang Q, Tan G, Yang D, Chou C, Sole J, Nichols A, Ros J, Tartaglia L, Chen H. J Clin Invest. 2003;112:1821–1830. doi: 10.1172/JCI19451. [DOI] [PMC free article] [PubMed] [Google Scholar]
- 58.Weisberg S, McCann D, Desai M, Rosenbaum M, Leibel R, Ferrante W. J Clin Invest. 2003;112:1796–1808. doi: 10.1172/JCI19246. [DOI] [PMC free article] [PubMed] [Google Scholar]
- 59.Path G, Bornstein S, Gurniak M, Chousos G, Scherbaum W, Hauner H. J Clin Endocrinol Metab. 2001;86:2281–2288. doi: 10.1210/jcem.86.5.7494. [DOI] [PubMed] [Google Scholar]
- 60.Fasshauer M, Kralisch S, Klier M, Lossner U, Bluher M, Klein J, Paschke R. Biochem Biophys Res Commun. 2003;301:1045–1050. doi: 10.1016/s0006-291x(03)00090-1. [DOI] [PubMed] [Google Scholar]
- 61.Mortensen RF. Immunol Res. 2001;24:163–176. doi: 10.1385/IR:24:2:163. [DOI] [PubMed] [Google Scholar]
- 62.Bruun J, Pedersen S, Richelsen B. J Clin Endocrinol Metab. 2001;86:1267–1273. doi: 10.1210/jcem.86.3.7264. [DOI] [PubMed] [Google Scholar]
- 63.Lihn A, Richelsen B, Pedersen S, Haugard S, Rathje G, Madsbad S, Anderson O. Am J Physiol. 2003;285:E1072–E1080. doi: 10.1152/ajpendo.00206.2003. [DOI] [PubMed] [Google Scholar]
- 64.Font de Mora J, Porras A, Ahn N, Santos E. Mol Cell Biol. 1997;17:6068 –6075. doi: 10.1128/mcb.17.10.6068. [DOI] [PMC free article] [PubMed] [Google Scholar]
- 65.Shimba S, Wada T, Tezuka M. J Cell Sci. 2001;114:2809–2817. doi: 10.1242/jcs.114.15.2809. [DOI] [PubMed] [Google Scholar]