

Abstract
Rhodopsin (Rho) resides within internal membrane structures called disc membranes that are found in the rod outer segments (ROS) of photoreceptors in the retina. Rho expression is essential for formation of ROS, which are absent in knockout Rho−/ − mice. ROS of mice heterozygous for the Rho gene deletion (Rho+/−) may have a lower Rho density than wild type (WT) membranes, or the ROS structure may be reduced in size due to lower Rho expression. Here, we present evidence that the smaller volume of ROS from heterozygous mice is most likely responsible for observed electrophysiological response differences. In Rho+/− mice as compared with age-matched WT mice, the length of ROS was shorter by 30–40%, and the average diameter of ROS was reduced by ~20%, as demonstrated by transmission and scanning electron microscopy. Together, the reduction of the volume of ROS was ~60% in Rho+/− mice. Rho content in the eyes was reduced by ~43% and 11-cis-retinal content in the eye was reduced by ~38%, as determined by UV-visible spectroscopy and retinoid analysis, respectively. Transmission electron microscopy of negatively stained disc membranes from Rho+/− mice indicated a typical morphology apart from the reduced size of disc diameter. Power spectra calculated from disc membrane regions on such electron micrographs displayed a diffuse ring at ~4.5 nm−1, indicating paracrystallinity of Rho. Atomic force microscopy of WT and Rho+/− disc membranes revealed, in both cases, Rho organized in paracrystalline and raftlike structures. From these data, we conclude that the differences in physiological responses measured in WT and Rho+/− mice are due to structural changes of the whole ROS and not due to a lower density of Rho.
G protein-coupled receptors (GPCRs)1 constitute one of the most important families of signaling molecules in higher organisms (1, 2). The mechanistic view of how these receptors operate is complicated by the fact that only the crystal structure of inactive, dark-adapted Rho has been available in the last few years (3–10), whereas the functional complex between receptor and cognate G-protein has been trapped only biochemically (11), and their micromolecular assembly has been deduced from low resolution radiation inactivation experiments (12).
The classical hypothesis for GPCR operation proposes formation of a one-to-one complex between a GPCR and a G protein. Arguments for this model include activity of the receptor in a very dilute detergent-containing medium where a single receptor per micelle is assumed to be present per G protein. A multitude of biophysical measurements such as rotational and lateral mobility studies of Rho, electron paramagnetic resonance, and fluorescence measurements were explained in the light of a one-to-one complex (e.g. see Ref. 13). In addition, peptide competition experiments were interpreted in a framework of one-to-one complexes (reviewed in Ref. 14). An alternative hypothesis, now rapidly gaining acceptance, proposes that the dimers of GPCRs are the interacting units with a single trimeric G-protein. A set of biochemical and biophysical methods have addressed the question on the oligomeric state of GPCRs, and hetero- and homodimers of GPCRs were observed in a number of experiments (15–25).
The best studied system for GPCR signaling has been the visual system of rod photoreceptors, which are highly differentiated neurons. Rho, the light receptor molecule of rod photo-receptor cells, resides within internal membrane structures called disc membranes, which are located in the rod outer segment (ROS) and are enveloped by the plasma membrane (reviewed in Refs. 26 and 27). A single ROS consists of a large number of these discs, ranging from ~900 in mouse to ~2000 in frog photoreceptors. In addition to its signaling role, Rho is also a structural protein, because its presence at a very high concentration (~3 mm) is essential for the normal development of ROS and disc membranes. Direct AFM imaging of Rho in native membranes revealed that the protein is organized in large paracrystalline structures with a dimeric elementary unit (28–31). The size of the platform formed by the dimer provides the structural fit of the GPCR with a single G-protein or arrestin (32, 33). A molecular model of arrangement of rhodopsin in the membranes was proposed (29, 30, 33). This model is consistent with the biochemical results obtained on the organization of α1-adrenergic receptor (34). Recently, cross-linking studies confirmed that Rho forms dimers and/or higher order structures in native membranes (35).
In addition to early biophysical studies that suggested unobstructed diffusion of Rho in the native membranes (13), phototransduction events were investigated in heterozygote mice with the Rho gene deletion (36). Calvert et al. (36) speculated that a high packing density of Rho may impede phototransduction by restricting the lateral movement and decreasing the rate of encounters between Rho and its cognate G protein. The authors found that the heterozygous knockout of Rho in transgenic mice accelerated the rising phases and recoveries of flash responses by about 1.7-fold in vivo. From these findings, they suggested that the response onset and recovery are set by the diffusional encounter frequency between proteins on the disc membrane. Here, we employed a number of structural methods to investigate the differences between wild type (WT) and Rho+/− mice and to understand how lower expression of Rho impacts the structure and physiology of photoreceptor cells. We found that the reduction in the Rho expression level leads to morphological and structural changes of the ROS.
MATERIALS AND METHODS
Animals
All animal experiments employed procedures approved by the University of Washington Animal Care Committee. Rho+/− and WT C57BL/6 mice were obtained from Dr. J. Lem (Tufts University, Boston, MA) and the Jackson Laboratory, respectively. Rho6+/− mice were genotyped as described previously (37). All animals (12 weeks old) were maintained in complete darkness for >120 min before being sacrificed. The eyes were removed, and the retinas were isolated in complete darkness with the aid of night vision goggles (LAMBDA 9; ITT Industries).
Isolation of ROS and Disc Membranes
Twelve mouse retinas were placed in a tube with 120 μl of 8% OptiPrep (Nycomed, Oslo, Norway) in Ringer’s buffer (130 mm NaCl, 3.6 mm KCl, 2.4 mm MgCl2, 1.2 mM CaCl2, 10 mM Hepes (pH 7.4), and 0.02 mm EDTA) and vortexed for 1 min. The sample was centrifuged at 200 × g for 1 min, and the supernatant containing the ROS was gently removed. The pellet was dissolved in 120 μl of 8% OptiPrep, vortexed, and centrifuged again. The vortex and sedimentation sequence was repeated six times. The collected supernatants (~1.5 ml) containing ROS were combined, overlaid on a 10–30% continuous gradient of OptiPrep in Ringer’s buffer, and centrifuged for 50 min at 26,500 × g. ROS were harvested as a second band (about two-thirds of the way from the top), diluted three times with Ringer’s solution, and centrifuged for 3 min at 500 × g to remove the cell nuclei. The supernatant containing ROS was transferred to a new tube and centrifuged for 30 min at 26,500 × g. The pelleted material contained pure, osmotically intact ROS.
ROS were burst in 2 ml of 2 mm Tris-HCl (pH 7.4) at 0 °C or at room temperature for 15 h, and the discs were isolated employing a 15–40% continuous gradient of OptiPrep in Ringer’s buffer. The sample was centrifuged for 50 min at 26,500 × g and the discs were collected from a faint band located about two-thirds of the way from the top of the gradient. The harvested intact discs were diluted three times with Ringer’s solution and pelleted for 30 min at 26,500 × g. SDS-PAGE and immunoblotting were performed as described previously (38).
Light Microscopy and Transmission Electron Microscopy (TEM)
Mouse eyecups were primarily fixed by immersion in 2% glutaraldehyde, 2% paraformaldehyde, 0.1 m cacodylate sodium buffer (pH 7.3) for 24 h. The eyecups were then washed with 0.1 m cacodylate sodium buffer and secondarily fixed with 1% OsO4 in 0.1 M cacodylate sodium buffer.
ROS and discs were fixed in 2.5% glutaraldehyde, 1% OsO4, 0.1 M cacodylate buffer (pH 7.3) for 1 h, washed three times with 0.1 m cacodylate buffer, and collected by centrifugation at 16,000 × g for 3 min. ROS and disc pellets were suspended in molten 5% phosphate-buffered low temperature gelling agarose solution, collected by centrifugation at 16,000 × g for 3 min, and cooled. ROS and disc pellets were secondarily fixed with 1% OsO4 in 0.1 M phosphate buffer (pH 7.4).
The eyecups, ROS, and discs were dehydrated with ethanol and embedded in Eponate12 Resin (Ted Pella, CA). Thin sections (1.0 μm) were cut, stained with 10% Richardson’s blue solution, and subjected to light microscopy. Ultrathin sections (0.07 μm) were cut and stained with uranyl acetate and lead citrate solution. Samples were inspected, and electron micrographs were recorded with a Philips CM-10 TEM.
Scanning Electron Microscopy (SEM)
The retinas without the retinal pigment epithelium cells were fixed in 2.5% glutaraldehyde, 0.1 m cacodylate sodium buffer, 2% sucrose (pH 7.4) for 6 h. All samples were washed in 0.1 m cacodylate buffer, 2% sucrose, fixed with 1% OsO4 in washing buffer, dehydrated with ethanol, dried using a critical point drying method, sputter-coated with a 5–10-nm-thick gold layer, and analyzed employing a JSF-6300F or a XL SFEG scanning electron microscope (FEI Sirion; Philips).
Atomic Force Microscopy (AFM)
Disc membranes were adsorbed to mica in 2 mm Tris-HCl (pH 7.4) for 15–20 min at room temperature and washed with 20 mm Tris-HCl (pH 7.8), 150 mm KCl, 25 mm MgCl2. AFM experiments were performed in the dark with a Nanoscope Multimode AFM (Veeco/Digital Instruments, Santa Barbara, CA) equipped with a red laser head, fluid cell, and oxide-sharpened silicon nitride cantilevers (OMCL-TR400PSA; Olympus), calibrated as described previously (39). Topographs were acquired in contact mode at minimal loading forces (≤100 piconewtons). Trace and retrace signals were recorded simultaneously at line frequencies ranging between 4.1 and 5.1 Hz.
Retinoid Analyses and Rho Measurements
All procedures were performed under dim red light as described previously (40–42). Retinoids were separated by normal phase HPLC (Beckman; Ultrasphere-Si; 4.6 × 250 mm) with 10% ethyl acetate, 90% hexane at a flow rate of 1.4 ml/min using an HP1100 HPLC system with a diode array detector and HP Chemstation A.03.03 software. Typically, two mouse eyes were used per Rho measurement. Mouse eyes were enucleated and rinsed with distilled H2O. The lenses were removed, and the eyes were cut into 3–4 pieces and frozen immediately on a dry ice/EtOH bath. Rho was extracted with 0.9 ml of 20 mm BisTris propane (pH 7.5) containing 10 mm dodecyl-β-maltoside and 5 mm freshly neutralized NH2OH·HCl. The sample was homogenized with a Dounce tissue homogenizer and shaken for 5 min at room temperature (Eppendorf mixer 5432). The sample was then centrifuged at 14,000 rpm for 5 min at room temperature (Eppendorf Centrifuge 5415C). The supernatant was collected, and the pellet was extracted one more time. The combined supernatants were centrifuged at 50,000 rpm for 10 min (Beckman Optima TLX centrifuge/TLA100.3 fixed angle rotor), and absorption spectra were recorded before and after a 12-min bleach (60-watt incandescent bulb). The concentration of Rho was determined by the decrease in absorption at 500 nm using the molar extinction coefficient ε = 42,000 m−1 cm−1.
Electroretinograms (ERGs)
Prior to recording, mice were dark-adapted overnight. Under a safety light, mice were anesthetized by intraperitoneal injection using 20 μl/g body weight of 6 mg/ml ketamine and 0.44 mg/ml xylazine diluted with 10 mm sodium phosphate (pH 7.2) containing 100 mm NaCl. The pupils were dilated with 1% tropicamide. A contact lens electrode was placed on the eye, and a reference electrode and ground electrode were placed in the ear and on the tail. ERGs were recorded with the universal testing and electrophysiologic system UTAS E-3000 (LKC Technologies, Inc.). The light intensity was calibrated by the manufacturer and computer-controlled. The mice were placed in a Ganzfeld chamber, and scotopic and photopic responses to flash stimuli were each obtained from both eyes simultaneously.
Single-flash Recording
Flash stimuli had a range of intensities (−3.7–2.8 log cd s m−2), and white light flash duration was adjusted according to intensity (from 20 μs to 1 ms). Three to five recordings were made with >10-s intervals, and for higher intensity intervals, intervals were 10 min or as indicated. There were no significant differences between the first and the fifth flash. Light-adapted responses were examined after bleaching at 1.4 log cd m−2 for 15 min. Typically, 4–8 animals were used for the recording of each point in all conditions.
Double-flash Recording
The double-flash recording was used to study the recovery of photoreceptors. The protocol was followed as previously published with some modifications (43). A test flash was delivered to suppress the circulating current of the rod photoreceptors. The recovery of this current was monitored by delivering a second flash, termed the probe flash. The interval time between two flashes was varied from 100 to 2000 ms. The intensity of the test flash and probe flash was 0.4 and 1.6 log cd s m−2, respectively. Each trial was performed separately with a 120-s interval time for dark adaptation. The amplitude of the probe flash alone was confirmed throughout the experiment to ensure that this time was sufficient. These probe flashes were also used to normalize the response of probe flashes following a test flash. The normalized amplitude of the probe flash a-wave versus the time between two flashes was plotted and fitted by the linear regression algorithm in the SigmaPlot 2002 version 8.02 program.
Leading edges of the ERG responses were fitted with a model of rod phototransduction activation as described previously (40). The results were examined using the one-way analysis of variance test.
RESULTS
Visual Responses in Rho+/− Mice
The mice used in our experiments were originally generated by Lem et al. (37). Electrophysiological single cell recordings from rod photoreceptors of Rho+/− mice were consistent with the earlier finding by Calvert et al. (36) that the transgenic mice displayed accelerated kinetics of rod responses and higher sensitivity.2 To further characterize photoreceptor activities, dark- and light-adapted Rho+/− mice were tested using an ERG. Fig. 1A illustrates subsets of a typical family of ERG responses to Ganzfeld stimuli at a wide range of intensities for dark-adapted WT and Rho+/− mice. The initial corneal-negative a-wave reflecting photoreceptor activities plotted for the entire range of the test light showed slightly lower amplitude for Rho+/− mice, particularly at higher light intensities (Fig. 1B). Lower a-wave amplitudes also evoked a smaller amplitude of the b-wave (Fig. 1B), representing responses of the secondary retinal neurons. The leading edges of the a-wave of the ERG responses in dark-adapted conditions were fitted with a model of rod phototransduction activation as described previously (40), and two parameters, maximum a-wave amplitude and sensitivity, were calculated. Rho+/− mice showed significantly higher sensitivity (p < 0. 01), whereas maximum a-wave amplitude revealed no significant difference (p > 0.1) compared with WT mice (Table I). Cone responses, as measured in light-adapted conditions when rods were desensitized by the background light, revealed an unchanged a-wave; however, noticeable differences were observed for the b-wave (Supplemental Fig. 1, A and B). The difference in the b-wave could result from the differences initiated by abnormal rod function (e.g. a lower density of rods), but the connection remains unclear.
Fig. 1. Single-flash ERG responses of increasing intensity for WT and Rho+/− mice.
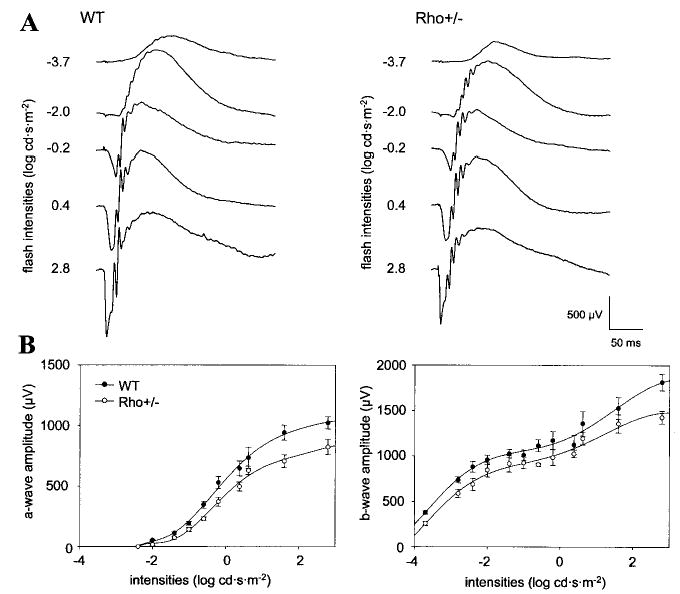
Serial responses to increasing flash stimuli were obtained for WT and Rho+/− mice under dark-adapted conditions (A) for selected intensities and plotted as a function a-wave and b-wave versus light intensities (B).
Table I. Quantitative parameters of ERG a-wave.
ERG were recorded as described under “Materials and Methods.” Leading edges (initial 5–20 ms depending on response) of dark-adapted ERG photoresponses evoked by 2.8 log cd s m−2 flashes are fitted with a model of phototransduction. The amplitude and sensitivity of the Rho+/− mouse photoresponses are reduced from maximal responses. The time for 50% recovery of a-wave Rho+/− mice was estimated from normalized a-wave recovery. Rho+/− show significantly higher sensitivity and faster recovery. Maximum a-wave amplitude, sensitivity parameters, and time for 50% recovery of a-wave in Rho+/− mice compared with WT mice are shown.
| WT | Rho+/− | |
|---|---|---|
| Maximum a-wave amplitude (μV) | 964.6 ± 48.4 | 818.4 ± 67.3 |
| Sensitivity (log cd−1 m2 s−3) | 4.8 ± 0.5 | 6.1 ± 0.17a |
| Time between flashes for 50% a- wave amplitude recovery (ms) | 893.3 ± 47.8 | 469.7 ± 14.2b |
p < 0.01, one-way analysis of variance, when compared with WT mice.
p < 0.0001, one-way analysis of variance, when compared with WT mice.
The rod function was further examined using paired flash responses. Whereas the test flash desensitized rod photoreceptors, the probe light measured the sensitivity of rods during the course of Rho* inactivation and recovery of prebleach conditions (Fig. 2A). The time for 50% recovery of the a-wave was estimated using normalized a-wave amplitude recovery time. Photoreceptors in Rho+/− mice recovered significantly faster compared with WT (p < 0. 0001; Rho+/−, 469.7 ± 14.2 ms; WT, 893.3 ± 47.8 ms) after the test flash (Fig. 2B). These results suggest that the recovery of sensitivity was significantly faster for Rho+/− mice.
Fig. 2. Measurements of a-wave recovery with double-flash ERG.

A, ERG trace from WT mouse demonstrating the double-flash technique (top). Bottom, recovery of a-wave after a test flash. The dark-adapted mice were conditioned first with the test flash (0.4 log cd s m−2) followed by a probe flash (1.6 log cd s m−2) with the delay time varied from 100 to 2000 ms. Each trace represents the average of recordings from n = 8 eyes. B, normalized a-wave recovery of the probe flash at different times after the test flash. The responses recovered more quickly in Rho+/− mice.
Morphological Differences
To understand the underlying reasons for the measured physiological differences in rods from WT and Rho+/− mice, a full morphological characterization of the retina, including Rho content and retinoid levels, was carried out. Light microscopy of the retina from WT and Rho+/− mice revealed the most profound changes in the outer segments (Fig. 3A). For example, the thickness of OS was plotted as a distance from the optic nerve head in the superior and inferior direction (see Fig. 3B). In mice, this layer is constituted mostly of rod cells, since the cone component is only ~3% (44, 45). The ratio of OS layer lengths in the retina of WT and Rho+/− mice was 1.72 ± 0.37 across the retina. Similar results were obtained when nasal and temporal sections were analyzed (data not shown). This morphological observation suggests a reduction of the length of ROS by ~40% in Rho+/− mice compared with those of WT mice. There was a slight change in the thickness of the outer plexiform layer and the number of photoreceptor nuclei, from ~11–12 per row in WT (n = 12) to 9–10 per row in Rho+/− (n = 12 eyes). The change in the thickness of OS should result in a decreased number of rods and thus decrease in Rho content in the retina. If the density of Rho was unchanged, a shortening of the ROS would result in a proportional decrease in the Rho content.
Fig. 3. Retina histology of WT and Rho+/− mice.
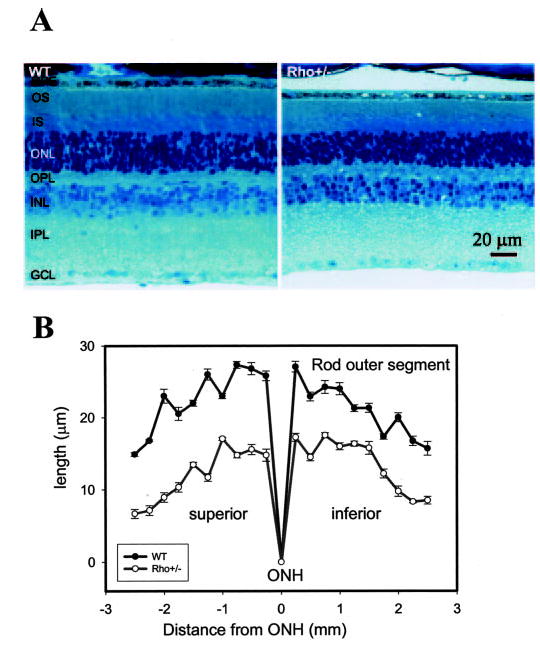
A, light micrograph of the retina from WT and Rho+/− mice. B, thickness of ROS (in μm) plotted as a function of location in the retina from the optic nerve head (ONH; in mm). The age of the mice was 12 weeks, and the average from 12 eyes was used in this experiment. Note that the photoreceptor layer across the retina of Rho+/− mice is 30–40% shorter than those of WT mice. Closed circles, WT mice; open circles, Rho+/− mice. IS, inner segments; ONL, outer nuclear layer; OPL, outer plexiform layer; INL, inner plexiform layer; GCL, ganglion cell layer.
Rho in mice can be measured very precisely by retinoid analysis, since the majority of the 11-cis-retinal pool is bound to opsin in the eye (46). The retinoid analysis revealed that the eye extract from Rho+/− mice had 325 ± 28 pmol/eye or ~38% reduction of 11-cis-retinal compared with 527 ± 21 pmol/eye for the age-matched eye extract from WT mice (n = 6). A typical chromatogram is shown in Fig. 4. Rho amounts were also measured employing difference spectra calculated from spectra measured before and after bleaching. The homogenate from the retina of Rho+/− had 320 ± 35 pmol/eye of Rho, a ~43% decrease in comparison with the 560 ± 33 pmol/eye from the age-matched retinal extract from WT mice (n = 8). Representative difference spectra are shown in the inset of Fig. 4. SDS-polyacrylamide gel electrophoresis and Coomassie Blue staining of isolated ROS from Rho+/− and WT mice did not indicate major differences in their protein profile, with the exception of lower Rho content for the former (not shown).
Fig. 4. Retinoid analysis in Rho+/− mice.
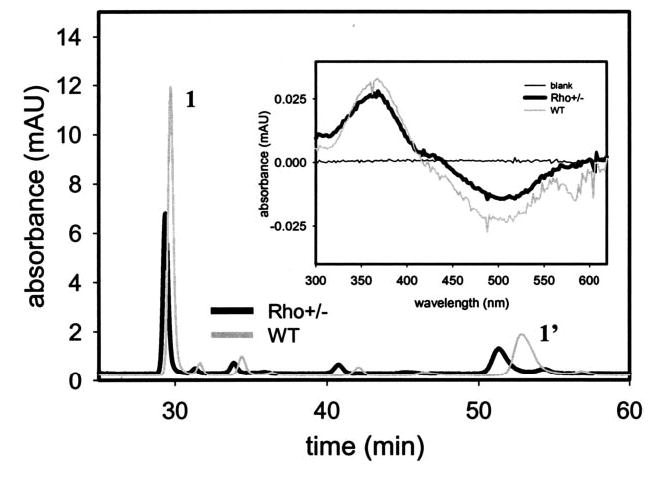
Chromatographic separation of nonpolar retinoids from WT and Rho+/− mouse eyes. Retinoids were extracted from the eye and separated on normal-phase HPLC as described under “Materials and Methods.” Inset, difference spectra calculated from spectra measured before and after bleaching of Rho in the eye extract from WT and Rho+/− mice. The homogenate from the retina of Rho+/− has ~60–70% of 11-cis-retinal or Rho compared with the age-matched retinal extract from WT mice. 1 and 1′ represent syn- and anti-11-cis-retinal oximes.
Differences in the Structure of ROS in Rho+/− and WT Mice by TEM and SEM
Similar to light microscopy, TEM revealed differences between ROS from WT and Rho+/− mice. As evident from transmission electron micrographs, ROS in the retina of Rho+/− mice were shortened by ~32% as compared with ROS from WT mice (Fig. 5A). The average number of discs was 34 per 1 μm for ROS from the retina of both WT and Rho+/− mice. In WT mice, the average ROS length was 23.8 ± 1.0 μm, containing 810 ± 33 discs (n = 10), whereas in Rho+/− mice the average length was 16.1 ± 1.2 μm, containing 549 ± 41 discs (n = 10). Thus, the reduction in length was ~32% for Rho+/− ROS as measured by this method. The average diameter of ROS in retinal sections of WT and Rho+/− mice was 1.32 ± 0.12 μm and 1.05 ± 0.08 μm (n = 50), respectively (see Fig. 5B). This would further reduce the Rho content in Rho+/− by ~20%.
Fig. 5. TEM and SEM micrographs of retina and ROS from WT and Rho+/− mice.
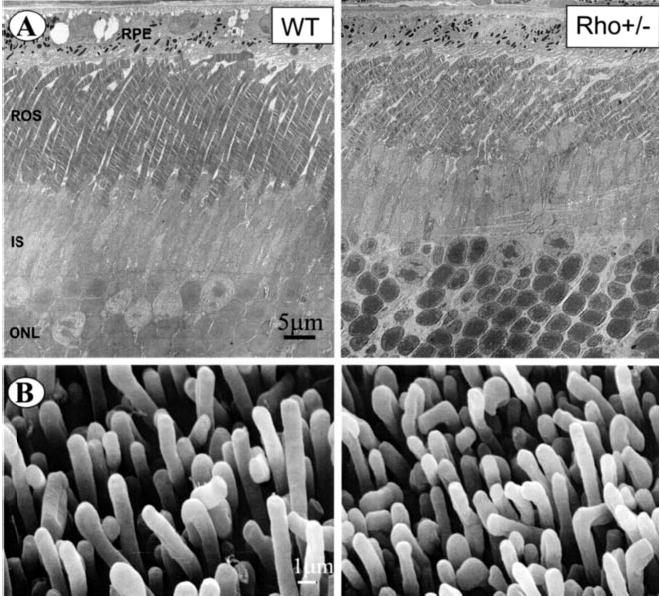
A, transmission electron micrographs of retina sections around the photoreceptor layer from WT and Rho+/− mice. Diameter of ROS from WT and Rho+/− mice was 1.32 ± 0.12 and 1.05 ± 0.08 μm (n = 50), respectively. B, SEM of mouse ROS attached to the retina from WT and Rho+/− mice. The average diameter of ROS from WT and Rho+/− was 1.22 ± 0.12 and 1.02 ± 0.07 μm, respectively.
Micrographs from SEM of WT and Rho+/− mouse ROS attached to the retina revealed well developed and densely packed ROS (Fig. 5B); however, the average diameter of ROS from WT and Rho+/− was 1.22 ± 0.12 and 1.02 ± 0.07 μm, respectively. TEM of isolated ROS displayed well formed structures, but the average diameter of the isolated ROS from Rho+/− mice also appeared smaller compared with WT (Fig. 6). Thus, results obtained from two different methods (SEM and TEM) were comparable, despite the different sample preparation methods applied.
Fig. 6. TEM of isolated sectioned ROS.

A, isolated ROS from WT and Rho+/− mice. B, electron micrographs recorded at higher magnification of isolated ROS from WT and Rho+/− mice.
TEM and AFM of Disc Membranes from Rho Heterozygous Mice
Disc membranes from Rho+/− knockout mice isolated at room temperature were adsorbed on carbon-coated TEM grids, negatively stained, and inspected by TEM. The morphology of an intact disc revealed no significant differences between discs isolated from Rho+/− (Supplemental Fig. 2) and Rho+/+ (30).
Native Rho+/− disc membranes isolated at room temperature were adsorbed on mica and imaged by AFM in buffer solution. Fig. 7, A and B, displays the height and deflection images of an intact disc. Two different surface types are evident: mica (1) and the cytoplasmic side of the disc membrane (2). Intact discs had a circular shape and a thickness between 13 and 18 nm, and were corrugated. The measured thickness was in agreement with the height expected for two stacked biological membranes. Open, flattened discs adsorbed on mica were also found (Fig. 7, C and D). Four different surface types were discerned: mica (1), the Rho surface (types 2* and 2′), and lipid (type 3). Similar to images from AFM of WT disc membranes from mice (30, 31, 33), the images revealed Rho organized in paracrystals (2*) and raftlike structures (2′). Height measurements yielded a height of 7.98 ± 0.26 nm (n = 70) for the paracrystals and rafts and 3.69 ± 0.15 nm (n = 30) for the lipids. These thicknesses indicate that the observed disc membranes in Fig. 7, C and D, were single-layered, opened by the osmotic treatment (see “Materials and Methods”) or upon adsorption on mica. The area marked by the white, broken box in Fig. 7C is displayed at higher magnification in Fig. 7D. In this deflection image, lattice lines arising from the Rho paracrystal are clearly visible (see also inset in Fig. 7D).
Fig. 7. AFM of native discs and disc membranes isolated from Rho+/− mice.
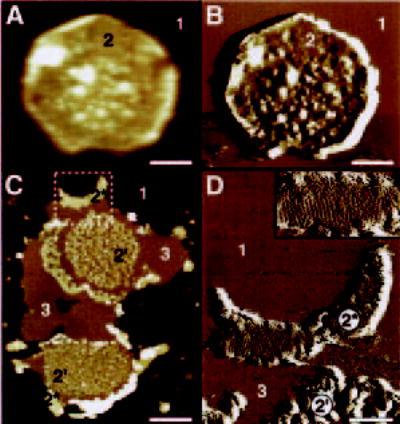
Height (A) and deflection (B) images of an intact disc (double-layered membrane). Two different surface types are discerned: mica (1) and the cytoplasmic surface of the disc (2). C, height image of open, flattened single-layered discs. Three additional surface types are visible: small raftlike structures (2′), larger paracrystalline Rho domains (2*), and lipid (3). The area marked by the broken white box is displayed in D as a deflection image at higher magnification; lattice lines from the Rho paracrystal (2*) are visible. Inset in D, magnification of the paracrystalline area (2*). Discs and disc membranes were adsorbed on mica and imaged in buffer solution at room temperature. Scale bars, 200 nm (A and B), 500 nm (C), and 150 nm (D). Frame size of the inset in D is 267 × 143 nm. Vertical brightness ranges are 30 nm (A), 0.6 nm (B), 18 nm (C), and 0.4 nm (D).
DISCUSSION
Reduced Rho expression in Rho+/− mice leads to lower sensitivity, acceleration in the rising phases, and faster recoveries after the flash in visual response tests. Two models may account for these differences. First, the structure of photoreceptors and ratios of proteins involved from Rho+/− may be compromised; second, the lower density of Rho may increase the mobility of Rho and speed up physiological responses. This study focuses on the impact of the reduced expression of Rho on physiological responses and provides evidence that the changes in those responses are due to structural changes in ROS rather than to a reduced Rho density in disc membranes.
Rho+/− Mice and Morphological Characterization
Disruption of the Rho gene in mice was carried out by two laboratories. First, Humphries et al. (47) generated Rho+/− mice by introducing a neo cassette within exon 2 of the Rho gene. These mice developed normally, and Rho+/− had a thinner outer nuclear layer and shorter ROS than seen in WT mice. ROS were somewhat disorganized in young Rho+/− mice. At 10 weeks, scotopic threshold responses were comparable for both WT and Rho+/− (47). Rho+/− mice did not elaborate ROS, losing their photoreceptors over 3 months. These mice did not have a rod ERG response (47). Lem et al. (37) described the second line of mice with a disrupted Rho gene. A targeting construct led to the deletion of 15 bp upstream of the translation start site and the first 111 codons of the rod opsin gene. At 15 days, ROS length was about half that of WT, but as the Rho−/− mice matured, their OS extended to approximately normal lengths. Retinas from mice with a single copy of the opsin gene developed normally, and in mice ranging in age from 23 days to 24 weeks, rods elaborated OS of normal size but with half the normal complement of Rho. Using microspectrophotometry, Lem et al. (37) found a lower density of Rho in the ROS of these mice; however, they found that the outer segment diameters in WT and Rho+/− mice were equal to 1.4 ± 0.2 μm for both, and concluded that the concentration of ROS was lower by half in Rho+/−. In addition, Rho+/− in older animals exhibited a very slow retinal degeneration; by 90 days of age, one or two rows of photoreceptor nuclei had been lost, and there was a slight reduction in outer segment lengths of the remaining rods. This result is in contrast with our measurements, which clearly show differences in the size of ROS by several methods, consistent with the work of Humphries et al. (47).
Using different imaging techniques, we found that Rho+/− mice have ROS that are shorter by ~30–40% and smaller in diameter by ~20% than ROS from WT mice. This means that the surface area of a single disc is smaller by ~30–40%, and the volume of ROS is reduced by ~50–60%. Analytical methods, including Rho and retinoid measurements, showed that Rho+/− mice have a reduction of ~40% in the amount of Rho. These results established that Rho+/− mice have at least as high a density of Rho as WT mice, and probably somewhat higher. Therefore, it is not surprising that results from TEM and AFM of native disc membranes revealed a similar organization of Rho as observed in native discs from WT mice.
TEM and AFM of Disc Membranes from Rho+/− Mice
In our previous studies, we demonstrated the paracrystallinity of Rho dimers in the native disc membrane by TEM and AFM (30, 31, 33). This observation was made for membranes isolated both at temperatures between 0 and 5 °C and at room temperature. In this study, TEM and image processing of Rho+/− disc membranes yielded powder diffraction with a diffuse ring at ~4.5 nm−1 similarly to TEM of disc membranes from WT mice (30, 31, 33). The results from TEM and AFM indicate no major changes in the organization of Rho in the native disc membrane of Rho+/− mice compared with WT mice. Together, they further support the notion that the electrophysiological differences between WT and Rho+/− are due to changes in the volume of ROS, altered cation homeostasis, and/or different ratios of phototransduction proteins.
Lipid-Rho Ratio: Theoretical Considerations
Based on AFM measurements for the Rho paracrystal (distances of 3.8 nm and 8.4 nm with an 85° angle between them), 63,000 Rho molecules per 1 μm2 are assigned. This is a maximal number of Rho molecules. All simulations described in the Supplemental Material (Supplemental Figs. 3–5) were conducted for a paracrystalline model, so all derived numbers of phospholipids displaced by Rho molecules are maximal. Simulations of a rod disc membrane without Rho revealed 3.16 × 10⁶ phospholipids (both sides)/1 μm2. Simulations of a membrane with Rho resulted in 1.36 × 10⁶ phospholipids/1 μm2; thus, Rho molecules in the densest form displace 1.80 × 10⁶ phospholipids/1 μm2. When an average number of Rho is taken (48,300 Rho molecules/1 μm2), the calculated number of displaced phospholipids is smaller (1.38 × 10⁶/1 μm2). Since the rim region of the discs may preferentially express the structural proteins such as peripherin and ROM, the average density of rhodopsin would be lower and close to the measured ratio of 54–86 phospholipids/ Rho (36, 48). The density of Rho in WT disc membranes was estimated to be 25,000 Rho/μm2 (49) or 7×10⁷ Rho molecules/ rod. Since mouse ROS contains 810 ± 33 discs, at 25,000 Rho/μm2 density, the rod cell would contain only 5·107 Rho molecules/rod. Our measurements by AFM yielded a density between 30,000–55,000 Rho/μm2 (31) and ~108 Rho molecules per rod, closer to the expected value.
Physiological Consequences of a Smaller Volume of ROS in Rho+/− Photoreceptors
Makino and co-workers (36) showed that in the hemizygous knockout mice, the rising phases and recoveries of flash responses accelerate by about 1.7-fold in vivo. This finding was interpreted in light of a roughly 50% reduction in Rho crowding. We reproduced these electrophysiological findings and extended them by recovery measurements using a two-flash paradigm. Rods from Rho+/− responded to dim flashes with reduced sensitivity, which can be attributed to a diminished quantum catch caused by the lowered level of Rho. Flash responses of Rho+/− rods also had faster kinetics than WT rods. Under two-flash experimental conditions, ERG responses of Rho+/− rods recovered sooner than those of WT controls (Fig. 2).
These physiological responses should be considered in light of the different ROS structures rather than the density of Rho in ROS. A smaller volume of ROS in Rho+/− would accelerate exchanges, entry, and extrusion of Ca2+ and other cations, producing the obtained electrophysiological responses. During the normal photoresponse, the recovery is accelerated because of Ca2+ feedback mechanisms. Ca2+ enters the OS through the plasma membrane cGMP-gated channel and is extruded by a Na+/Ca2+, K+ exchanger. Closure of the channels during the photoresponse stops the entry of Ca2+, but its efflux continues, so intracellular Ca2+ declines. This decline in Ca2+ concentration is responsible for accelerated cGMP production by membrane-bound guanylate cyclases stimulated by Ca2+-free forms of guanylate cyclase-activating proteins (50, 51). Assuming the same density of Ca2+ channels and Na+/Ca2+,K+ exchanger in Rho+/− and WT rods, the decrease in number of these proteins per rod and the shortened time for ion exchange can explain the 1.7-fold accelerated responses of rods from Rho+/− in the previous reports (36). The role of ROS volume in response kinetics has been reviewed by Pugh and Lamb (49). Another possibility is the altered expression of some critical genes involved in phototransduction and/or ion homeostasis. Although the Ca2+ feedback was unperturbed in Rho+/− as measured indirectly by exchange current in Ref. 36, a combination of all cation fluxes, structural changes, and expression levels of the critical genes involved in the forming of phototransduction responses may contribute to differences in physiological responses of rod from Rho+/− mice. For example, underexpression or overexpression of guanylate cyclase-activating protein 1 produced significant changes in the kinetics of phototransduction (43, 52). If the expression of Rho kinase, RGS9, guanylate cyclase-activating protein 1, and other critical components are unchanged in Rho+/− mice as compared with their expression in WT, a smaller volume of ROS could ultimately lead to faster responses. Additional biochemical studies on photoreceptors from Rho+/− mice may provide additional insight in understanding phototransduction.
Acknowledgments
We thank Dr. Janis Lem for the Rho+/− founders of our mouse colony; Dr. Fred Rieke for the single cell recordings; Dr. Alex Moise, Dr. Paul Park, and Rebecca Birdsong for help during manuscript preparation; and Matthew Batten for help with retinoid analysis.
Footnotes
This work was supported in part by NEI, National Institutes of Health, United States Public Health Service Grants EY01730 and EY08061, an unrestricted grant from Research to Prevent Blindness, Inc. (New York, NY) (to the Department of Ophthalmology at the University of Washington), and a grant from the E. K. Bishop Foundation. This study was also supported by funds from Polish State Committee for Scientific Research Grant 3P05F02625.
The on-line version of this article (available at http://www.jbc.org) contains five additional figures.
The abbreviations used are: GPCR, G protein-coupled receptor; AFM, atomic force microscope/microscopy; ERG, electroretinogram; Rho, rhodopsin; OS, outer segment(s); ROS, rod OS; SEM, scanning electron microscopy; TEM, transmission electron microscopy; WT, wild type; HPLC, high pressure liquid chromatography; BisTris, 2-[bis(2-hydroxyethyl)amino]-2-(hydroxymethyl)-1,3-propandiol.
F. Rieke and K. Palczewski, unpublished results.
References
- 1.Mirzadegan T, Benko G, Filipek S, Palczewski K. Biochemistry. 2003;42:2759–2767. doi: 10.1021/bi027224+. [DOI] [PMC free article] [PubMed] [Google Scholar]
- 2.Gether U. Endocr Rev. 2000;21:90–113. doi: 10.1210/edrv.21.1.0390. [DOI] [PubMed] [Google Scholar]
- 3.Krebs A, Edwards PC, Villa C, Li J, Schertler GF. J Biol Chem. 2003;278:50217–50225. doi: 10.1074/jbc.M307995200. [DOI] [PubMed] [Google Scholar]
- 4.Vogel R, Ruprecht J, Villa C, Mielke T, Schertler GF, Siebert F. J Mol Biol. 2004;338:597–609. doi: 10.1016/j.jmb.2004.03.006. [DOI] [PubMed] [Google Scholar]
- 5.Okada T, Le Trong I, Fox BA, Behnke CA, Stenkamp RE, Palczewski K. J Struct Biol. 2000;130:73–80. doi: 10.1006/jsbi.1999.4209. [DOI] [PubMed] [Google Scholar]
- 6.Teller DC, Okada T, Behnke CA, Palczewski K, Stenkamp RE. Biochemistry. 2001;40:7761–7772. doi: 10.1021/bi0155091. [DOI] [PMC free article] [PubMed] [Google Scholar]
- 7.Okada T, Ernst OP, Palczewski K, Hofmann KP. Trends Biochem Sci. 2001;26:318–324. doi: 10.1016/s0968-0004(01)01799-6. [DOI] [PubMed] [Google Scholar]
- 8.Palczewski K, Kumasaka T, Hori T, Behnke CA, Motoshima H, Fox BA, Le Trong I, Teller DC, Okada T, Stenkamp RE, Yamamoto M, Miyano M. Science. 2000;289:739–745. doi: 10.1126/science.289.5480.739. [DOI] [PubMed] [Google Scholar]
- 9.Okada T, Palczewski K. Curr Opin Struct Biol. 2001;11:420–426. doi: 10.1016/s0959-440x(00)00227-x. [DOI] [PubMed] [Google Scholar]
- 10.Okada T, Fujiyoshi Y, Silow M, Navarro J, Landau EM, Shichida Y. Proc Natl Acad Sci U S A. 2002;99:5982–5987. doi: 10.1073/pnas.082666399. [DOI] [PMC free article] [PubMed] [Google Scholar]
- 11.Baneres JL, Parello J. J Mol Biol. 2003;329:815–829. doi: 10.1016/s0022-2836(03)00439-x. [DOI] [PubMed] [Google Scholar]
- 12.Schlegel W, Kempner ES, Rodbell M. J Biol Chem. 1979;254:5168–5176. [PubMed] [Google Scholar]
- 13.Chabre M, Cone R, Saibil H. Nature. 2003;426:30–31. doi: 10.1038/426030b. [DOI] [PubMed] [Google Scholar]
- 14.Hargrave PA. Invest Ophthalmol Vis Sci. 2001;42:3–9. [PubMed] [Google Scholar]
- 15.Angers S, Salahpour A, Bouvier M. Annu Rev Pharmacol Toxicol. 2002;42:409–435. doi: 10.1146/annurev.pharmtox.42.091701.082314. [DOI] [PubMed] [Google Scholar]
- 16.Dean MK, Higgs C, Smith RE, Bywater RP, Snell CR, Scott PD, Upton GJ, Howe TJ, Reynolds CA. J Med Chem. 2001;44:4595–4614. doi: 10.1021/jm010290+. [DOI] [PubMed] [Google Scholar]
- 17.Filizola M, Olmea O, Weinstein H. Protein Eng. 2002;15:881–885. doi: 10.1093/protein/15.11.881. [DOI] [PubMed] [Google Scholar]
- 18.Breitwieser GE. Circ Res. 2004;94:17–27. doi: 10.1161/01.RES.0000110420.68526.19. [DOI] [PubMed] [Google Scholar]
- 19.Soyer OS, Dimmic MW, Neubig RR, Goldstein RA. Biochemistry. 2003;42:14522–14531. doi: 10.1021/bi035097r. [DOI] [PubMed] [Google Scholar]
- 20.Terrillon S, Bouvier M. EMBO Rep. 2004;5:30–34. doi: 10.1038/sj.embor.7400052. [DOI] [PMC free article] [PubMed] [Google Scholar]
- 21.Bai M. Cell Signal. 2004;16:175–186. doi: 10.1016/s0898-6568(03)00128-1. [DOI] [PubMed] [Google Scholar]
- 22.Hernanz-Falcon P, Rodriguez-Frade JM, Serrano A, Juan D, del Sol A, Soriano SF, Roncal F, Gomez L, Valencia A, Martinez AC, Mellado M. Nat Immunol. 2004;5:216–223. doi: 10.1038/ni1027. [DOI] [PubMed] [Google Scholar]
- 23.Romano C, Yang WL, O’Malley KL. J Biol Chem. 1996;271:28612–28616. doi: 10.1074/jbc.271.45.28612. [DOI] [PubMed] [Google Scholar]
- 24.Javitch, J. A. (2004) Mol. Pharmacol., in press
- 25.Rios CD, Jordan BA, Gomes I, Devi LA. Pharmacol Ther. 2001;92:71–87. doi: 10.1016/s0163-7258(01)00160-7. [DOI] [PubMed] [Google Scholar]
- 26.Filipek S, Stenkamp RE, Teller DC, Palczewski K. Annu Rev Physiol. 2003;65:851–879. doi: 10.1146/annurev.physiol.65.092101.142611. [DOI] [PMC free article] [PubMed] [Google Scholar]
- 27.Molday RS. Invest Ophthalmol Vis Sci. 1998;39:2491–2513. [PubMed] [Google Scholar]
- 28.Fotiadis D, Liang Y, Filipek S, Saperstein DA, Engel A, Palczewski K. Nature. 2003;426:31. doi: 10.1038/421127a. [DOI] [PubMed] [Google Scholar]
- 29.Fotiadis D, Liang Y, Filipek S, Saperstein DA, Engel A, Palczewski K. FEBS Lett. 2004;564:281–288. doi: 10.1016/S0014-5793(04)00194-2. [DOI] [PMC free article] [PubMed] [Google Scholar]
- 30.Liang Y, Fotiadis D, Filipek S, Saperstein DA, Palczewski K, Engel A. J Biol Chem. 2003;278:21655–21662. doi: 10.1074/jbc.M302536200. [DOI] [PMC free article] [PubMed] [Google Scholar]
- 31.Fotiadis D, Liang Y, Filipek S, Saperstein DA, Engel A, Palczewski K. Nature. 2003;421:127–128. doi: 10.1038/421127a. [DOI] [PubMed] [Google Scholar]
- 32.Ridge KD, Abdulaev NG, Sousa M, Palczewski K. Trends Biochem Sci. 2003;28:479–487. doi: 10.1016/S0968-0004(03)00172-5. [DOI] [PubMed] [Google Scholar]
- 33.Filipek S, Krzysko KA, Fotiadis D, Liang Y, Saperstein DA, Engel A, Palczewski K. Photochem Photobiol Sci. 2004;3:628–638. doi: 10.1039/b315661c. [DOI] [PubMed] [Google Scholar]
- 34.Carrillo, J. J., Lopez-Gimenez, J. F., and Milligan, G. (2004) Mol. Pharmacol., in press [DOI] [PubMed]
- 35.Medina R, Perdomo D, Bubis J. J Biol Chem. 2004;279:39565–39573. doi: 10.1074/jbc.M402446200. [DOI] [PubMed] [Google Scholar]
- 36.Calvert PD, Govardovskii VI, Krasnoperova N, Anderson RE, Lem J, Makino CL. Nature. 2001;411:90–94. doi: 10.1038/35075083. [DOI] [PubMed] [Google Scholar]
- 37.Lem J, Krasnoperova NV, Calvert PD, Kosaras B, Cameron DA, Nicolo M, Makino CL, Sidman RL. Proc Natl Acad Sci U S A. 1999;96:736–741. doi: 10.1073/pnas.96.2.736. [DOI] [PMC free article] [PubMed] [Google Scholar]
- 38.Ohguro H, Chiba S, Igarashi Y, Matsumoto H, Akino T, Palczewski K. Proc Natl Acad Sci U S A. 1993;90:3241–3245. doi: 10.1073/pnas.90.8.3241. [DOI] [PMC free article] [PubMed] [Google Scholar]
- 39.Muller DJ, Amrein M, Engel A. J Struct Biol. 1997;119:172–188. doi: 10.1006/jsbi.1997.3875. [DOI] [PubMed] [Google Scholar]
- 40.Van Hooser JP, Aleman TS, He YG, Cideciyan AV, Kuksa V, Pittler SJ, Stone EM, Jacobson SG, Palczewski K. Proc Natl Acad Sci U S A. 2000;97:8623–8628. doi: 10.1073/pnas.150236297. [DOI] [PMC free article] [PubMed] [Google Scholar]
- 41.Jang GF, Van Hooser JP, Kuksa V, McBee JK, He YG, Janssen JJ, Driessen CA, Palczewski K. J Biol Chem. 2001;276:32456–32465. doi: 10.1074/jbc.M104949200. [DOI] [PMC free article] [PubMed] [Google Scholar]
- 42.Palczewski K, Van Hooser JP, Garwin GG, Chen J, Liou GI, Saari JC. Biochemistry. 1999;38:12012–12019. doi: 10.1021/bi990504d. [DOI] [PubMed] [Google Scholar]
- 43.Howes KA, Pennesi ME, Sokal I, Church-Kopish J, Schmidt B, Margolis D, Frederick JM, Rieke F, Palczewski K, Wu SM, Detwiler PB, Baehr W. EMBO J. 2002;21:1545–1554. doi: 10.1093/emboj/21.7.1545. [DOI] [PMC free article] [PubMed] [Google Scholar]
- 44.Carter-Dawson LD, LaVail MM. J Comp Neurol. 1979;188:263–272. doi: 10.1002/cne.901880205. [DOI] [PubMed] [Google Scholar]
- 45.Carter-Dawson LD, LaVail MM. J Comp Neurol. 1979;188:245–262. doi: 10.1002/cne.901880204. [DOI] [PubMed] [Google Scholar]
- 46.McBee JK, Palczewski K, Baehr W, Pepperberg DR. Prog Retin Eye Res. 2001;20:469–529. doi: 10.1016/s1350-9462(01)00002-7. [DOI] [PubMed] [Google Scholar]
- 47.Humphries MM, Rancourt D, Farrar GJ, Kenna P, Hazel M, Bush RA, Sieving PA, Sheils DM, McNally N, Creighton P, Erven A, Boros A, Gulya K, Capecchi MR, Humphries P. Nat Genet. 1997;15:216–219. doi: 10.1038/ng0297-216. [DOI] [PubMed] [Google Scholar]
- 48.Stone WL, Farnsworth CC, Dratz EA. Exp Eye Res. 1979;28:387–397. doi: 10.1016/0014-4835(79)90114-3. [DOI] [PubMed] [Google Scholar]
- 49.Pugh EN, Jr, Lamb TD. Biochim Biophys Acta. 1993;1141:111–149. doi: 10.1016/0005-2728(93)90038-h. [DOI] [PubMed] [Google Scholar]
- 50.Polans A, Baehr W, Palczewski K. Trends Neurosci. 1996;19:547–554. doi: 10.1016/s0166-2236(96)10059-x. [DOI] [PubMed] [Google Scholar]
- 51.Palczewski K, Polans AS, Baehr W, Ames JB. BioEssays. 2000;22:337–350. doi: 10.1002/(SICI)1521-1878(200004)22:4<337::AID-BIES4>3.0.CO;2-Z. [DOI] [PubMed] [Google Scholar]
- 52.Mendez A, Burns ME, Sokal I, Dizhoor AM, Baehr W, Palczewski K, Baylor DA, Chen J. Proc Natl Acad Sci U S A. 2001;98:9948–9953. doi: 10.1073/pnas.171308998. [DOI] [PMC free article] [PubMed] [Google Scholar]