

Abstract
Purpose
To elucidate the phenotypic and biochemical characteristics of a novel mutation associated with autosomal dominant cone–rod dystrophy (adCORD).
Methods
Twenty-three family members of a CORD pedigree underwent clinical examinations, including visual acuity tests, standardized full-field ERG, and fundus photography. Genomic DNA was screened for mutations in GCAP1 exons using DNA sequencing and single-strand conformational polymorphism (SSCP) analysis. Function and stability of recombinant GCAP1-L151F were tested as a function of [Ca2+], and its structure was probed by molecular dynamics.
Results
Affected family members experienced dyschromatopsia, hemeralopia, and reduced visual acuity by the second to third decade of life. Electrophysiology revealed a nonrecordable photopic response with later attenuation of the scotopic response. Affected family members harbored a C→T transition in exon 4 of the GCAP1 gene, resulting in an L151F missense mutation affecting the EF hand motif 4 (EF4). This change was absent in 11 unaffected family members and in 100 unrelated normal subjects. GCAP1-L151F stimulation of photoreceptor guanylate cyclase was not completely inhibited at high physiological [Ca2+], consistent with a lowered affinity for Ca2+-binding to EF4.
Conclusions
A novel L151F mutation in the EF4 hand domain of GCAP1 is associated with adCORD. The clinical phenotype is characterized by early cone dysfunction and a progressive loss of rod function. The biochemical phenotype is best described as persistent stimulation of photoreceptor guanylate cyclase, representing a gain of function of mutant GCAP1. Although a conservative substitution, molecular dynamics suggests a significant change in Ca2+-binding to EF4 and EF2 and changes in the shape of L151F-GCAP1.
In rod and cone photoreceptors, two diffusible secondary messengers, cGMP 1–3 and Ca2+,4–8 regulate phototransduction and recovery of photoreceptors from photobleaching. In the dark-adapted photoreceptor cells, concentrations of both cGMP and Ca2+ are high (1–10 and 0.5–1 μM, respectively). High levels of cGMP keep a portion of cGMP-gated cation channels in the open state, and photoreceptors are depolarized. The effect of phototransduction is to lower [cGMP] rapidly by activation of rod- and cone-specific cGMP phosphodiesterases (PDE6s), an event that closes channels located in the plasma membrane, causing hyperpolarization of the cell. In the recovery phase, after shut-off of other activated phototransduction components, cGMP must be replenished by a membrane-associated guanylate cyclase (GC). GC is activated when Ca2+ decreases after photobleaching, as a consequence of the closure of cation channels and the continued extrusion of Ca2+ by a light-insensitive Na+/Ca2+-K+ exchanger.7 The Ca2+ sensitivity of GC is mediated by a set of calmodulin-like Ca2+-binding proteins termed guanylate cyclase-activating proteins (GCAPs).9,10 When the Ca2+ concentration decreases below 200 nM, Ca2+ dissociates from GCAP, converting it into a GC activator. Once cGMP levels are replenished to normal dark levels, cation channels open again, Ca2+ levels are restored, and GCAP reassociates with Ca2+ and reverts into an inhibitor, terminating GC stimulation.
In human retina, two GCs (GC1 and -2) and three GCAPs (GCAP1 to -3) have been identified.9–15 GC1 (gene symbol GUCY2D) is located on chromosome 17 at p13.1 and GC2 (GUCY2F) at Xp22. Both cyclases are closely related in structure and function, and both are expressed specifically in photoreceptors.16 Only GC1 gene defects have been associated with Leber congenital amaurosis (LCA type 1)17,18 and dominant cone–rod dystrophy (CORD1),19 whereas pathogenic mutations in the GC2 gene have not been identified. GCAP1 and -2 are arranged on opposite strands in a tail-to-tail gene array (GUCA1A and GUCA1B) on chromosome 6 at p21.1,20 separated by a 5-kb intergenic region. The GCAP3 gene (GUCA1C), structurally identical with the GCAP1/2 genes, is located on chromosome 3 at q13.1.14 Several missense mutations in two of three functional EF hands of GCAP1 (Y99C, E155G, and I143NT) have been linked to autosomal dominant cone dystrophy (adCD).21–23 A transgenic mouse model expressing GCAP1-Y99C has recently been shown to produce cone–rod degeneration.24 A fourth mutation (P50L), affecting a variable Pro residue present only in some GCAP1s of various species, has been found to be associated with adCORD.25,26 Several polymorphisms not linked to disease were discovered in the GCAP2 gene,27 and recently, a G157R missense mutation in the GUCA1B gene (GCAP2) has been suggested to be causative of recessive RP.28 However, one family member carrying the mutation had an asymptomatic normal phenotype; thus, the pathogenicity of this mutation is unproved. To date, no pathogenic mutations have been identified in the human GCAP3 gene.
Null alleles of GC1 in humans17,18,29 and the deletion of GC1 in mouse30 and other animals31 cause severe retinal dystrophies. Deletion of GCAP1 and -2 genes in mice, however, affects only recovery from bleaching, whereas the retina stays intact,32 suggesting that GCAP gene expression is not essential for development or survival of photoreceptor cells. In GCAP−/−retinas, Ca2+ sensitivity of GC is abolished and recovery of both the cone driven b- and a-wave is delayed. Transgenic GCAP1, but not GCAP2, could restore normal rod and cone response recovery.32–34 Taken together, these genetic results suggest that GCAP1 and GC1 form a Ca2+-sensitive regulatory complex indispensable for regulation of phototransduction in rods and cones.
In this communication, we analyzed a 23-member family of an autosomal dominant cone-rod dystrophy (CORD) pedigree for pathogenic mutations. We focused our attention on the GCAP gene array located at 6p21.120 and identified a novel missense mutation which cosegregated with affected family members. The mutation affected Ca2+-binding to EF4 and compromised inhibition of activated GCAP1, leading to persistent GC1 stimulation in the dark, and presumably elevated levels of cGMP.
MATERIALS AND METHODS
Patients
The study was approved by the institutional review board of the University of Iowa Carver College of Medicine and adhered to the tenets of the Declaration of Helsinki. Patients comprised a single large family. There were 11 branches of the family, with 4 branches having affected family members. We use the term “family” to refer to the descendants of a multigeneration pedigree of known related individuals (Fig. 1). Autosomal dominant inheritance was evident with the presence of multiple affected individuals in each generation and male-to-male transmission. Twenty-six individuals participated in this study. In all patients, phenotypic characterization included an ophthalmic history, assessment of visual acuity, Farnswell-Munsworth color vision testing, and a funduscopic examination. Selected patients (Table 1) received additional psychophysical testing, which included a Ganzfeld electroretinogram (ERG) in accordance with the recommendations of the International Society for Clinical Electrophysiology of Vision, as well as a Goldmann visual field. Patients were considered affected if they had bilateral central visual loss associated with macular retinal pigment epithelial (RPE) abnormalities and poor color vision. In all cases, the disease status was determined before genotyping. In cases in which the patient had died, the disease status was inferred by clinical history obtained from family members and from medical records, when available.
Figure 1.
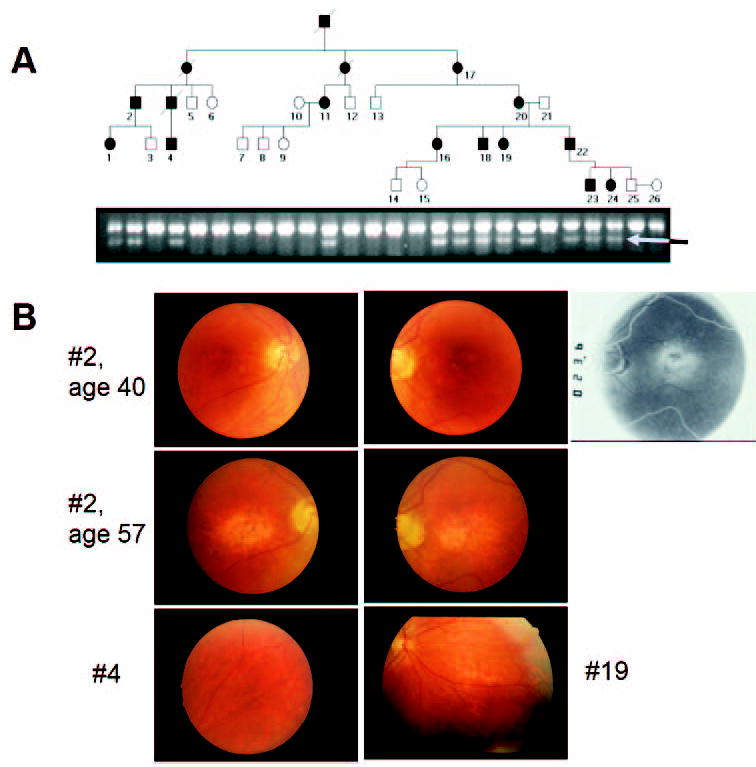
Clinical data. (A) Pedigree of a family with autosomal dominant cone–rod dystrophy (adCORD). A C→T transition in exon 4 of GCAP1 that would be expected to result in an L151F missense mutation in GCAP1 was identified by SSCP and DNA sequencing. Further analysis revealed that this mutation created an EcoRI restriction site in the gene. A 200-bp PCR product containing this site was generated for all family members and was subjected to EcoRI digestion. Unaffected family members demonstrated a single uncut band, whereas affected individuals showed a diagnostic second band (arrow). Individuals from whom blood samples were not acquired are not depicted. (B) Examples of funduscopic features in adCORD associated with the GCAP1-L151F mutation. Labels correspond to patient numbers in Table 1. Top row: Patient 2 had mild central pigmentary maculopathy at age 40, more evident with perifoveal RPE transmission defects on angiography (rightmost panel). Middle row: Patient 2, 17 years later, had marked central atrophy. Bottom row: Patients 4, 19 (33 and 26 years of age, respectively) showed extra-macular pigmentary abnormalities.
Table 1.
Clinical and Electrophysiologic Findings in Affected Family Members
| Patient | Age (y) | BCVA (OD, OS) | Photopic ERG (% amp)* | Scotopic ERG (% amp)† | Field Defect | Hemeralopia | Color Deficit‡ |
|---|---|---|---|---|---|---|---|
| 1 | 10 | 20/25, 20/25 | Minimal | Borderline | + | ++ | |
| 2320/40, 20/40 | NR | 62% | |||||
| 2 | 40 | 20/60, 20/200 | Minimal | <50% | Central | + | |
| 57 | 20/400, 20/400 | NR | NR | ||||
| 4 | 33 | 20/160, 20/50 | 20% | 37% | Central, Paracentral | + | ++ |
| 38 | 20/200, 20/50 | NR | 73% | ||||
| 11 | 58 | 20/400, 20/400 | |||||
| 16 | 27 | 20/40, 20/30 | ++ | ||||
| 35 | 20/50, 20/50 | ||||||
| 17 | 85 | LP, LP | Unable | ||||
| 18 | 36 | 20/40, 20/40 | ++ | ||||
| 19 | 26 | 20/40, 20/50 | Slightly reduced | Borderline | Central | − | ++ |
| 37 | 20/63, 20/80 | ||||||
| 20 | 40 | 20/60, 20/50 | No red | Normal | None | + | ++ |
| 61 | 20/125, 20/125 | ||||||
| 22 | 17 | 20/30, 20/40 | No red 13%; no flicker | Normal | Paracentral | + | + |
| 38 | 20/50, 20/50 | 78% | + | ++ | |||
| 23 | 18 | 20/25, 20/25 | ++ | ||||
| 24 | 17 | 20/20, 20/20 | Delayed implicit time | Normal |
BCVA, best corrected visual acuity; LP, light perception only; NR, nonrecordable ERG.
b-Wave amplitude for 10-minute light-adapted, bright, white flash (as percentage of the minimum normal response, average of both eyes). Textual descriptions were adapted directly from summary reports when original tracings were not available.
b-Wave amplitude for 30-minute dark-adapted, dim (−24 dB) white flash (calculated as described for photopic response).
(++), severe dyschromatopsia based on FM-100 error score >300 or 0/14 pseudoisochromatic plates; (+), FM-100 error score >200 or red dyschromatopsia by Nagel anomaloscope.
Genotyping and Mutation Analysis
Genomic DNA was extracted from peripheral blood by using standard techniques. For both genotyping and mutation screening, 12.4 ng of each patient’s DNA were used as a template in an 8.35 μL polymerase chain reaction (PCR) containing: 1.25 μL 10× buffer (100 mM Tris-HCl [pH 8.3], 500 mM KCl, and 15 mM MgCl2); 300 μM each of dCTP, dATP, dGTP, and dTTP; 1 picomole of each primer, and 0.25 units polymerase (Biolase, San Clemente, CA). Samples were denatured for 5 minutes at 94°C and incubated for 35 cycles under the following conditions: 94°C for 30 seconds, 55°C for 30 seconds, and 72°C for 30 seconds in a DNA thermocycler (Omnigene; ThermoHybaid, Ashton, UK). After amplification, 5 μL of stop solution (95% formamide, 10 mM NaOH, 0.05% bromophenol blue, and 0.05% xylene cyanol) were added to each sample. For analysis of short tandem repeat polymorphisms (STRPs), the PCR amplification products were denatured for 3 minutes at 94°C and electrophoresed on 0.4 mm denaturing gels (6% 19:1 acrylamidebis, and 7 M urea) with a running buffer of 1.0% TBE at 65 W for 3 hours at room temperature. After electrophoresis, gels were stained with a silver nitrate solution. For each marker, samples were labeled according to allele pair size and analyzed for segregation within the family. Pair-wise linkage analysis was performed with MLINK and LODSCORE programs as implemented in the FASTLINK (ver. 2.3) version of the LINKAGE program package (http:www.hgmp.mrc.ac.uk/; provided in the public domain by the Human Genome Mapping Project Resources Centre, Cambridge, UK). For single strand conformational polymorphism (SSCP) analysis, amplification products were denatured for 3 minutes at 94°C and electrophoresed on 6% polyacrylamide, 5% glycerol gels at 25 W for approximately 3 hours at room temperature. After electrophoresis, gels were stained with silver nitrate. Abnormal PCR products identified by SSCP analysis were sequenced by using fluorescent dideoxynucleotides on an automated sequencer (model 377; Applied Biosystems Inc., Foster City, CA). All sequencing was bidirectional.
Expression Constructs of Mutant GCAP1s
The mutations were introduced into a human GCAP1 plasmid (hG-CAP113) by site-directed mutagenesis, and the mutant GCAPs were expressed in insect cells. Briefly, the EcoRI-digested insert of hGCAP1 was cloned into pFastBac-1 (Invitrogen-Gibco, Grand Island, NY) and transformed into the XL1-Gold Escherichia coli strain. The orientation of the resultant plasmid was confirmed with PstI digests, and the mutations were verified by DNA sequencing with the primers 5′-GTTGGCTACGTATACTCCGG and 5′-GTAAAACCTCTACAAATGTGG. Mutagenesis to generate GCAP1-I151F was performed in this plasmid with the sense primer 5′-AACGGGGATGGGGAATTCTCCCTGGAAGAG and the antisense primer 5′-CTCTTCCAGGGAGAATTCCCCATCCCCGTT (italic nucleotides introduce the mutation). Wild-type human GCAP1, GCAP1-E155G, and GCAP1-I143NT plasmids (pFastBac) were generated as previously described.22
SDS-PAGE and Immunoblot Analysis
The expression of GCAP1 proteins was confirmed with UW101 antibody using SDS-PAGE and immunoblot analysis, as described.35 All purification procedures were performed at 4°C. After homogenization, cell suspensions were centrifuged at 100,000g for 20 minutes. Supernatants were used as a source of recombinant proteins for protein purification. GCAPs were purified using monoclonal antibody (G2) coupled to CNBr-activated Sepharose resin (~5 mg of IgG per 1 mL of the gel) as described previously.36 Purified proteins were dialyzed overnight against 10 mM BTP (pH 7.5), containing 100 mM NaCl. The purity of the proteins was estimated by SDS-PAGE and Coomassie staining. SDS-PAGE in the presence and absence of Ca2+ and limited proteolysis of purified GCAP1 and GCAP1 mutants were performed as described previously.22,37
GC Activity Assay
Washed rod outer segment (ROS) membranes38 were prepared from fresh bovine retinas reconstituted with recombinant GCAPs and assayed as described.39 [Ca2+] was calculated using the computer program Chelator 1.0040 and adjusted to higher concentrations by increasing the amount of CaCl2. All assays were repeated at least twice.
Fluorescence Measurements
Fluorescence measurements of GCAP1 and its mutants were performed on a spectrofluorometer (LS 50B; PerkinElmer, Wellesley, MA) using a 1 × 1-cm quartz cuvette. Emission spectra were recorded with excitation at 280 nm at 5-nm slit widths in 50 mM HEPES (pH 7.8), containing 60 mM KCl, 20 mM NaCl, 1 mM EGTA, 1 mM dithiothreitol, and 10−10 to 10−5 M CaCl2.
Modeling GCAP1 and GCAP1-L151F
A model of GCAP1 was built using the homology modeling method in the program Modeler41 from the Homology Module of the Insight II software (ver. 2000; Accelrys Inc., San Diego, CA) based on the crystal structure of unmyristoylated GCAP2 with three calcium ions bound (1JBA accession code in Protein Data Bank; pdbbeta.rcsb.org/pdb; provided in the public domain by Research Collaboratory for Structural Bioinformatics).42,43 The quality of the calculated structure was checked by the Profile-3D program.44 The C-terminal region, encompassing residues 177–201 of GCAP1 extending beyond residues in the crystal structure of GCAP2, was not modeled. This 177–201 fragment does not contain EF hand domains and is not essential for GC-stimulating activity.37
Homology modeling was applied for the structure of WT and L151F-GCAP1. After energy minimization, molecular dynamic (MD) simulations were performed for WT and L151F-GCAP1. All MD tasks were conducted in a periodic box filled with TIP3P-type water at a constant pressure of 1 atm and a temperature of 300 K. During the first 100 ps of equilibration phase, the protein was frozen, and water with sodium and chloride counterions was allowed to move. Then a 1-ns production phase of MD was applied. To double-check results, we used Yasara (“yet another scientific artificial reality application” ver. 4.9; Yasara Biosciences, http://www.yasara.org/index.html) with the Yamber2 force field (modification of the Amber99 force field) and Namd2 (http://www.ks.uiuc.edu/research/namd/ provided in the public domain by Theoretical Biophysics Group, Beckman Institute, University of Illinois, Chicago, IL)45 with Charmm 27 force field (http://www.charmm.org) for both minimization and MD. In both programs, a particle mesh Ewald (PME) algorithm46 for treatment of long-range electrostatic interactions was used.
RESULTS
Phenotypic Appearance of GCAP1-L151F Patients
Common symptoms in affected family members included photophobia, depressed central vision, and poor color vision. In the first decade of life, the funduscopic changes were minimal, consisting of a subtle, but definite, granularity of the retinal pigment epithelium (RPE). Visualization of the RPE abnormality was enhanced by fluorescein angiography. These minimal findings were consistent with the patients’ vision, which was as good as 20/20. However, color vision was consistently abnormal, even in patients with relatively good visual acuity. For example, patient 1 had a complete inability to recognize any of the color plates at the age of 11. Moreover, the photopic ERG response was severely depressed (Table 1). Later changes included a progressive decline in best corrected visual acuity associated with the development of more pronounced macular atrophy (Fig. 1B). The photopic electroretinogram was nonrecordable in patients in the second and third decades of life. Some patients noted precipitous vision loss when the macular atrophy extended through fixation. Patients older than 55 had very poor vision (Table 1). The eldest patient (no. 17) was 85 at the time of examination and had only light perception vision in both eyes. Funduscopic examination of the latter individual revealed central atrophy with marked arteriolar attenuation and bone-spicule–like pigmentation in the periphery.
Genetic Screening and Identification of a Missense Mutation in GCAP1
Linkage analysis using short tandem repeat polymorphisms revealed significant linkage between the CORD phenotype and genetic markers from 6p21, near the locus of the peripherin-2 gene (RDS) (6p21.2-p12.3). The maximum LOD score of 3.38 was obtained with marker D6S1650. Analysis of recombination events in the pedigree revealed the limits of the disease interval to lie between markers D6S1549 and D6S459, an interval that contains the RDS, GCAP1, and GCAP2 genes. However, SSCP analysis and direct DNA sequencing of the coding sequences of the RDS gene revealed no disease-causing sequence variations. We therefore analyzed the coding regions of the GCAP1 and GCAP2 genes and identified a novel C→T transition at the 5′ end of exon 4 in the GCAP1 gene in all affected family members (Fig. 1A). This variation changes the normal leucine residue at position 151 to phenylalanine (L151F). It was not present in any unaffected family members nor in any of more than 100 additional control subjects. Residue L151 is located within a high-affinity, Ca2+-binding domain (EF4) in the C-terminal domain of GCAP1. Replacement of L151 by F is considered a conservative substitution, and its linkage to disease is surprising.
GCAPs have three high-affinity Ca2+-binding sites consisting of helix-loop-helix EF hand motifs,47 termed EF2, -3, and -4. The EF hand is a common Ca2+-binding motif consisting of a 12-amino-acid loop flanked by a 12-amino-acid α helix at either end, providing heptahedral coordination for the Ca2+ ion.48 Of note, residues 1 and 12 of the Ca2+-binding loop are invariantly acidic (D or E), and residues flanking the binding loop are invariantly hydrophobic (I, L, F, Y).49 In all GCAPs, the EF1 motif is incompatible with Ca2+-binding because of the absence of key residues essential for Ca2+ coordination.
Ca2+-Binding Characteristics of GCAP1-L151F
Cosegregation of GCAP1-L151F with CORD in 16 of 26 family members represents a strong indication of pathogenicity. We hypothesized that the mutation, although a conservative substitution, may affect Ca2+-binding to EF4, because L151F is located at a central position in EF4 (Fig. 2A). Residues close to L151—namely, E155 and I143—have been found to be mutated in families with cone dystrophy.22,23 However, the mutations E155G and I143NT, are nonconservative and are thought to affect Ca2+-binding severely. To verify the effects of L151F on Ca2+-binding, we further analyzed recombinant GCAP1-L151F by biochemical methods.
Figure 2.
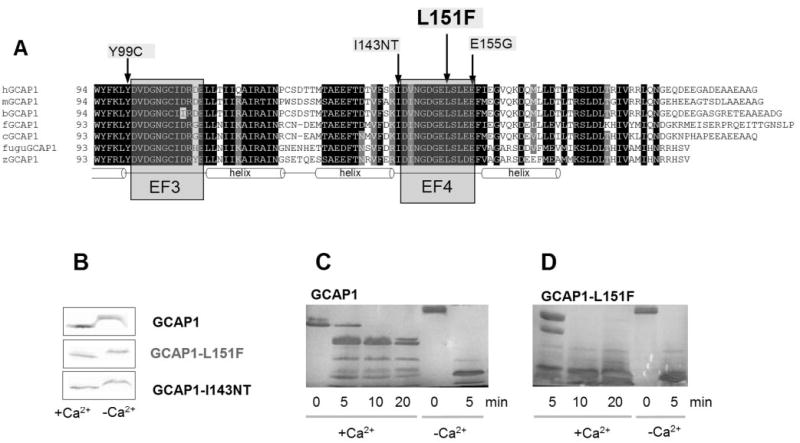
Location of the L151F missense mutation and biochemical data of GCAP1-L151F. (A) L151F is located in the Ca2+ -binding domain EF4. An amino acid sequence alignment of vertebrate GCAP1s encompassing EF3 and -4 (C-terminal half of the molecule) is shown. This part of the molecule contains the Ca2+ -binding sites EF3 and -4 which form helix-loop-helix structures. EF3 and -4 are relevant for converting the Ca2+ -bound GCAP1 inhibitor of photoreceptor GC into an activator (Ca2+ -free). Three disease-causing missense mutations (Y99C, I143NT, E155G in the human sequence) are located in this region (arrows). Conserved residues are printed on a black background. Residues conserved in six of seven sequences are printed a gray background. Prefix h, human; prefix m, mouse; prefix b, bovine; prefix f, frog (Rana pipiens); prefix c, chicken; prefix fugu, puffer fish (Fugu rubripes); prefix z, zebrafish (Danio rerio). (B) Ca2+ -dependent mobility shift of wild-type and mutant GCAP1 polypeptides. Immunoblotting of GCAP1, GCAP1-L151F, and GCAP1(I143NT) in the presence (+) or absence (−) of Ca2+. The antibody used was UW14. (C, D) Limited proteolysis of GCAP1 (C) and GCAP1-L151F (D) by trypsin. The digestions were performed at 30°C at a ratio of GCAP1/trypsin 300:1, and the digest was analyzed by SDS-PAGE at 0, 5, 10, and 20 minutes; +Ca2+ represents 2 μM [Ca2+] and −Ca2+ indicates 30 nM [Ca2+]. Note that after 10 minutes’ digestion, the high-molecular-weight components were nearly completely digested in GCAP1-L151F.
Ca2+-Dependent Conformational Changes in WT and Mutant GCAP1
Ca2+-binding proteins of the calmodulin supergene family show a characteristic Ca2+-dependent change in conformation. In its Ca2+-bound form (EF2 to -4 occupied by Ca2+), GCAP1 assumes a compact structure with a higher apparent mobility on gel electrophoresis. In its Ca2+-free form (presence of 1 mM EGTA), GCAP1 folds into a relaxed open structure with a lower apparent mobility. Affinity-purified recombinant GCAP1-L151F showed a Ca2+-shift very similar to wild-type and GCAP1-I143NT (Fig. 2B)22 when electrophoresed in high- and low-Ca2+ buffers. These results show that, at least at extreme Ca2+ buffer conditions (0 Ca2+ and 1 mM Ca2+), mutant and WT- GCAP1 behave indistinguishably.
We have noted37 that in the absence of Ca2+, the open conformation of GCAP1 is readily susceptible to proteolysis by trypsin. This is demonstrated in Figure 2C, where it is shown that exposure of GCAP1 in the absence of Ca2+ led to complete digestion after just 5 minutes (last two lanes). In the presence of 2 μM Ca2+, however, proteolysis was restricted because GCAP1 assumed a much more compact structure inaccessible to trypsin (Fig. 2C, left lanes). The compact core of GCAP1 remained intact, even at 20 minutes of digestion. In contrast, GCAP1-L151F at 2 μM Ca2+ is much more susceptible to proteolysis. These biochemical results illustrate that the GCAP1-L151F mutation prevents the protein from folding into a compact structure.
WT and Mutant GCAP1 Conformations Probed by Fluorescence
An increase of Ca2+ bound to GCAP1 causes a decrease in fluorescence intensity, with a minimum occurring at 200 to 300 nM [Ca2+]free. Further increases in Ca2+ levels reverse this trend and cause an increase in fluorescence intensity (Fig. 3A). These changes in the fluorescence correlate with a structural rearrangement of GCAP1 similarly to the Ca2+-shift experiment, and reflect the transition from an activator to an inhibitor of photoreceptor GC. GCAP1-L151F showed an incomplete reversal (Fig. 3B), suggesting a Ca2+-dependent structural rearrangement, perhaps a defect in Ca2+-binding at EF4 (caused by the L151F mutation).
Figure 3.
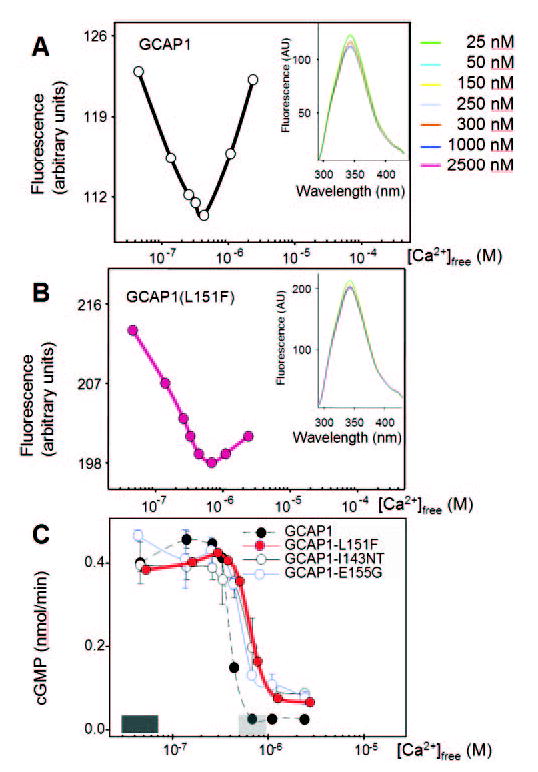
Ca2+-dependence of fluorescence emission and biological activity of wild-type GCAP1 and its mutants. Fluorescence emission of (A) WT-GCAP1 and (B) GCAP1-L151F as a function of Ca2+. Fluorescence was excited at λex = 290 nm, and emission was measured at λem = 343 nm. Insets: fluorescence emission spectra of GCAPs using excitation at 280 nm from 4.6 × 10⁻⁸ M to 2.4 × 10⁻⁶ M Ca2+. (C) Stimulation of GC activity in ROS membranes by normal and mutant GCAPs as a function of [Ca2+]. The dark shaded area above the x-axis indicates low [Ca2+]free expected in the light-adapted photoreceptors (~50 nM), the gray shaded area reflects high [Ca2+]free expected in the dark-adapted photoreceptors (500–700 nM). Ca2+ dependence of GCAP1-L151F is similar to that of GCAP1-I143NT and GCAP1-E155G, which also carry mutations in EF4.
Persistent Stimulation of ROS GC by GCAP1-L151F
We next compared the ability of GCAP1-L151F and WT-GCAP1 to stimulate GC1 in vitro (Fig. 3C). Both GCAPs, together with previously characterized mutants GCAP1-I143NT and GCAP1-E155G, were assayed for GC1 stimulation as a function of Ca2+. Due to previous analyses with EF3 mutations50,49 and EF4 mutations,22,23 we expected incomplete inactivation of GC1 at 700 nM Ca2+ levels found in dark-adapted photoreceptors. We found that GCAP1-L151F was active at low [Ca2+] (<200 nM) and remained active even at levels (~700 nM) that inhibit WT-GCAP1. This inhibition is physiologically relevant since it terminates production of cGMP by GC when Ca2+ levels have recovered to dark levels. The mutants GCAP1-E155G and GCAP1-I143NT exhibit similar activation–inactivation kinetics. Together, the findings indicate that mutations affecting EF4 and -3 partially impaired GC inhibition, leading to persistent stimulation in dark-adapted photoreceptors.
The Effect of the L151F Mutation on GCAP1 Structure
The N- and C-terminal domains of GCAP1 each contain pairs of EF hands that form a compact structure in the Ca2+-bound state. The arrangement of amino acids in EF1 is incompatible with Ca2+-binding,9 whereas EF2, -3, and -4 are known to each bind one Ca2+ ion, confirmed by numerous site-directed mutagenesis experiments.37,39,50,52–54 The mutant residue L151F is located in the β-sheet of the last EF hand domain, where it is in a position to influence nearby Ca2+-binding sites. L151F is a conservative replacement and it is not obvious why affinity for Ca2+ is affected. To identify potentially significant changes in protein folding and Ca2+-binding at the molecular level, and to reveal how this mutation affects the structure, we performed 1-ns MD simulations on WT and mutant GCAP1 based on the nuclear magnetic resonance (NMR) structure of GCAP2.43 MD allows prediction of molecule behavior through the use of classic mechanics. It numerically solves Newton’s equations of motion for an atomistic model of a polypeptide such as GCAP1 to obtain information about its time-dependent structural properties. We used two programs for MD simulations, Yasara and Namd2, and obtained nearly identical results. Yasara is a molecular-graphics, -modeling and -simulation package in which autostereoscopic displays are used to visualize predicted structures. Namd2, described by Kalé et al.,45 is specifically tailored to parallel computing platforms. This program uses spatial decomposition combined with force decomposition to enhance scalability. When predicted structures of GCAP1 and GCAP1-L151F were superimposed with their C-terminal EF-hand pair domains, greater changes occurred during simulation of the L151F mutant. Direct comparison between WT and L151F structures (Fig. 4A) revealed that there was a rotation of approximately 20° of the N-terminal EF-hand pair in relation to the C-terminal pair about a long axis of the molecule. However, hydrophobic interactions between interacting helices (Fig. 4A) were preserved. Furthermore, the mutated EF-hand domain was moved by approximately 0.1 nm (1 Å) along the β-sheet in relation to WT-GCAP1.
Figure 4.
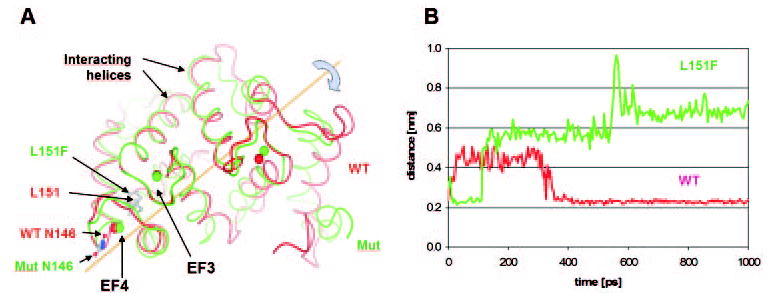
Molecular modeling of WT-GCAP1 and GCAP1-L151F with bound Ca2+. (A) Comparison of WT-GCAP1 and GCAP1-L151F structures after 1 nsec of molecular dynamics. Red: WT-GCAP1; green: GCAP1-L151F. The structures are superimposed at the third and fourth EF hand (EF3 and EF4, left). Arrows: residues L151 and F151. Calculated positions of Ca2+ ions in WT and mutant GCAP1 are depicted by red or green circles, respectively. (B) Distance between Ca2+ in mutant EF4 and Asn146 (side chain oxygen Oδ1 atom) during MDs. Red: WT-GCAP1; green: GCAP1-L151F. The preferred position of Asn146 in WT was close to bound Ca2+ (average distance 0.23 nm), although during the first 300 ps it separated from the Ca2+ ion by an average distance of 0.44 nm. In the GCAP1- L151F mutant, the initial distance of 0.23 nm increased shortly after 100 ps to 0.57 nm and after 600 ps to 0.68 nm.
In WT-GCAP1, five amino acids participate in the binding of Ca2+ in EF4: D144, N146, D148, E150, and E155. In the mutant structure, N146 was moved apart and D148 accommodated to form a stronger bond with Ca2+, using both acidic oxygen atoms. We calculated the distance between Ca2+ and Asn146 (side chain oxygen Oδ1 atom) in both mutant and WT structure during MD. Figure 4B shows that the preferred position of Asn146 in WT-GCAP1 was close to the bound Ca2+ (average distance 0.23 nm), although during the first 300 ps it was separated from the calcium ion with an average distance of 0.44 nm. This is contrary to the L151F mutant, where the initial distance of 0.23 nm increased shortly after 100 ps to 0.57 nm and after 600 ps to 0.68 nm. Fluctuations in this distant position are much greater than in proximity to the Ca2+ ion in WT-GCAP1. This finding is consistent with the weakening of Ca2+-binding to EF4, which is the molecular reason for persistent stimulation of GC1 at physiological Ca2+. These theoretical predictions are in excellent agreement with biochemical and fluorescence titration experiments described earlier.
DISCUSSION
Autosomal dominant cone–rod dystrophy is a heterogeneous disease caused by several diverse gene defects. At least 13 loci linked to cone–rod dystrophy are listed in RetNet (http://www.sph.uth.tmc.edu/RetNet/ provided in the public domain by the University of Texas Houston Health Science Center, Houston, TX), 6 of which show an autosomal dominant inheritance (Table 2). Two of these genes (GUCA1A and GUCY2D) encode GCAP1 and GC1, respectively, which are directly involved in synthesis of cGMP and phototransduction. Other CORD genes encode a transcription factor (CRX), a PDE chaperone (AIPL1), a structural protein (peripherin/RDS), a protein regulating synaptic exocytosis (RIMS1), or a protein with unknown function (HRG4). In the GCAP1 gene, three mutations (Y99C, E155G, and I143NT) have been linked to adCD, and one (P50L) has been suggested to cause a more severe form of retinal degeneration (adCORD). In GCAP-Y99C,21 a hydrophobic residue (Y) flanking the EF3 Ca2+-binding loop was replaced by a polar amino acid (Cys), thus distorting the EF3 motif.50,51 Transgenic mice expressing GCAP1-Y99C were recently generated,24 but displayed a dominant CORD phenotype rather than a CD, as observed in humans. In the GCAP1-E155G mutant,19 an acidic residue (E), 100% conserved in all EF hand motifs, was replaced in EF4 by a neutral residue, essentially disabling Ca2+-binding. Recently, the hydrophobic residue (Ile) flanking EF4 (I143) was found to be replaced by two polar residues (Asn, Thr) in another family with adCD, again distorting EF4 and altering Ca2+-binding (GCAP1-I143NT).22
Table 2.
Genes Linked to Autosomal Dominant CORD
| Gene | Locus | Protein | Mutation | Disease | Ref. |
|---|---|---|---|---|---|
| GUCA1A | 6p21.1 | GCAP1 (guanylate cyclase activating protein 1) | P50L | adCORD | 25 |
| Y99C | adCD | 21 | |||
| Y99C | adCORD in mouse model | 24 | |||
| E155G | adCD | 23 | |||
| I143NT | adCD | 22 | |||
| L151F | adCORD | This paper | |||
| RDS | 6p21.2 | Peripherin 2 | V200E | adCORD | 55 |
| RIMS1 | 6q13 | Regulating of synaptic membrane exocytosis protein 1 or rab3A-interacting molecule | R844H | adCORD | 56 |
| AIPL1 | 17p13.2 | AIPL1 (arylhydrocarbon-interacting receptor protein-like 1) | P351Δ12 | adCORD | 57 |
| GUCY2D | 17p13.1 | Guanylate cyclase 1 (GC-E in mouse) | R838C
E837D T839M |
adCORD | 29, 58 |
| UNC119 | 17q11.2 | HRG4 human homolog of C. elegans unc119 protein | L57ter | adCORD | 59 |
| CRX | 19q13.32 | Cone–rod otx-like photoreceptor homeobox transcription factor | E60A
A196 +1 Arg41Trp |
adCORD | 60 |
The seven CORD genes that were identified and cloned are listed. Only mutations leading to autosomal dominant CORD phenotype are shown. The list of mutations is not comprehensive; additional mutations may exist.
In contrast to these EF-hand mutations, recombinant GCAP1-P50L does not influence the Ca2+ sensitivity of GC1 in vitro,61 which is consistent with the location of P50 in the N-terminal half between EF1 and -2. However, GCAP1-P50L shows a marked increase in susceptibility to protease degradation and a reduction in thermal stability, as observed by CD spectroscopy.25 Its lower stability could reduce its cellular concentration, as has been observed for GCAP1 in GC1−/− animals.32,62 Reduction of GCAP1 levels, however, should have no impact on the survival of retinas, since GCAP1+/− and GCAP1−/− mice have morphologically normal retinas. Either GCAP1-P50L causes adCORD by an entirely different mechanism involving an unknown dominant negative effect of partially degraded mutant GCAP1-P50L, or the mutation represents a nonpathogenic rare polymorphism.
We describe an adCORD phenotype based on a conservative substitution of a hydrophobic residue (L151), located in the Ca2+-binding loop of EF4, by another hydrophobic residue (F), which is not much bulkier than L. This is surprising, and for this reason we investigated the consequences of this mutation rigorously by biochemical, biophysical, and molecular modeling techniques. The pathogenic properties of the GCAP1-L151F mutations described in this article are supported by several independent observations. First, the mutation decreases the Ca2+ sensitivity of GC stimulation, an effect also seen in Y99C, E155G, and I143NT mutations.22 The change in sensitivity leads to persistent stimulation of GC1 at high “dark” Ca2+ and to disease due to gain of function. Second, recombinant GCAP1-L151F is susceptible to proteolysis, because it is unable to assume a compact Ca2+-bound conformation essential for inactivity at dark Ca2+ (Fig. 2D). Third, MDs of WT-GCAP1 and L151F-GCAP1 confirmed that a significant change in the structure of mutant GCAP1 influences the binding of Ca2+ in EF4 and EF2 (Fig. 4). Although residue 151 in EF4 is forming a β-sheet with EF3, no hydrogen bond is broken after mutation and during the entire simulation. Fourth, the L151F mutations have been independently identified in a large Utah pedigree with dominant cone dystrophy.63 The reason for the discrepancy in phenotype (adCD versus adCORD) is unclear, but anomalies in the rod response may be slow in developing and may depend on the genetic background.
In summary, all GCAP1 mutations identified so far and linked to retinal disease (Y99C, E155G, I143NT) are inherited in a dominant fashion, and affect Ca2+ coordination and Ca2+ sensitivity (exception P50L, which may be a rare polymorphism). The EF hand mutants display a gain of function at physiological high (dark) [Ca2+], at which WT-GCAP1 normally would be inactive. The gain of function consists of persistent stimulation of photoreceptor guanylate cyclase leading to elevated levels of cGMP in the cytoplasm of rod and cone outer segments. It is not surprising that GCAP1 mutants disrupting the interface between GCAP1 and guanylate cyclase associated with retina disease have not been identified, since mice lacking GCAP1 and -2 display no measurable retina degeneration.32,34 It is currently not understood why some mutations (E155G, Y99C) lead to adCD, whereas L151F causes a more severe adCORD phenotype. This may depend on the degree of stimulation in the dark-adapted photoreceptors, and the level of cytoplasmic cGMP that is established in the dark. Higher levels would be considered more cytotoxic, but not quite as high levels as are thought to lead to milder phenotypes. Transgenic mice expressing mutant GCAPs and mimicking the human disease may be useful in answering these questions.
Footnotes
Supported by National Eye Institute Grants EY09339 (KP), EY08123 (WB); a grant from Research to Prevent Blindness (RPB) to the Departments of Ophthalmology at the University of Washington and the University of Utah; a grant from the Macular Vision Research Foundation (WB); a Center grant of the Foundation Fighting Blindness (Owings Mills, MD) to the University of Utah; and a grant from the E. K. Bishop Foundation (KP). EMS is an investigator at the Howard Hughes Medical Institute.
Modeling was partly done at the ICM Computer Centre, Warsaw University, Warsaw, Poland.
Disclosure: I. Sokal, None; W.J. Dupps, None; M.A. Grassi, None; J. Brown, Jr, None; L.M. Affatigato, None; N. Roychowdhury, None; L. Yang, None; S. Filipek, None; K. Palczewski, None; E.M. Stone, None; W. Baehr, None
References
- 1.Lucas KA, Pitari GM, Kazerounian S, et al. Guanylyl cyclases and signaling by cyclic GMP. Pharmacol Rev. 2000;52:375–414. [PubMed] [Google Scholar]
- 2.Jindrova H. Vertebrate phototransduction: activation, recovery, and adaptation. Physiol Res. 1998;47:155–168. [PubMed] [Google Scholar]
- 3.Burns ME, Mendez A, Chen J, Baylor DA. Dynamics of cyclic GMP synthesis in retinal rods. Neuron. 2002;36:81–91. doi: 10.1016/s0896-6273(02)00911-x. [DOI] [PubMed] [Google Scholar]
- 4.Krizaj D, Copenhagen DR. Calcium regulation in photoreceptors. Front Biosci. 2002;7:D2023–D2044. doi: 10.2741/a896. [DOI] [PMC free article] [PubMed] [Google Scholar]
- 5.Baehr W, Palczewski K. Photoreceptors and Calcium. New York: Kluwer Academic/Plenum Publishers/Landes Bioscience/Eurekah.com; 2002.
- 6.Koutalos Y, Yau KW. Regulation of sensitivity in vertebrate rod photoreceptors by calcium. Trends Neurosci. 1996;19:73–81. doi: 10.1016/0166-2236(96)89624-x. [DOI] [PubMed] [Google Scholar]
- 7.Palczewski K, Polans AS, Baehr W, Ames JB. Calcium binding proteins in the retina: structure, function, and the etiology of human visual diseases. Bioessays. 2000;22:337–350. doi: 10.1002/(SICI)1521-1878(200004)22:4<337::AID-BIES4>3.0.CO;2-Z. [DOI] [PubMed] [Google Scholar]
- 8.Polans A, Baehr W, Palczewski K. Turned on by Ca2+! The physiology and pathology of Ca2+ binding proteins in the retina. Trends Neurosci. 1996;19:547–554. doi: 10.1016/s0166-2236(96)10059-x. [DOI] [PubMed] [Google Scholar]
- 9.Palczewski K, Subbaraya I, Gorczyca WA, et al. Molecular cloning and characterization of retinal photoreceptor guanylyl cyclase activating protein (GCAP) Neuron. 1994;13:395–404. doi: 10.1016/0896-6273(94)90355-7. [DOI] [PubMed] [Google Scholar]
- 10.Gorczyca WA, Gray-Keller MP, Detwiler PB, Palczewski K. Purification and physiological evaluation of a guanylate cyclase activating protein from retinal rods. Proc Natl Acad Sci USA. 1994;91:4014–4018. doi: 10.1073/pnas.91.9.4014. [DOI] [PMC free article] [PubMed] [Google Scholar]
- 11.Shyjan AW, de Sauvage FJ, Gillett NA, Goeddel DV, Lowe DG. Molecular cloning of a retina-specific membrane guanylyl cyclase. Neuron. 1992;9:727–737. doi: 10.1016/0896-6273(92)90035-c. [DOI] [PubMed] [Google Scholar]
- 12.Lowe DG, Dizhoor AM, Liu K, et al. Cloning and expression of a second photoreceptor-specific membrane retina guanylyl cyclase (RetGC), RetGC-2. Proc Natl Acad Sci USA. 1995;92:5535–5539. doi: 10.1073/pnas.92.12.5535. [DOI] [PMC free article] [PubMed] [Google Scholar]
- 13.Subbaraya I, Ruiz CC, Helekar BS, et al. Molecular characterization of human and mouse photoreceptor guanylate cyclase activating protein (GCAP) and chromosomal localization of the human gene. J Biol Chem. 1994;269:31080–31089. [PubMed] [Google Scholar]
- 14.Haeseleer F, Sokal I, Li N, et al. Molecular characterization of a third member of the guanylyl cyclase-activating protein subfamily. J Biol Chem. 1999;274:6526–6535. doi: 10.1074/jbc.274.10.6526. [DOI] [PubMed] [Google Scholar]
- 15.Dizhoor AM, Olshevskaya EV, Henzel WJ, et al. Cloning, sequencing, and expression of a 24-kDa Ca2+-binding protein activating photoreceptor guanylyl cyclase. J Biol Chem. 1995;270:25200–25206. doi: 10.1074/jbc.270.42.25200. [DOI] [PubMed] [Google Scholar]
- 16.Yang R-B, Foster DC, Garbers DL, Fülle H-J. Two membrane forms of guanylyl cyclase found in the eye. Proc Natl Acad Sci USA. 1995;92:602–606. doi: 10.1073/pnas.92.2.602. [DOI] [PMC free article] [PubMed] [Google Scholar]
- 17.Perrault I, Rozet JM, Gerber S, et al. Spectrum of retGC1 mutations in Leber’s congenital amaurosis. Eur J Hum Genet. 2000;8:578–582. doi: 10.1038/sj.ejhg.5200503. [DOI] [PubMed] [Google Scholar]
- 18.Perrault I, Rozet J-M, Calvas P, et al. Retinal-specific guanylate cyclase gene mutations in Leber’s congenital amaurosis. Nat Genet. 1996;14:461–464. doi: 10.1038/ng1296-461. [DOI] [PubMed] [Google Scholar]
- 19.Wilkie SE, Newbold RJ, Deery E, et al. Functional characterization of missense mutations at codon 838 in retinal guanylate cyclase correlates with disease severity in patients with autosomal dominant cone-rod dystrophy. Hum Mol Genet. 2000;9:3065–3073. doi: 10.1093/hmg/9.20.3065. [DOI] [PubMed] [Google Scholar]
- 20.Surguchov A, Bronson JD, Banerjee P, et al. The human GCAP1 and GCAP2 genes are arranged in a tail-to-tail array on the short arm of chromosome 6 (p21.1) Genomics. 1997;39:312–322. doi: 10.1006/geno.1996.4513. [DOI] [PubMed] [Google Scholar]
- 21.Payne AM, Downes SM, Bessant DA, et al. A mutation in guanylate cyclase activator 1A (GUCA1A) in an autosomal dominant cone dystrophy pedigree mapping to a new locus on chromosome 6p21.1. Hum Mol Genet. 1998;7:273–277. doi: 10.1093/hmg/7.2.273. [DOI] [PubMed] [Google Scholar]
- 22.Nishiguchi KM, Sokal I, Yang L, et al. A novel mutation (I143NT) in guanylate cyclase-activating protein 1 (GCAP1) associated with autosomal dominant cone degeneration. Invest Ophthalmol Vis Sci. 2004;45:3863–3870. doi: 10.1167/iovs.04-0590. [DOI] [PMC free article] [PubMed] [Google Scholar]
- 23.Wilkie SE, Li Y, Deery EC, et al. Identification and functional consequences of a new mutation (E155G) in GCAP1 causing autosomal dominant cone dystrophy. Am J Hum Genet. 2001;69:471–480. doi: 10.1086/323265. [DOI] [PMC free article] [PubMed] [Google Scholar]
- 24.Olshevskaya EV, Calvert PD, Woodruff ML, et al. The Y99C mutation in guanylyl cyclase-activating protein 1 increases intracellular Ca2+ and causes photoreceptor degeneration in transgenic mice. J Neurosci. 2004;24:6078–6085. doi: 10.1523/JNEUROSCI.0963-04.2004. [DOI] [PMC free article] [PubMed] [Google Scholar]
- 25.Newbold RJ, Deery EC, Walker CE, et al. The destabilization of human GCAP1 by a proline to leucine mutation might cause cone-rod dystrophy. Hum Mol Genet. 2001;10:47–54. doi: 10.1093/hmg/10.1.47. [DOI] [PubMed] [Google Scholar]
- 26.Downes SM, Holder GE, Fitzke FW, et al. Autosomal dominant cone and cone-rod dystrophy with mutations in the guanylate cyclase activator 1A gene-encoding guanylate cyclase activating protein-1. Arch Ophthalmol. 2001;119:96–105. [PubMed] [Google Scholar]
- 27.Payne AM, Downes SM, Bessant DA, et al. Genetic analysis of the guanylate cyclase activator 1B (GUCA1B) gene in patients with autosomal dominant retinal dystrophies. J Med Genet. 1999;36:691–693. [PMC free article] [PubMed] [Google Scholar]
- 28.Sato M, Nakazawa M, Usui T, Tanimoto N, Abe H, Ohguro H. Mutations in the gene coding for guanylate cyclase-activating protein 2 (GUCA1B gene) in patients with autosomal dominant retinal dystrophies. Graefes Arch Clin Exp Ophthalmol In press. [DOI] [PubMed]
- 29.Perrault I, Rozet JM, Gerber S, et al. A retGC-1 mutation in autosomal dominant cone-rod dystrophy. Am J Hum Genet. 1998;63:651–654. doi: 10.1086/301985. [DOI] [PMC free article] [PubMed] [Google Scholar]
- 30.Yang RB, Robinson SW, Xiong WH, Yau KW, Birch DG, Garbers DL. Disruption of a retinal guanylyl cyclase gene leads to cone-specific dystrophy and paradoxical rod behavior. J Neurosci. 1999;19:5889–5897. doi: 10.1523/JNEUROSCI.19-14-05889.1999. [DOI] [PMC free article] [PubMed] [Google Scholar]
- 31.Semple-Rowland SL, Lee NR, Van-Hooser JP, Palczewski K, Baehr W. A null mutation in the photoreceptor guanylate cyclase gene causes the retinal degeneration chicken phenotype. Proc Natl Acad Sci USA. 1998;95:1271–1276. doi: 10.1073/pnas.95.3.1271. [DOI] [PMC free article] [PubMed] [Google Scholar]
- 32.Mendez A, Burns ME, Sokal I, et al. Role of guanylate cyclase-activating proteins (GCAPs) in setting the flash sensitivity of rod photoreceptors. Proc Natl Acad Sci USA. 2001;98:9948–9953. doi: 10.1073/pnas.171308998. [DOI] [PMC free article] [PubMed] [Google Scholar]
- 33.Pennesi ME, Howes KA, Baehr W, Wu SM. GCAP1 rescues normal cone photoreceptor responses in GCAP1/GCAP2 knockout mice. Proc Natl Acad Sci USA. 2003;100:6783–6788. doi: 10.1073/pnas.1130102100. [DOI] [PMC free article] [PubMed] [Google Scholar]
- 34.Howes KA, Pennesi ME, Sokal I, et al. GCAP1 rescues rod photo-receptor response in GCAP1/GCAP2 knockout mice. EMBO J. 2002;21:1545–1554. doi: 10.1093/emboj/21.7.1545. [DOI] [PMC free article] [PubMed] [Google Scholar]
- 35.Sokal I, Alekseev A, Baehr W, Haeseleer F, Palczewski K. Soluble fusion proteins between single transmembrane photoreceptor guanylyl cyclases and their activators. Biochemistry. 2002;41:251–257. doi: 10.1021/bi015606u. [DOI] [PMC free article] [PubMed] [Google Scholar]
- 36.Gorczyca WA, Polans AS, Surgucheva I, Subbaraya I, Baehr W, Palczewski K. Guanylyl cyclase activating protein: a calcium-sensitive regulator of phototransduction. J Biol Chem. 1995;270:22029–22036. doi: 10.1074/jbc.270.37.22029. [DOI] [PubMed] [Google Scholar]
- 37.Rudnicka-Nawrot M, Surgucheva I, Hulmes JD, et al. Changes in biological activity and folding of guanylate cyclase-activating protein 1 as a function of calcium. Biochemistry. 1998;37:248–257. doi: 10.1021/bi972306x. [DOI] [PubMed] [Google Scholar]
- 38.Papermaster DS. Preparation of retinal rod outer segments. Methods Enzymol. 1982;81:48–52. doi: 10.1016/s0076-6879(82)81010-0. [DOI] [PubMed] [Google Scholar]
- 39.Otto-Bruc A, Buczylko J, Surgucheva I, et al. Functional reconstitution of photoreceptor guanylate cyclase with native and mutant forms of guanylate cyclase activating protein 1. Biochemistry. 1997;36:4295–4302. doi: 10.1021/bi963000d. [DOI] [PubMed] [Google Scholar]
- 40.Schoenmakers TJ, Visser GJ, Flik G, Theuvenet AP. CHELATOR: an improved method for computing metal ion concentrations in physiological solutions. Bio/Tech. 1992;12:870–879. [PubMed] [Google Scholar]
- 41.Sali A, Potterton L, Yuan F, van VH, Karplus M. Evaluation of comparative protein modeling by MODELLER. Proteins. 1995;23:318–326. doi: 10.1002/prot.340230306. [DOI] [PubMed] [Google Scholar]
- 42.Berman HM, Westbrook J, Feng Z, et al. The Protein Data Bank. Nucleic Acids Res. 2000;23:235–242. doi: 10.1093/nar/28.1.235. [DOI] [PMC free article] [PubMed] [Google Scholar]
- 43.Ames JB, Dizhoor AM, Ikura M, Palczewski K, Stryer L. Three-dimensional structure of guanylyl cyclase activating protein-2, a calcium-sensitive modulator of photoreceptor guanylyl cyclases. J Biol Chem. 1999;274:19329–19337. doi: 10.1074/jbc.274.27.19329. [DOI] [PubMed] [Google Scholar]
- 44.Bowie JU, Luthy R, Eisenberg D. A method to identify protein sequences that fold into a known three-dimensional structure. Science. 1991;253:164–170. doi: 10.1126/science.1853201. [DOI] [PubMed] [Google Scholar]
- 45.Kale L, Skeel R, Bhandarkar M, et al. NAMD2: Greater scalability for parallel molecular dynamics. J Comput Phys. 1993;151:283–312. [Google Scholar]
- 46.Darden T, York D, Pedersen L. An N log(N) method for Ewald sums in large systems. J Chem Phys. 1993;98:10089–10092. [Google Scholar]
- 47.Kawasaki H, Nakayama S, Kretsinger RH. Classification and evolution of EF-hand proteins. Biometals. 1998;11:277–295. doi: 10.1023/a:1009282307967. [DOI] [PubMed] [Google Scholar]
- 48.Haeseleer F, Imanishi Y, Sokal I, Filipek S, Palczewski K. Calcium-binding proteins: intracellular sensors from the calmodulin superfamily. Biochem Biophys Res Commun. 2002;290:615–623. doi: 10.1006/bbrc.2001.6228. [DOI] [PubMed] [Google Scholar]
- 49.Falke JJ, Drake SK, Hazard AL, Peerson OB. Molecular tuning of ion binding to calcium signaling proteins. Q Rev Biophys. 1994;27:219–290. doi: 10.1017/s0033583500003012. [DOI] [PubMed] [Google Scholar]
- 50.Sokal I, Li N, Surgucheva I, et al. GCAP1(Y99C) mutant is constitutively active in autosomal dominant cone dystrophy. Mol Cell. 1998;2:129–133. doi: 10.1016/s1097-2765(00)80121-5. [DOI] [PubMed] [Google Scholar]
- 51.Dizhoor AM, Boikov SG, Olshevskaya E. Constitutive activation of photoreceptor guanylate cyclase by Y99C mutant of GCAP-1. J Biol Chem. 1998;273:17311–17314. doi: 10.1074/jbc.273.28.17311. [DOI] [PubMed] [Google Scholar]
- 52.Li N, Sokal I, Bronson JD, Palczewski K, Baehr W. Identification and functional regions of guanylate cyclase-activating protein 1 (GCAP1) using GCAP1/GCIP chimeras. Biol Chem. 2001;382:1179–1188. doi: 10.1515/BC.2001.148. [DOI] [PubMed] [Google Scholar]
- 53.Sokal I, Li N, Klug CS, et al. Calcium-sensitive regions of GCAP1 as observed by chemical modifications, fluorescence and EPR spectroscopies. J Biol Chem. 2001;276:43361–43373. doi: 10.1074/jbc.M103614200. [DOI] [PMC free article] [PubMed] [Google Scholar]
- 54.Sokal I, Otto-Bruc AE, Surgucheva I, et al. Conformational changes in guanylyl cyclase-activating protein 1 (GCAP1) and its tryptophan mutants as a function of calcium concentration. J Biol Chem. 1999;274:19829–19837. doi: 10.1074/jbc.274.28.19829. [DOI] [PubMed] [Google Scholar]
- 55.Nakazawa M, Naoi N, Wada Y, et al. Autosomal dominant cone-rod dystrophy associated with a Val200Glu mutation of the peripherin/RDS gene. Retina. 1996;16:405–410. doi: 10.1097/00006982-199616050-00007. [DOI] [PubMed] [Google Scholar]
- 56.Johnson S, Halford S, Morris AG, et al. Genomic organisation and alternative splicing of human RIM1, a gene implicated in autosomal dominant cone-rod dystrophy (CORD7) Genomics. 2003;81:304–314. doi: 10.1016/s0888-7543(03)00010-7. [DOI] [PubMed] [Google Scholar]
- 57.Sohocki MM, Perrault I, Leroy BP, et al. Prevalence of AIPL1 mutations in inherited retinal degenerative disease. Mol Genet Metab. 2000;70:142–150. doi: 10.1006/mgme.2000.3001. [DOI] [PubMed] [Google Scholar]
- 58.Tucker CL, Woodcock SC, Kelsell RE, Ramamurthy V, Hunt DM, Hurley JB. Biochemical analysis of a dimerization domain mutation in RetGC-1 associated with dominant cone-rod dystrophy. Proc Natl Acad Sci USA. 1999;96:9039–9044. doi: 10.1073/pnas.96.16.9039. [DOI] [PMC free article] [PubMed] [Google Scholar]
- 59.Kobayashi A, Higashide T, Hamasaki D, Kubota S, Sakuma H, An W, et al. HRG4 (UNC119) mutation found in cone-rod dystrophy causes retinal degeneration in a transgenic model. Invest Ophthalmol Vis Sci. 2000;41:3268–3277. [PubMed] [Google Scholar]
- 60.Sohocki MM, Sullivan LS, Mintz-Hittner HA, et al. A range of clinical phenotypes associated with mutations in CRX, a photoreceptor transcription-factor gene. Am J Hum Genet. 1998;63:1307–1315. doi: 10.1086/302101. [DOI] [PMC free article] [PubMed] [Google Scholar]
- 61.Sokal I, Li N, Verlinde CL, Haeseleer F, Baehr W, Palczewski K. Calcium-binding proteins in the retina: from discovery to etiology of human disease. Biochim Biophys Acta. 2000;1498:233–251. doi: 10.1016/s0167-4889(00)00099-9. [DOI] [PubMed] [Google Scholar]
- 62.Coleman JE, Zhang Y, Brown GA, Semple-Rowland SL. Cone cell survival and downregulation of GCAP1 protein in the retinas of GC1 knockout mice. Invest Ophthalmol Vis Sci. 2004;45:3397–3403. doi: 10.1167/iovs.04-0392. [DOI] [PubMed] [Google Scholar]
- 63.Jiang L, Katz BJ, Yang Z, et al. Autosomal dominant cone dystrophy caused by a novel mutation in GUCA1A. Mol Vis In press. [PubMed]