

Abstract
The mechanisms causing AIDS and subsequently death in human immunodeficiency virus type 1 infection are not yet fully understood. Nonetheless, correlates of accelerated progression to disease based on immunological and virological markers have been identified. The best correlate identified to date is the baseline virus load or the so-called viral set point. By focusing on a virus load measurement from a restricted time range, however, we ignore valuable information contained in the long-term profile of the virus load. Here, we investigate the relationship between virus load and survival with the aid of a statistical model. The model takes into consideration the virus load at every stage of the disease. In particular, we aim to determine the effect of peaks of virus load on disease progression. We fit our model to unique sequential viral load data of 12 simian immunodeficiency virus mac251-infected rhesus macaques which contain frequent measurements throughout the entire course of the infection until the development of simian AIDS. Our model enables us to predict the survival times of the animals more accurately than an equivalent model which considers the viral set point only. Furthermore, we find that peaks of the virus load contribute less to disease progression than phases of low virus load with the same amount of viral turnover. Our analysis implies that the total viral turnover is not the best correlate of survival. As a consequence, the direct cytopathic effects of virus replication may, by themselves, have less of an impact on disease progression than previously thought.
Although our insight into the molecular basis and the short-term dynamics of human immunodeficiency virus (HIV) infection increases continuously, the cause of progression to disease and death remains poorly understood. However, immunological and virological markers for accelerated disease progression exist, such as low CD4+ T-cell count (21), low T-cell responsiveness (25), chronic immune activation (14), or the emergence of syncytium-inducing variants (3, 6, 27). Currently, one of the best markers of fast disease progression is a high viral set point, defined as the baseline virus load shortly after acute infection (18). The practical value of the viral set point for prognosis is difficult to surpass since it requires only a single viral load measurement early in the infection. Nevertheless, the viral load during any stage of infection may contain important information regarding the interaction between the virus and its host and thus may offer insight into pathogenesis.
With the aid of a statistical model which takes into account the viral load during the entire course of the infection, we analyzed the relation between viral load and pathogenesis. In particular, we studied how much short phases with high viral load harm the host relative to long phases with low viral load. The statistical model was applied to a comprehensive data set which contains frequent measurements of the viral load in simian immunodeficiency virus (SIV) mac251-infected rhesus macaques throughout the entire primary infection and chronic phase until the development of simian AIDS. The advantages of an animal model for our purposes are the possibility to control for the virus isolate and the timing, amount, and route of virus inoculation, as well as the ability to monitor the hosts frequently. The results of our analysis are compared with the standard correlation between viral set point and survival.
Data.
Twelve rhesus macaques were inoculated with 1 ml of propagated SIVmac251. This dose corresponded to approximately 10 50% animal infectious doses. Six of the animals were immunized with diphtheria-pertussis-tetanus vaccine three times prior to infection. The observed survival times ranged from 81 to 630 days. The level of SIV RNA in plasma was measured every second day from day 4 to day 21 postinfection and weekly thereafter. For a detailed description of the virus stocks, animals, infection, criteria for euthanasia, specimen collection, and plasma SIV RNA assays, we refer to reference 26.
Statistical model.
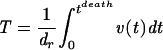
The total viral turnover, T, over the entire course of infection is proportional to the area under the virus load curve which is given by the integral of the viral load, v, from the time of infection to death, divided by the duration of a complete replication cycle of the virus, dr:
 |
To determine how much peaks of virus load contribute to progression to death, we expand the above expression for the total viral turnover to the following model, which relates the virus load of the jth host, vj, to the time of its death, tjdeath:
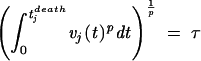 |
This model (model 1) assumes that there is a tolerance threshold, τ, which is universal in the sense that it measures the tolerance of all host individuals, disregarding between-host variation of tolerance with respect to SIV infection. The left-hand side contains the integral over the viral load weighted with a factor which depends on the level of virus load, v, itself, as can be seen after rewriting the left-hand side of equation 1:
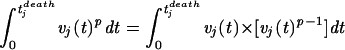 |
The parameter p determines the relative importance of peaks. For p > 1, high peaks contribute overproportionally, whereas for p < 1, high peaks contribute underproportionately. To illustrate the interpretation of the parameter p, we visualize the two extreme relations between the time of death and the virus load progression given by model 1 with p = 0 and p = ∞, and the intermediate alternative with p = 1 in Fig. 1. For p = 1 the model states that the host dies after a certain number of viral particles have been produced. This case corresponds to the view that the total viral turnover determines disease progression. A very large value of p describes a scenario in which the host is killed when the virus load attains a threshold level (a relation between pathogen concentration and host mortality which is assumed, for example, in reference 1). A value of p smaller than 1 describes a scenario in which the continuous viral burden harms the animal disproportionately more than a short and high peak.
FIG. 1.

Interpretation of model 1 for p = 0, p = 1, and p = ∞. For each case we show two hypothetical virus load progressions and the resulting times of death.
How important are peaks?
We fitted model 1 simultaneously to all 12 animals to obtain the best estimate for p. The fitting procedure formally amounts to a multiple regression of tdeath on the virus load measurements, v(t), according to the implicit relation given in model 1. It is schematically given in Fig. 2 and described in detail in the Appendix (under “The fitting procedure”). The value of p which leads to the most accurate prediction of the time of death of the animals (pbest) is 0.23. For this value model 1 explains 44% of the variation in survival times of the animals. Bootstrapping (4, 5) allows the estimation of the 95% confidence interval as 0.19 to 0.51. [For the best fit, τp can be determined as 10 × 103 (copies/ml)p days, with a 95% confidence interval of 0.59 × 10³ to 53 × 103 (copies/ml)p days.] Further analysis (not shown here) suggests that there is no significant difference in the estimates of the parameter p for animals with an early peak compared with animals with a late peak in virus load. This indicates that the timing of peaks is not a factor which significantly influences disease progression. However, low sample numbers limit the statistical power of this argument. Moreover, because it is unlikely that one measures the virus load exactly at its peak, the peak level is usually underestimated in virus load data. We studied whether this systematic underestimation of the peak levels of the virus load would affect our estimate for the parameter p. Simulations based on our data set with artificially augmented peak levels (augmented by up to a factor of 10) suggest that the estimates for the parameter p do not change significantly as a result of an underestimation of viral peaks.
FIG. 2.

The fitting procedure of model 1.
The fact that pbest is significantly lower than 1 (P ≪ 0.01 by bootstrapping) implies that, in the range of observed virus loads, a short period of high virus load contributes much less to disease progression than a long phase of low virus load with an equal amount of viral turnover. This suggests that it is not the total amount of viral turnover or the actual level of virus load but rather the continuous presence of virus which causes harm in the hosts. Note that this does not imply that peaks do not contribute to disease progression at all. Rather, it states that the contribution of peaks is less than what the amount of viral turnover during the peak phase suggests. Continuously high virus load will still lead to increased mortality. The main result of this analysis is that the total viral turnover is not the best correlate of survival. Figure 3 illustrates this result by comparing the viral load in animal 21289 with the viral load scaled by the exponent p, which is effectively “felt” by the host.
FIG. 3.

Virus load in and as felt by host 21289 according to our analysis.
Comparison with set point hypothesis.
To compare the predictions of model 1 with the prediction we would obtain by considering the viral set point only, we have formulated a model, model 2, which is formally equivalent to model 1:
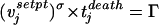 |
(2) |
Here, vjsetpt denotes the viral set point of the jth animal and is calculated as the average of the level of SIV RNA in plasma between days 36 and 99. The parameters σ and Γ correspond to the parameters p and τ in model 1, respectively. We have used the same fitting procedure as for model 1, which here amounts to a nonlinear regression of tjdeath on the viral set point, vjsetpt, according to model 2. The best fit is given for a σ of 0.18. Bootstrapping allowed the estimation of a 95% confidence interval of −0.41 to 0.31. This implies that the regression is not significant. Γ can be determined as 4.1 × 10³ (copies/ml)σ days with a 95% confidence interval [of 0.27 × 10³ to 27 × 103 (copies/ml)σ days]. Whereas model 1 explains 44% of the variation of the survival times, the analogous model 2, which relates the viral set point and the survival times, explains only 15% of the variation (see Appendix [“Goodness of fit”]). An F test yields the result that this is a nonsignificant fraction of explained variation, in agreement with the result obtained by bootstrapping.
Note that Cox proportional-hazard models, which are commonly used for the analysis of the correlation between the viral set point and survival probability, have a higher statistical power than model 2. Thus, it is not surprising that, using a Cox proportional-hazard model, Staprans et al. found a significant correlation between viral set point and survival probability based on the same data (26). However, the downside of a Cox proportional-hazard analysis is that is does not allow the quantification of the fraction of explained variation which is necessary to determine the goodness of fit. We chose model 2 to be able to compare the goodness of fit of model 1 to the goodness of an analogous model which uses the viral set point only.
Discussion.
In this study, we propose a statistical model for the relation between virus load in plasma and survival of infected hosts. The model takes into account the virus load in plasma throughout the entire course of infection, including the primary peak virus load, and does not restrict itself to the viral set point only. In particular, the model enables us to quantify how much peaks in virus load contribute to progression towards death.
Fitting our model to virus load data of 12 SIV-infected rhesus macaques, we obtain better predictions of the survival times of the animals than can be achieved by considering the set point only. Our model explains 44% of the observed variation in survival times whereas an analogous model which regresses the survival times on the set point explains only 15% of the variation. This finding suggests that the virus load measurements at every time point during infection contain valuable information about pathogenesis and that our statistical model represents a method for extracting this information. Furthermore, the fitted parameter p gives insight into the importance of peaks in the virus load for the progression towards death. The best fit was obtained with a pbest of 0.23, which is significantly lower than 1. This suggests that peaks in the virus load contribute less to the progression towards death than longer phases of lower virus load with the same overall virus turnover as during the peak. Moreover, the timing of peaks does not appear to correlate with disease progression. Thus, the total viral turnover does not fully account for viral pathogenesis—a conclusion which cannot be drawn from approaches which consider the set point only. We emphasize that we do not question the practical value of the viral set point for prognosis. Clearly, our approach is of limited value for prognosis since it is based on frequent measurements of the virus load throughout the entire course of infection. The aim of our study is rather to enhance the understanding of how the virus load contributes to the pathogenesis of HIV or SIV infection.
Our finding that peaks contribute underproportionally to disease progression suggests that it is neither simply a certain level of virus load nor a certain amount of total virus turnover which causes the death of the animals. It is rather the continuous presence of the virus in the host which leads to disease. At first sight, this finding seems to imply that pathogenesis in SIV infection cannot be the direct result of depletion of infected CD4+ T cells, be it due to viral cytopathicity or due to immune-mediated clearance of infected cells. Thus, our finding appears to be in conflict with models of pathogenesis such as the “tap and drain model” (12) or the immunopathological hypothesis (28), since a narrow interpretation of these models of pathogenesis predicts a direct proportionality between viral turnover and survival time of the host, which we and others (2) do not find. However, these conclusions rest on several critical assumptions. First, we assume that the viral load measurements in the blood adequately reflect the total viral burden of the host. Second, we assume that the number of infected CD4+ T cells is proportional to the viral load measured, which allows us to relate the viral turnover to the amount of CD4+ cell depletion in the host. Finally, we assume that the lymphocyte regenerative capacity of a host individual is limited, because only then do we expect a correlation between CD4+ cell depletion and total turnover. The finding that the time of death is not determined by the total viral turnover suggests more “indirect causes” of pathogenesis. These indirect causes could include apoptosis of uninfected CD4+ and CD8+ T cells as a reflection of the chronic state of immune activation or suppression of the immune regenerative capacity associated with compromised bone marrow and thymic and peripheral lymphocyte production (8, 11). All of these phenomena contribute to either increased rates of CD4+ T-cell destruction or decreased rates of CD4+ T-cell production, which are less directly dependent on the total viral turnover.
Our result that levels of virus replication alone cannot account for the progression of SIV disease is compatible with results of studies of HIV-infected individuals by Liu et al. (16) and Giorgi et al. (7). Their interesting studies found that the level of CD8+ T-cell activation present in HIV-infected individuals is as strong a predictor of the risk of disease progression as virus load and, in the later stages of HIV disease, proved to be the strongest predictor of progression. Consistent with these observations, it has been reported that levels of apoptosis seen in uninfected lymphocytes obtained from HIV-infected patients are associated with levels of generalized immune activation rather than with extant levels of virus load (20). It is likely that levels of immune activation and apoptosis contribute, in addition to the direct consequences of virus-induced killing of infected cells, to the overall accelerated destruction and compromised production of CD4+ T cells following HIV infection. Collectively, these variables are, to varying degrees, independently responsible for disease progression. In addition to their independent contributions to disease progression rates, complex and as yet incompletely defined associations may exist between levels of virus replication and immune activation.
The results presented here support suggestions obtained in recent studies of nonpathogenic SIV infections of sooty mangabey monkeys, which represent both the natural hosts for SIV infection and the original source of all SIV isolates used in studies of AIDS pathogenesis in rhesus macaques (9). Interestingly, we and others have found that naturally infected sooty mangabey monkeys maintain high levels of chronic virus load (22; R. Grant, S. I. Staprans, A. Kaur, H. McClure, R. P. Johnson, and M. B. Feinberg, submitted for publication). We have further shown that the rates of infected-cell turnover are as high in infected sooty mangabeys as in rhesus macaques which progress to AIDS rapidly. In contrast to rhesus macaques, however, sooty mangabey monkeys maintain near-normal CD4+ T-cell levels and suffer no pathologic consequences. In detailed studies of SIV-infected sooty mangabey monkeys, we have observed limited or absent cellular anti-SIV immune responses and found no evidence of compromised lymphocyte-regenerative capacity and no increase in levels of indirect lymphocyte depletion through accelerated apoptosis of uninfected cells (G. Silvestri, D. Sodora, R. A. Koup, S. P. O'Neil, W. Kaiser, H. McClure, S. I. Staprans, and M. B. Feinberg, submitted for publication). Consistent with the analyses reported here, these data indicate that direct virus-induced killing of infected CD4+ T cells alone cannot account for the numerical and functional depletion of CD4+ T cells leading to AIDS. Rather, AIDS progression reflects a complex balance between the direct impact of the virus and the nature of the host response to the infection.
Correlations between virus load and disease progression have often been established before, involving either the time to disease directly (2, 15, 18) or measures that are associated with disease progression, such as CD4+ lymphocyte depletion or turnover (10, 13, 17, 19, 23, 24). Based on a few virus load measurements, these studies indicate that higher virus load leads to accelerated disease progression, or, more indirectly, to increased lymphocyte turnover or depletion. Our study goes beyond the established correlations between virus load and disease progression by taking into account the detailed temporal aspects of the virus load profile and investigating their direct impact on disease progression.
The central results of the present study are that time to death is not best determined by viral turnover and that viral peaks contribute less to disease progression than longer phases of lower virus load with equal overall levels of virus turnover. The implications of these findings for pathogenesis may suggest that death in HIV infection is not caused by pathogenicity of the virus but is due to the continuous cost which HIV-infected individuals pay over the years to actively, but ultimately ineffectively, fight a virus infection that their immune systems cannot clear.
Acknowledgments
We thank J. Lifson for cooperation in developing our ideas; Alun Lloyd for fruitful discussions; and Rob de Boer, Guido Silvestri, and two anonymous reviewers for commenting on our manuscript.
This work was supported by the Boehringer Ingelheim Fonds (R.R.R.), the Novartis Research Foundation (S.B. and R.R.R.), the Swiss National Science Foundation (S.B.), and National Institutes of Health grants R01 AI49155 and R21 AI44763 (S.I.S. and M.B.F.).
APPENDIX
The fitting procedure.The fitting procedure is conceptually very similar to a regression. For a fixed p we calculate the left-hand side of equation 1 for the 12 animals: [ vj(t)pdt]
 = τj. Here, tjdeath denotes the time when the jth animal died, and vj(t) is the virus load of the jth animal measured at time t. Then, we calculate the average of the left-hand sides, |$$|Am|gtj. This yields the universal tolerance threshold, τ:τ = |$$|Am|gtj. From τ we calculate the expected time of death for the jth animal according to the following algorithm: (i) If τ < τj, we integrate vj(t)p until the integral has the value τp. The time point at which the integral attains this value is the expected time of death (according to model 1) of the jth animal, tjexp: [
 vj(t)pdt]
 = τ Since τ < τj implies that tjexp > tjdeath, the present case contains the animals that die later than expected. (ii) If τ > τj we extrapolate the virus load progression of the jth animal, assuming that the virus load remains unchanged after the last measurement, vj(tjdeath). Then we integrate vj(t)p until the integral has the value τp. As above, this yields the expected time of death of the jth animal, tjexp: [
 vj(t)pdt]
 = τ. In the present case, we always have a tjexp greater than tjdeath; i.e., this case contains the animals which die earlier than expected.
We repeat this calculation for different values of p between 0 and 10. The best fit is determined by the value for p which minimizes the sum of squares: ∑j=112 [tjdeath−tjexp]2. Our results, however, are robust with respect to changes of the expression which is to be minimized. For our data set, we determined pbest to be 0.23. The sum of squares as a function of p displays a clear minimum and is well-behaved (Fig. A1), which gives us confidence in our approach. The fitting procedure for model 1 is diagrammatically summarized in Fig. 2. Goodness of fit. As in a common regression, we can estimate the goodness of fit by looking at the coefficient of determination, R2. R2 is defined as the ratio of the explained sum of squares divided by the total sum of squares of the variable regressed. In the case of a regression according to model 1 the coefficient of determination is given by the following equation:
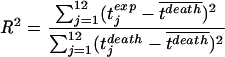 |
Our fit gives an R2 of 0.44, which means that model 1 explains 44% of the variation in the times of death. This proportion of explained sum of squares (SS) is significant (P < 0.025), as can be seen by an F test:
 |
A regression according to model 2, on the other hand, explains only 15% of the variance in the times to death (R2 = 0.15; Fs = 1.76), which is not significant (P > 0.1).
FIG. A1.

Fraction of the explained variation in survival times as a function of p. The best fit is determined as the value for the parameter p which maximizes the fraction of explained variation.
REFERENCES
- 1.Antia, R., B. R. Levin, and R. M. May. 1994. Within-host population dynamics and the evolution and maintenance of microparasite virulence. Am. Nat. 144:457-472. [Google Scholar]
- 2.Arnaout, R. A., A. L. Lloyd, T. R. O'Brien, J. J. Goedert, J. M. Leonard, and M. A. Nowak. 1999. A simple relationship between viral load and survival time in HIV-1 infection. Proc. Natl. Acad. Sci. USA 96:11549-11553. [DOI] [PMC free article] [PubMed] [Google Scholar]
- 3.Cheng-Mayer, C., D. Seto, M. Tateno, and J. A. Levy. 1988. Biologic features of HIV-1 that correlate with virulence in the host. Science 240:80-82. [DOI] [PubMed] [Google Scholar]
- 4.Efron, B. 1979. Bootstrap methods: another look at the jackknife. Ann. Stat. 7:1-26. [Google Scholar]
- 5.Efron, B., and R. J. Tishbirani. 1993. An introduction to the bootstrap. Chapman & Hall, New York, N.Y.
- 6.Etemad-Moghadam, B., D. Rhone, T. Steenbeke, Y. Sun, J. Manola, R. Gelman, J. W. Fan-ton, P. Racz, K. Tenner-Racz, M. K. Axthelm, N. L. Letvin, and J. Sodroski. 2001. Membrane-fusing capacity of the human immunodeficiency virus envelope proteins determines the efficiency of CD4+ T-cell depletion in macaques infected by a simian-human immunodeficiency virus. J. Virol. 75:5646-5655. [DOI] [PMC free article] [PubMed] [Google Scholar]
- 7.Giorgi, J. V., L. E. Hultin, J. A. McKeating, T. D. Johnson, B. Owens, L. P. Jacobson, R. Shih, J. Lewis, D. J. Wiley, J. P. Phair, S. M. Wolinsky, and R. Detels. 1999. Shorter survival in advanced human immunodeficiency virus type 1 infection is more closely associated with T lymphocyte activation than with plasma virus burden or virus chemokine coreceptor usage. J. Infect. Dis. 179:859-870. [DOI] [PubMed] [Google Scholar]
- 8.Haase, A. T. 1999. Population biology of HIV-1 infection: viral and CD4+ T cell demographics and dynamics in lymphatic tissues. Annu. Rev. Immunol. 17:625-656. [DOI] [PubMed] [Google Scholar]
- 9.Hahn, B. H., G. M. Shaw, K. M. De Cock, and P. M. Sharp. 2000. AIDS—AIDS as a zoonosis: scientific and public health implications. Science 287:607-614. [DOI] [PubMed] [Google Scholar]
- 10.Hellerstein, M., M. B. Hanley, D. Cesar, S. Siler, C. Papageorgopoulos, E. Wieder, D. Schmidt, R. Hoh, R. Neese, D. Macallan, S. Deeks, and J. M. Mccune. 1999. Directly measured kinetics of circulating T lymphocytes in normal and HIV-1-infected humans. Nat. Med. 5:83-89. [DOI] [PubMed] [Google Scholar]
- 11.Hellerstein, M. K., and J. M. McCune. 1997. T cell turnover in HIV-1 disease. Immunity 7:583-589. [DOI] [PubMed] [Google Scholar]
- 12.Ho, D. D., A. U. Neumann, A. S. Perelson, W. Chen, J. M. Leonard, and M. Markowitz. 1995. Rapid turnover of plasma virions and CD4 lymphocytes in HIV-1 infection. Nature 373:123-126. [DOI] [PubMed] [Google Scholar]
- 13.Lempicki, R. A., J. A. Kovacs, M. W. Baseler, J. W. Adelsberger, R. L. Dewar, V. Natarajan, M. C. Bosche, J. A. Metcalf, R. A. Stevens, L. A. Lambert, W. G. Alvord, M. A. Polis, R. T. Davey, D. S. Dimitrov, and H. C. Lane. 2000. Impact of HIV-1 infection and highly active antiretroviral therapy on the kinetics of CD4+ and CD8+ T cell turnover in HIV-infected patients. Proc. Natl. Acad. Sci. USA 97:13778-13783. [DOI] [PMC free article] [PubMed] [Google Scholar]
- 14.Lifson, A. R., N. A. Hessol, S. P. Buchbinder, P. M. Omalley, L. Barnhart, M. Segal, M. H. Katz, and S. D. Holmberg. 1992. Serum β-2 microglobulin and prediction of progression to AIDS in HIV-infection. Lancet 339:1436-1440. [DOI] [PubMed] [Google Scholar]
- 15.Lifson, J. D., M. A. Nowak, S. Goldstein, J. L. Rossio, A. Kinter, G. Vasquez, T. A. Wiltrout, C. Brown, D. Schneider, L. Wahl, A. L. Lloyd, J. Williams, W. R. Elkins, A. S. Fauci, and V. M. Hirsch. 1997. The extent of early viral replication is a critical determinant of the natural history of simian immunodeficiency virus infection. J. Virol. 71:9508-9514. [DOI] [PMC free article] [PubMed] [Google Scholar]
- 16.Liu, Z., W. G. Cumberland, L. E. Hultin, A. H. Kaplan, R. Detels, and J. V. Giorgi. 1998. CD8+ T-lymphocyte activation in HIV-1 disease reflects an aspect of pathogenesis distinct from viral burden and immunodeficiency. J. Acquir. Immune Defic. Syndr. Hum. Retrovirol. 18:332-340. [DOI] [PubMed] [Google Scholar]
- 17.McCune, J. M., M. B. Hanley, D. Cesar, R. Halvorsen, R. Hoh, D. Schmidt, E. Wieder, S. Deeks, S. Siler, R. Neese, and M. Hellerstein. 2000. Factors influencing T-cell turnover in HIV-1-seropositive patients. J. Clin. Investig. 105:R1-R8. [DOI] [PMC free article] [PubMed] [Google Scholar]
- 18.Mellors, J. W., C. R. Rinaldo, P. Gupta, R. M. White, J. A. Todd, and L. A. Kingsley. 1996. Prognosis in HIV-1 infection predicted by the quantity of virus in plasma. Science 272:1167-1170. [DOI] [PubMed] [Google Scholar]
- 19.Mohri, H., S. Bonhoeffer, S. Monard, A. S. Perelson, and D. D. Ho. 1998. Rapid turnover of T lymphocytes in SIV-infected rhesus macaques. Science 279:1223-1227. [DOI] [PubMed] [Google Scholar]
- 20.Muro-Cacho, C. A., G. Pantaleo, and A. S. Fauci. 1995. Analysis of apoptosis in lymph-nodes of HIV-infected persons: intensity of apoptosis correlates with the general state of activation of the lymphoid-tissue and not with stage of disease or viral burden. J. Immunol. 154:5555-5566. [PubMed] [Google Scholar]
- 21.Phillips, A. N., C. A. Lee, J. Elford, G. Janossy, A. Timms, M. Bofill, and P. B. A. Kernoff. 1991. Serial lymphocyte-CD4 counts and development of AIDS. Lancet 337:389-392. [DOI] [PubMed] [Google Scholar]
- 22.Rey-Cuille, M. A., J. L. Berthier, M. C. Bomsel-Demontoy, Y. Chaduc, L. Montagnier, A. G. Hovanessian, and L. A. Chakrabarti. 1998. Simian immunodeficiency virus replicates to high levels in sooty mangabeys without inducing disease. J. Virol. 72:3872-3886. [DOI] [PMC free article] [PubMed] [Google Scholar]
- 23.Rosenzweig, M., M. Demaria, D. M. Harper, S. Friedrich, R. K. Jain, and R. P. Johnson. 1998. Increased rates of CD4+ and CD8+ T lymphocyte turnover in simian immunodeficiency virus-infected macaques. Proc. Natl. Acad. Sci. USA 95:6388-6393. [DOI] [PMC free article] [PubMed] [Google Scholar]
- 24.Sachsenberg, N., A. S. Perelson, S. Yerly, G. A. Schockmel, D. Ledue, B. Hirschel, and L. Perrin. 1998. Turnover of CD4+ and CD8+ T lymphocytes in HIV-1 infection as measured by Ki-67 antigen. J. Exp. Med. 187:1295-1303. [DOI] [PMC free article] [PubMed] [Google Scholar]
- 25.Schellekens, P. T. A., M. T. L. Roos, F. Dewolf, J. M. A. Lange, and F. Miedema. 1990. Low T-cell responsiveness to activation via CD3/TCR is a prognostic marker for acquired-immunodeficiency-syndrome (AIDS) in human immunodeficiency virus-1 (HIV-1)-infected men. J. Clin. Immunol. 10:121-127. [DOI] [PubMed] [Google Scholar]
- 26.Staprans, S. I., P. J. Dailey, A. Rosenthal, C. Horton, R. M. Grant, N. Lerche, and M. B. Feinberg. 1999. Simian immunodeficiency virus disease course is predicted by the extent of virus replication during primary infection. J. Virol. 73:4829-4839. [DOI] [PMC free article] [PubMed] [Google Scholar]
- 27.Tersmette, M., R. A. Gruters, F. Dewolf, R. E. Y. Degoede, J. M. A. Lange, P. T. A. Schellekens, J. Goudsmit, H. G. Huisman, and F. Miedema. 1989. Evidence for a role of virulent human immunodeficiency virus (HIV) variants in the pathogenesis of acquired immunodeficiency syndrome: studies on sequential HIV isolates. J. Virol. 63:2118-2125. [DOI] [PMC free article] [PubMed] [Google Scholar]
- 28.Zinkernagel, R. M., and H. Hengartner. 1994. T-cell mediated immunopathology versus direct cytolysis by virus: implications for HIV and AIDS. Immunol. Today 15:262-268. [DOI] [PubMed] [Google Scholar]