

Abstract
Electric pulses across intact vesicles and cells can lead to transient increase in permeability of their membranes. We studied the integrity of these membranes in response to external electric pulses of high amplitude and submicrosecond duration with a primary aim of achieving selective permeabilization. These effects were examined in two separate model systems comprising of 1), a mixed population of 1,2-di-oleoyl-sn-glycero-3-phosphocholine phospholipid vesicles and in 2), single COS-7 cells, in which large endosomal membrane vacuoles were induced by stimulated endocytosis. It has been shown that large and rapidly varying external electric fields, with pulses shorter than the charging time of the outer-cell membrane, could substantially increase intracellular fields to achieve selective manipulations of intracellular organelles. The underlying principle of this earlier work is further developed and applied to the systems studied here. Under appropriate conditions, we show preferential permeabilization of one vesicle population in a mixed preparation of vesicles of similar size distribution. It is further shown that large endocytosed vacuoles in COS-7 cells can be selectively permeabilized with little effect on the integrity of outer cell membrane.
INTRODUCTION
External electric fields affect cellular systems in a multitude of ways ranging from low field effects associated with signaling (1), wound healing (2), cell growth (3), and transport (4) to relatively large pulsed fields with more immediate consequence on the integrity of the cell membrane. The latter effect is known as electroporation or electropermeabilization and forms the basis for several field-dependent biomedical applications in use today. Transient electroporation has been used to introduce nucleic acids into cells for gene transfection experiments (5–8), to produce somatic hybrids by cell-cell fusion (electrofusion) (9,10), to insert specific proteins into membranes (electroinsertion) (11), as well as for clinical applications in targeted drug delivery and tumor treatment (12–14). Correspondingly, liposome and vesicle systems respond similarly to pulsed electric fields resulting in the induction of transient pores (15–18). Pore-mediated reactions in small unilamellar vesicles have, for example, been used in the synthesis of AgBr quantum dots (19,20), and in the study of fast chemical reactions (21).
Traditionally, the field-induced membrane potential, Δφi(t, θ) for intact spherical cells and vesicles has been modeled on the basis of a time-dependent solution of Laplace's equation for a thin dielectric shell immersed in a conductive medium (22–24) and is given by
 |
(1) |
where
 |
(2) |
The value Eo is the amplitude of the external field, a is the radius of the cell, θ is the angle between the vector of external field and a radius-vector of the sphere, τm is the time constant for the charging of the membrane capacitance, Cm is the membrane capacitance per unit area, and ρi, ρe are the resistivities of the internal and external media, respectively. The main features of Eq. 1 with respect to size, angular, and exponential dependence have been experimentally validated with the help of potential-sensitive and permeability indicator dyes (25–27).
Many of the vesicle and cellular systems previously examined reveal that membrane pores are associated with the development of critical transmembrane potentials, Δφc (typically ∼30–1000 mV), for a macroscopically observable electroporation. The effect of these pulsed fields on cells, and to a somewhat lesser extent on vesicles, manifest in a multitude of responses that often become difficult to easily discern. This may arise from the pulse characteristics used, its associated secondary effects, or from inherent differential susceptibility of the systems being studied to external field perturbations. It has thus been of general interest to seek ways to achieve specificity of field effects and to extend the utility of currently known methods (7,8,28). Selective permeabilization of large cells (or vesicles) in the presence of small ones has previously been shown with classical electroporation methods where tpulse ≫ τm (16,18,29). On the other hand, nanosecond pulses with fast rise time are rarely utilized and are further explored here as means of achieving new selective effects generally not possible with slowly varying electric fields.
To a large extent, the changes in field-induced membrane potential, Δφi, and its temporal development can be estimated from the electrical parameters of the cellular (or vesicular) membrane, the suspending medium, and the pulse characteristics of the applied electric field. This generally holds for relatively low-density populations of cells and isolated systems of simple geometry, whereas in more complex systems (e.g., in tissue and other dense heterogeneous samples) reasonable estimates are difficult to obtain (see, however, Gowrishankar et al. (30), for recent new approaches). Nevertheless, large external fields applied to cell suspensions induce conduction currents in the cytoplasm, which decrease exponentially with the charging time constant of the outer membrane, and a corresponding displacement current through inner vesicular membrane structures. For pulses shorter than or equal to the charging time of the outer membrane, tpulse ≤ τm, a transient cytoplasmic field can develop membrane voltages across intracellular organelles and vesicles in excess of their critical transmembrane potential, thus allowing for selective electroporation. This effect was shown earlier on human eosinophils using 60-ns pulses where the integrity of the intracellular granules was monitored with calcein dye (31,32). Typically, the membrane charging time for a cell with radius a = 7 μm, internal and external medium resistivities ρi = ρe = 100 Ω cm, and Cm = 1 μF cm−2 is ∼105 ns. An inner vesicular membrane within the same cell having comparable membrane capacitance and radius, b, of ∼1 μm will have a charging time constant of ∼15 ns.
Analogous to the field distribution and its effects on cells and their inner structures described above, short pulses of high amplitude could also permit selective electroporation of a population of cells or vesicles provided sufficient differential in the charging time of the membrane capacitance exits, or can be experimentally established. Although this is rather difficult to establish in mixed cell cultures, significant difference in charging time constants τm, can be readily attained in prepared vesicle systems through appropriate adjustments of internal and external resistivities.
We considered here preferential membrane permeabilization in cells with internal structures, as well as in a mixed population of vesicles by nanosecond pulsed electric fields (nsPEF). We show that in two vesicle populations of similar size distribution but with internal aqueous environment consisting primarily of either salt or sucrose, the salt-filled vesicle can be selectively permeabilized with an ∼10-ns pulse of appropriate amplitude. In COS-7 cells, we show that endocytosed membrane vacuoles carrying an exogenous marker are preferentially perforated (using ∼50-ns repetitive pulses of field strengths on the order of ∼7 kV/cm), as indicated by the release of the molecular marker into the cytosol. This selective permeabilization of the inner vacuoles occurs without a detectable effect on the permeability of the outer cell membrane.
MATERIALS AND METHODS
Reagents
1,2-Di-oleoyl-sn-glycero-3-phosphocholine (DOPC) in chloroform was purchased from Avanti Polar Lipids (Alabaster, AL). Alexa-594 conjugated Dextran (MW, 10 K), Ethidium Homodimer, Calcien, Fura-Red, Fluo-3, and the Ca+2 ionophore 4-bromo A-23187 were from Molecular Probes (Eugene, OR). NaCl, Na,K-Phosphates, Sucrose, and CaCl2 were from Fisher (St. Louis, MO). Cell culture media and antibiotics were Gibco-BRL (Gaithersburg, MD).
Preparation of vesicles
Vesicles were prepared following minor modifications of two earlier methods (33,34). The phospholipid surfactant DOPC (Avanti Polar Lipids) was used without further purification. Two-hundred microliters of the stock solution (1 mg/mL) of the lipid sample in chloroform was placed in a round bottom flask to which 300 μL of methanol was added. The organic solution was then hydrated with 6 mL of either a solution (150 mM NaCl, 2 mM Na-phosphate pH = 7.2, ρ = 1.17 × 10² Ω cm) containing 600 μM Fura-Red or in an iso-osmotic sucrose solution (250 mM, 2 mM phosphate, pH = 7.2, ρ = 2.15 × 10⁴ Ω cm) containing 100 μM Fluo-3 (both of the indicator fluorescence dyes were in their penta-ammonium salt form). Conductivities of the buffered solutions were measured with a conductivity meter (Amber Science, Eugene, OR). These mixtures were mounted in a distillation apparatus and the organic phase was evaporated under reduced pressure at 40°C for ∼5 min (in some cases, chloroform solvent in the stock solution was evaporated and the dry lipid hydrated as above, with similar results). The remaining aqueous solution contained large and heterogeneous multilayered vesicles incorporating the dye molecules used in the initial preparations. To prepare the final unilamellar vesicles, the multilayered vesicles' suspension was first frozen and thawed 10 times in liquid nitrogen and then extruded (Extruder, Lipex Biomembranes, Toronto, Canada) under nitrogen pressure (of up to 4 atm) successively (five times) through two stacked polycarbonate filters, each of which had pore sizes of 400, 200, and 100 nm, respectively. To remove unincorporated dye molecules the extruded solution was first passed through a gel filtration column (Bio-Gel 10, Regent Medical, Irlam, UK) with the column elution being monitored with a conductivity meter (Amber Science) fitted with a flow cell. Finally, these vesicle preparations were extensively dialyzed (dialysis membrane with a cutoff size of 3000 K) for ∼6–8 h. The salt-filled vesicles were dialyzed against the iso-osmotic sucrose solution. The vesicles were used within the same day, after the dialysis step. Unilamellarity of vesicle prepared with the extrusion method has been shown previously (34) through 31P NMR quenching by Mn2+, and is not repeated here. The mean hydrodynamic diameter of the vesicles was determined at 25°C by quasielastic light scattering using a multiangled goniometer with a laser light source. The scattering data were analyzed by nonnegative least-squares and a mean hydrodynamic diameter of 103 nm was determined.
Cell culture and transfection
COS-7 cells were grown at 37°C in 5% CO2 on two well-chambered coverglass slides (Lab Tek, Winooski, VT) to ∼50–70% confluency in Dulbecco's modified Eagle's Medium supplemented with 10% calf serum, 100 U/mL penicillin, and 100 μg/mL streptomycin. Both transfection and field pulse electroporation experiments were performed on these chamber slides. The plasmid constructs (a donation from Dr. J.G. Donaldson, NHLBI, National Institutes of Health), Arf6-Q67L mutant, the fusion protein PLCδ-pleckstrin homology (PH) domain tagged with green fluorescent protein (PH-GFP), and GFP alone were further expressed in bacteria and purified using a standard purification kit (Qiagen, Venlo, The Netherlands). Purified plasmids (∼1.5 μg/μL) were kept at 4°C before use. Cells were transformed using the Fugene-6 (Roche, Nutley, NJ) transfection reagent. Typically, cells were transfected or cotransfected (Arf6-Q67L and PH-GFP, or Arf6-Q67L and GFP) with the DNA plasmids at concentrations of ∼1 μg/mL and examined for transient expression ∼12–18 h later. Alexa-594 conjugated dextran (MW 10 K, 125 μg/mL) or calcein (100 μg/mL) were loaded into internalized vacuoles by incubating cells with these markers for the entire period of transfection. Before electroporation experiments, cells were extensively washed with fresh growth medium without serum to remove unincorporated markers and briefly placed into iso-osmotic sucrose solution containing 1 μM of ethidium homodimer as a marker for plasma membrane integrity during the pulse experiments.
Pulse generators and electrodes
The ∼50-ns pulse generator (Velonex Model 360, Pollock Pines, CA) setup used for the electroporation of COS-7 cells is similar to the one previously described (18,35). Repetitive unipolar square pulses of ∼20 Hz were produced by serially gating several pulse generators. A 15 V trigger pulse (Hewlett-Packard Model 8011A, Palo Alto, CA) is used to gate a waveform generator (Wavetek Model 183, Foster City, CA) whose output is fed to the Velonex 360, resulting in the amplification of the input waveform to amplitudes of up to ∼2.0 kV. With an electrode separation of 1 mm, field strengths up to 20 kV/cm into an ∼200-Ω load are obtained. Output pulses were monitored with a 1000:1 probe (Tektronix 6501, Beaverton, OR), on a 500-MHz oscilloscope (Hewlett-Packard Model 54615B). The electrodes were constructed out of polished 1-cm-long thin stainless steel plates and mounted on a rectangular Teflon block 1-mm apart. For the pulse experiments, the electrode assembly was manipulated with a mechanical holder mounted on the stationary part of the microscope stage, and was lowered into the chamber slides at a predetermined position that coincided with the central field of view of a confocal microscope.
The 10-ns pulse generator is based on the Blumlein configuration, and consists of two strip lines of equal length, each with an impedance of Z, and a switch placed on one end and the load (sample cell) between the two lines. The line impedance is  where δ is the thickness of the insulator, ɛr is the relative dielectric constant, and w is the width of the metal strips. In the case of a matched load, with the load resistance for the Blumlein circuit equal to twice the line impedance, the voltage across the sample cell is the fully applied voltage and the pulse duration is
  where l is the sum of the length of the two strip lines and c is the speed of light in vacuum. The strip lines were 80-cm long and 2.5-cm wide and were separated by a Teflon sheet with a relative dielectric constant of 2.2. The impedance Z was 5 Ω the load impedance 10 Ω, and the pulse duration 10 ns. The switch used was a Sulfur Hexafluoride (SF6) pressurized spark gap. The output voltage could be adjusted from ∼2 to 30 kV by varying the pressure on the spark gap and corresponds to electric field values ranging from ∼20 to 300 kV/cm with an electrode separation of 1 mm. The sample cell electrodes were made of two polished stainless steel plates and held in place with Teflon screws spaced with a Kel-F block 1-mm thick. A grooved area within the Kel-F block held ∼200 μL of sample solution exposed to the electrodes. Vesicle samples subject to pulsed fields were transferred to a standard 200 μL fluorometer cuvettes for fluorescence recording.
Confocal microscope and fluorescence photometers
Fluorescence images of cells were taken on a Zeiss LSM 5 Pascal laser scanning confocal microscope (Carl Zeiss, Jena, Germany). Images were analyzed with the 3D for LSM software package from Zeiss. Fluorescence emission spectra for the vesicle experiments were taken on a PTI fluorometer (Photon Technology International, Trenton, NJ).
RESULTS
Our primary aim in the present study was to determine whether submicrosecond pulses with sufficient amplitude can be used to electroporate a selective population of a mixed vesicles or intracellular organelles. This novel method is illustrated with two systems, one of which consists of a mixture of two vesicle populations of similar sizes whereas the other involves COS-7 cells with internalized vacuoles incorporating external material.
Mixed vesicle system
Two batches of vesicles were prepared as described in Materials and Methods, above. Fluo-3 was incorporated in one vesicle preparation using a buffer containing 250 mM sucrose and 2 mM phosphate, pH = 7.2, as the hydrating medium. The resulting internal and external resistivity of vesicle suspension was ∼2.15 × 10⁴ Ω cm. In the second batch Fura-Red was encapsulated with the internal solution (150 mM NaCl, 2 mM phosphate, pH = 7.2) having resistivity of ∼1.17 × 10² Ω cm. The vesicles were then extensively dialyzed against the iso-osmotic sucrose medium to yield an external resistivity of ∼2.15 ± 104 Ω cm. Fluo-3 and Fura-Red are known Ca+2 indicators with well-separated spectral profiles. Both dyes are excited at λex = 488 nm and upon binding to Ca+2, Fluo-3 emission (λem = 525 nm) is enhanced whereas that of Fura-Red (λem = 625 nm) is quenched. Selective electroporation of one vesicle population can therefore be monitored by the spectral change in one of the dye emissions when a solution containing both vesicle preparations is subjected to a field pulse in the presence of external Ca+2 ions. Based on the relative conductivities of the vesicles' inner and outer solutions and assuming the lipid membrane capacitance is ∼1 μF cm−2, the charging time constants of ∼54 ns and ∼165 ns were estimated for the salt- and the sucrose-filled vesicles, respectively.
Before field pulse experiments, stability of the vesicle mixtures was checked and the results are shown in Fig. 1. Fig. 1 A (dashed line) is the emission spectrum of Fluo-3 loaded vesicles. The middle trace (dotted line) was obtained with the same sample measured ∼2 min after addition of 50 μM Ca+2 to the stirred sample cuvette. It shows little spectral change, indicating that Ca+2 ions did not leak into the vesicles and that there was small amount of free dye outside the vesicles. The top spectrum (solid line) was obtained with the same sample containing Ca+2 with the addition of an excess amount of a Ca+2 ionophore 4-bromo A-23187. The uptake of Ca+2 resulted in an approximately fivefold increase in the fluorescence intensity. Fig. 1 B shows the results obtained with the same set of experiments as those shown in Fig. 1 A, using vesicles loaded with Fura-Red dye. In this case binding of Ca+2 resulted in quenching of the emission spectrum of Fura-Red. Fig. 1 C shows the spectrum of the mixed-vesicle samples (dotted line, see figure legend) and the spectrum of the sample taken after the addition of 50 μM Ca+2 and excess amounts of the Ca+2 ionophore (solid line). The spectrum shows the expected elevation at ∼525 nm and a decrease at ∼625 nm due to Ca+2 binding to Fluo-3 and Fura-Red, respectively.
FIGURE 1.
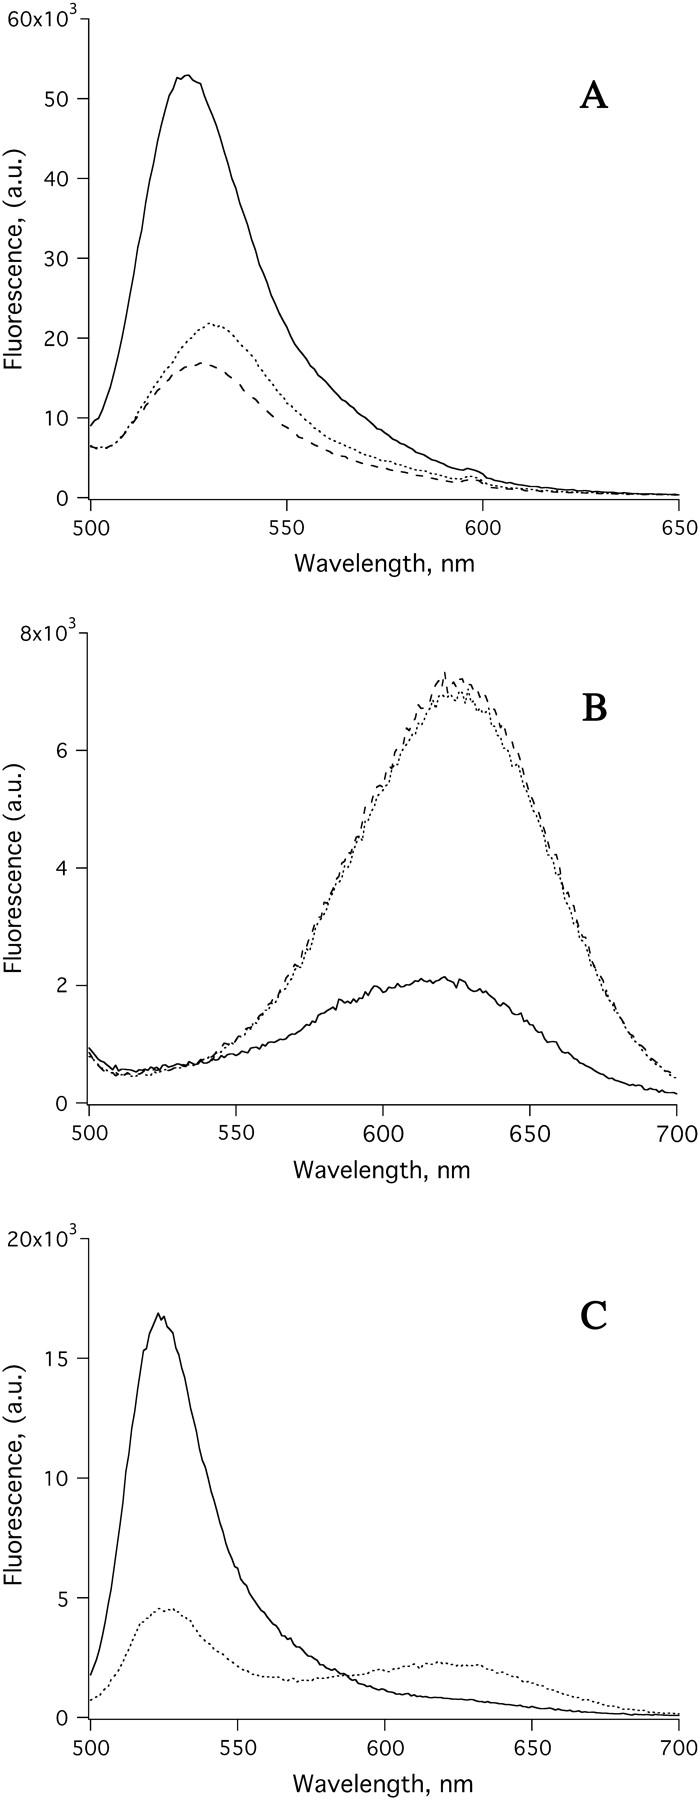
Fluorescence emission spectra of vesicles loaded with Calcium indicators, Fluo-3 and Fura Red. (A) Fluo-3 loaded vesicles: Spectra of dye-loaded vesicles alone (dashed line); with 50 μM of Ca+2 added (dotted line); and with 50 μM of Ca+2 plus 5 μM Calcium ionophore, 4-bromo A-23187 (solid line). (B) Fura-Red loaded vesicles: Spectra of dye-loaded vesicles alone (dashed line); with 50 μM of Ca+2 (dotted line); and with 50 μM of Ca+2 plus 5 μM Calcium ionophore, 4-bromo A-23187 (solid line). (C) Spectra of a mixed solution of Fluo-3 and Fura-Red loaded vesicles (dotted line); and with 50 μM of Ca+2 and 5 μM Calcium ionophore, 4-bromo A-23187 (solid line).
Fig. 2 shows results of selective electroporation of a mixed vesicle suspension using the 10-ns Blumlein pulse generator at various field strengths. The spectra in Fig. 2 A show the control reading obtained with addition of 5 μM of Ca+2 ionophore to the vesicle solution containing 50 μM Ca+2 to reveal the maximal emission in these sample preparations. In Fig. 2, B–D, the vesicles were subjected to a single 10-ns pulse of ∼80, 160, and 240 kV/cm field strengths, respectively (see figure legend for the different spectral scans on each panel). At ∼80 kV/cm no spectral changes from either population of vesicles were observed. However, at ∼160 kV/cm (Fig. 2 C) the Fura-Red spectrum was essentially fully quenched, indicating permeabilization of the vesicles filled with salt whereas the Fluo-3 spectrum was only partially affected. At higher field strengths, i.e., ∼240 kV/cm (Fig. 2 D), both of the vesicle populations were affected, as indicated by the relative increase in the Fluo-3 and loss of the Fura-Red emission signals. At the falling edge of the 10-ns pulse, in the case when the salt-filled vesicles were primarily affected, the computed induced membrane potential was ∼200 mV whereas that for the sucrose-filled vesicle is ∼70 mV. Since both vesicles were permeabilized at ∼240 kV/cm (corresponding to ∼105 mV for sucrose-filled vesicles) and neither were affected at ∼80 kV/cm, a reasonable estimate of the critical potential value is ∼105 mV. This induced potential difference is within close range of the previously reported value of ∼55 mV obtained in electroporation of similar vesicles by millisecond pulses (17,19,36).
FIGURE 2.

Fluorescence emission spectral changes of a mixed population of vesicles loaded with either Fluo-3 or Fura-Red, subject to an ∼10-ns electric pulse of varying amplitude. (A) Control: Spectra of a solution containing a mixture of Fluo-3 and Fura-Red loaded vesicles (dashed line). Maximum emission obtained in the presence of 50 μM of Ca+2 plus 5 μM Calcium ionophore, 4-bromo A-23187 (solid line). (B) Dye-loaded vesicles alone (solid line); with 50 μM of Ca+2 (dashed line); with 50 μM of Ca+2 and subject to electric pulse of ∼80 kV/cm field strength (dotted line). (C) Dye-loaded vesicles alone (solid line); with 50 μM of Ca+2 (dashed line); with 50 μM of Ca+2 and ∼160 kV/cm field strength (dotted line). (D) Dye-loaded vesicles alone (solid line); with 50 μM of Ca+2 (dashed line); and with 50 μM of Ca+2 and ∼240 kV/cm field strength (dotted line).
Permeabilization of intracellular vacuoles in COS-7 cells
Although selective permeabilization of intracellular organelles with short nanosecond pulses has been shown in human eosinophils (31) and recently in Jurkat T-lymphoblast cells (37), it is worth noting that in these studies relatively large fields in the order of ∼25–60 kV/cm were used. This may have been necessary due to the small size (≪1 μm) of the intracellular organelles that were found to have been affected. Recent reports on the effects of high-intensity fields have, nevertheless, revealed a number of other biological effects in living cells, which may not necessarily be associated with perforation of the cell membranes. In Jurkat and HL-60 cells, for example, nsPEF in the order of 60–150 kV/cm (energy density of ∼1.7J/cc/pulse) activated the apoptotic pathway as indicated by activation of caspases, annexin-V-FITC binding to phosphatidylserine, and release of cytochrome c from mitochondria (38,39). A precise field-dependent mechanism of activating programmed cell death is not, however, clearly understood. Although the effects of nsPEF are certainly important in the context of inducing apoptosis and its subsequent implications, they need to be avoided when high viability of selectively permeabilized cells is the desired outcome.
The potential problems associated with high field strengths mentioned above could, in part, be ameliorated if larger intracellular structures are used as targets for the selective electroporation. Fig. 3 shows a model scheme representing a cell with an internalized vacuole (Fig. 3 A, top), and its simplified equivalent circuit (Fig. 3 A, bottom). We examined the effects of the relative sizes of these two structures, taking into account the resistivity of their environment (see the Appendix for details). Fig. 3 B shows the development of membrane potential in the whole cell and in the inner vacuole for various vacuole/cell size ratios. These results show that when the difference in size is relatively large (i.e., the vacuole is small), the maximal membrane potential on the inner vacuole is relatively small and the maximal difference between the inner and outer membrane voltages is also small. Electroporation of this vacuole will thus require higher external fields to achieve selective intracellular effects. However, as the size of the inner vacuole increases, the magnitude of induced voltage across its membrane also increases, without any effect on the magnitude of the voltages on the outer cell membrane. Thus, lower external fields may now be sufficient to permeabilize the vacuole membrane. These differential charging effects progressively diminish as the size of the inner vacuole size approaches that of the cell. Nevertheless, within a given time window, selective intracellular delivery of exogenous markers may be achieved at lower field strengths while avoiding possible side effects associated with high-intensity electric fields (>10 kV/cm).
FIGURE 3.

A circuit model and simulation results for preferential electroporation of intracellular vacuole membranes (see Appendix for details). (A) The symmetry of the scheme shown on top has been simplified by combining serial membrane capacitances and media resistances into the corresponding capacitors and resistors shown in the bottom scheme. The equivalent circuit shown at the bottom represents a cell with membrane capacitance C1 external and internal resistances of R2 and R4, respectively. The inner vacuole capacitance is represented by C2 with internal resistance R5. The two membrane capacitances are being charged by current from an external source U0 through the two charging resistors R1 and R3. U1 is the voltage on C1 and U2 is the voltage on C2. The relative thickness of the conductors qualitatively represents the magnitudes of electric current flowing through the model components. (B) The temporal development of the field-induced membrane voltages across the membranes for various ratios of the vacuole/cell sizes. The membrane voltages for cell (thick line) and vacuole (thin lines) generated using Eqs. A6 and A17. Conditions: cell radius, 10 μm, ρe = 215 Ω m, ρi = ρv = 1 Ω m, Cm = 0.01 F/m2, E0 = 6.7 kV/cm. The charging time constant for the cell was 11 μs and 30, 45, and 60 ns for the 2-, 3-, 4-μm sized vacuole radii (from bottom to top), respectively.
To show the selective permeabilization of large intracellular vacuoles we used COS-7 cells cotransfected with Arf6-Q67L (a hydrolysis-resistant mutant of ADP ribosylation factor 6, i.e., Arf6) and PH-GFP (a pleckstrin homology, i.e., PH, domain of phospholipase-Cδ, i.e., PLCδ, tagged with green fluorescent protein, i.e., GFP) to induce the formation of endocytosed vacuole membranes (40). Fig. 4 A shows a merged confocal image of a bright field image and GFP fluorescence of transfected cells to demonstrate the level of transformation obtained with the protocols described earlier. Typically, ∼40% of cells express the PH-GFP construct, whereas the cells expressing both Arf6-Q67L and PH-GFP made only ∼10%. Fig. 4 B shows expression of both plasmids and a large number of intracellularly trapped vacuoles of diameters ranging from ∼1 μm to ∼5 μm. Cell image was taken ∼18 h after transfection. Z-sliced confocal images further revealed that much of the cytoplasm was filled with these vacuoles (not shown). Fig. 4 C depicts the control experiments in which cells were transfected with PH-GFP alone and no vacuoles were formed. Note that the PH-GFP is localized to the plasma membrane. To verify whether the endocytosed vacuoles are intact structures within the cell interior, cells were transfected with Arf6-Q67L and GFP (without the PH domain). The results in Fig. 4 D show that free GFP is excluded from the vacuoles and is only localized to the cytosol. Fig. 4, E–H, show transfection and loading of the vacuoles with Alexa-594 conjugated Dextran (MW 10 K) present during the entire transfection period at the concentration of 125 μg/ml. Fig. 4 E is the merged image of the green (GFP, Fig. 4 F) and red (Alexa-594) emission channels after the cell culture was extensively washed with growth medium to remove external conjugated dye. Alexa-conjugated dextran can also incorporate into COS-7 cells by an Arf6-independent pathway, as shown by the red fluorescence in Fig. 4 E. In general, these pathways result in much smaller compartments. Fig. 4, G and H, clearly shows incorporation of the external markers, although the extent of uptake varies among the different internalized vacuoles. The image on Fig. 4 G was taken 18 h after transfection, and that in Fig. 4 H at 12 h. These results show that overexpression of Arf6-Q67L causes cells to accumulate large endocytosed vacuoles and that these vacuoles can be loaded with external markers.
FIGURE 4.
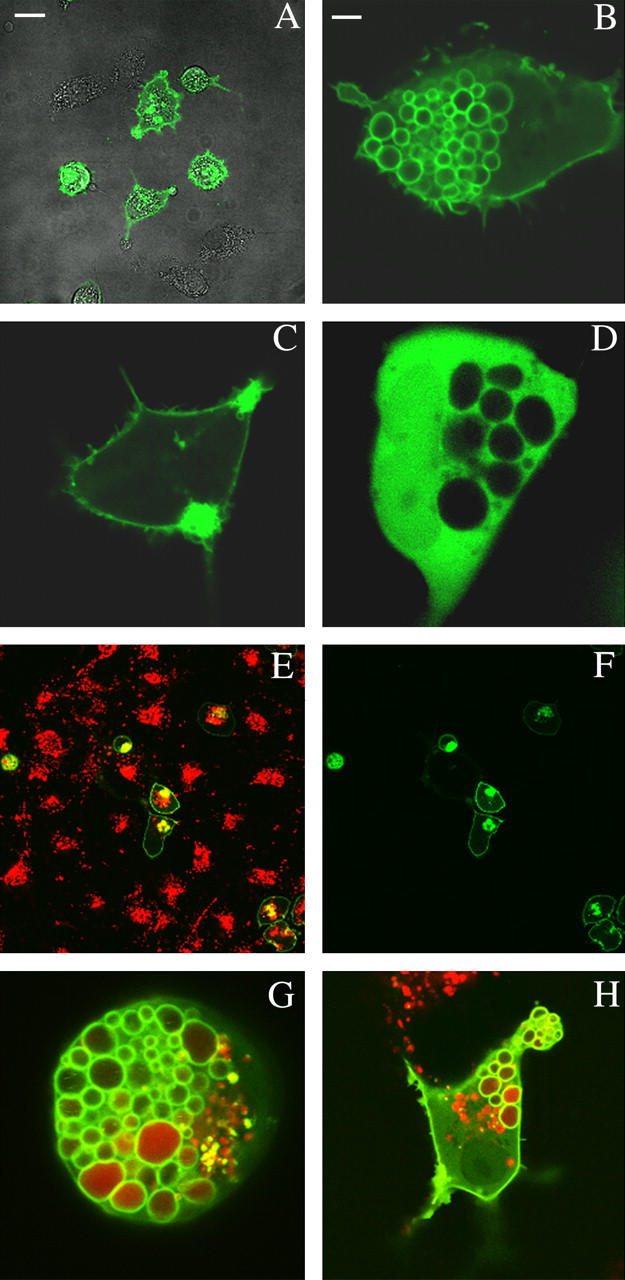
COS-7 cells cotransfected with Arf6-Q67L mutant and PLCδ-PH domain tagged with green fluorescent protein (GFP). (A) Phase contrast and green emission channel confocal merged images of transfected and untransfected COS-7 cells. (B) COS-7 Cell expressing both the Arf6-Q67L phenotype and GFP-tagged PLCδ-PH domain showing large internalized and trapped membrane vacuoles. (C) Control: Cells transfected with GFP-tagged PLCδ-PH domain only. (D) Control: Cells transfected with Arf6-Q67L and free GFP only. (E) Merged images of COS-7 cells cotransfected with Arf6-Q67L and GFP-PLCδ-PH (green) and incubated in the presence of 125 μg/ml Alexa-594-Dextran (MW = 10 K, red). (F) Green emission channel confocal image of COS-7 cells described in E. (G) Cell expressing both the Arf6-Q67L mutant and GFP-tagged PLCδ-PH showing internalized large vacuoles with trapped Alexa-594-Dextran (MW = 10 K, red). Cell image taken 18 h after transfection. (H) Same conditions as in G, with cell image taken 8 h after transfection. Scale bar, 25 μm in A, E, F; 5 μm in B, C, D, G, and H.
In Fig. 5, cells were transfected with Arf6-Q67L plasmid alone (without the PH-GFP) and incubated in the presence of 100 μg/mL of calcein for 12 h. Before nsPEF application the cell chamber slide was washed with growth medium and then briefly exposed to the isotonic sucrose solution containing 1 μM of ethidium homodimer during the application of a 50-ns, 6.7 kV/cm pulse (100 pulses at 20 Hz). Under similar field conditions and assuming, for example, a ratio of vacuole to cell radius of 0.3, external medium resistivity of ∼2.15 × 10⁴ Ω cm, cytoplasmic, and internal vacuoles resistivity of ∼1 × 10² Ω cm, charging time constants of 45 ns and 11 μs were estimated for the vacuole and cell membrane, respectively (see Appendix for simulation results). Fig. 5 B shows release of calcein into the cytoplasm whereas ethidium-homodimer remained in the medium when the cell was exposed to the external field. The image shown in the figure was taken at ∼3 min after an electric pulse of field strength 6.7 kV/cm and a pulse width equal to 50 ns (100 pulses at 20 Hz) was applied. In Fig. 5 C, cells were prepared similarly to that shown in Fig. 5 A. When these cells were subjected to a single 1.4 kV/cm, 400-μs pulse, intense nuclear and cytoplasmic staining with the ethidium homodimer occurred, indicating electroporation of the plasma membrane of the cells (Fig. 5 D).
FIGURE 5.

Permeabilization induced by short and long pulses. COS-7 cells were transfected with Arf6-Q67L alone and incubated in the presence of 100 μg/ml Calcein-green for 12 h. (A) Control: Before electrical pulse. (B) Electric field strength = 6.7 kV/cm, pulse width = 50 ns at 20 Hz (100 pulses) in the presence of 1-μM ethidium homodimer in the external iso-osmotic sucrose medium. The images shown are from the green emission channel (no emission from the red channel is observed) and was taken at ∼180 s after the pulse. (C) Control: Before electric field treatment. (D) Red-green merged layer images showing ethidium homodimer staining after a single 1.4 kV/cm, 400-μs pulse. Image taken ∼150 s. Scale bar: 5 μm A–D.
DISCUSSION
The permeabilization of the plasma membrane of biological cells and synthetic membrane vesicles by external applied electric fields has been used extensively in a multitude of biotechnology and medical applications. The basic consequence of these field effects is a rapid rise in the electrical conductivity of the affected membranes as transient membrane pores are created. Membrane pores are induced in cell and vesicle systems once critical potentials are reached and managing the permeabilized state has largely depended on adjustments of experimental conditions (e.g., temperature, osmotic pressure, etc.), as well as the number of pulses and pulse duration. Although selective permeabilization of heterogeneous samples based on size is achievable, the available latitude for specificity is rather limited in classical electroporation. Developments in pulsed power systems applied to biological cells extend these limitations with the addition of short pulses (∼1–300 ns) and significantly higher fields of up to ∼300 kV/cm. With short pulse durations on the order of, or less than, the charging time of the plasma membrane, increasing field effects on intracellular components may be achieved. Similar pulse characteristics could also be used to impose selective field effects in a population of cells or vesicles. Aside from the field effects leading to permeability of membranes, recent findings further suggest fundamentally different physiological responses may result in some cells exposed to nsPEFs. In Jurkat, and HL-60 cells, for example, apoptosis can be induced at high field strengths but not in Rat Glioma C6 cells (37), although, at relatively lower fields, calcium release analogous to known receptor-mediated signaling pathways were observed (41).
We have used these short pulse techniques to demonstrate preferential perforation of intracellular membrane vacuoles as well as selective electroporation of vesicles from a mixture of similar size distribution. The experimental results shown in Fig. 2 with the vesicle systems is based on the fact that a difference in charging time of the vesicle membrane capacitance can be used as a means to achieve preferential electroporation. There is evidence in earlier literature that such differences can be established through variations in the external resistivity of the suspending medium and was, indeed, optically measured using potential sensitive dyes in both Sea Urchin eggs (27,42) and in large macroscopic synthetic vesicles (25). Our data demonstrates the use of short pulses for achieving selective field effects. Although the vesicle system studied here was designed only to show the underlying principle, other systems in which sufficient differences in either membrane capacitance or medium conductance exist should allow implementation of selective effects induced by short pulses.
As shown in Fig. 4, G and H, transiently transformed COS-7 cells with Arf6-Q67L mutant transport exogenous material into the cytosol by large endocytic vacuoles. Such delivery systems and subsequent selective electroporation of the inner vacuoles could be advantageous when permeabilization of the outer cell membrane is deleterious to cells. Analogous transport and release of macromolecules in cultured mammalian cells by osmotic lysis of pinocytic vesicles has previously been described (43). Although we have used transient expression to induce the formation of the intracellular vacuoles for this experiment, the expression levels were not sufficiently controllable to be useful since the cells were eventually not viable. In principle, however, stable and controllable cell lines capable of tetracycline-induced expression of the gene encoding for Arf6-Q67L may be produced as a possible means of managing the expression levels. We have recently used this method in NIH 3T3 cells to generate double-stranded RNA intracellularly, to knock out glutaredoxin to reveal the physiological function of glutathionylated actin (44).
Finally, it is worth noting that the induced membrane potentials in the systems studied here (∼100 mV) are within range of those previously reported in vesicle and cell systems where microsecond-to-millisecond pulses were used, ∼30 mV (17,36) and ∼1000 mV (42). An earlier report by Benz (45) has also shown charging of planar cholesterol and lipid/cholesterol BLM (bilayer lipid membrane) to at least 600 mV in a charge-pulse relaxation study, demonstrating permeabilization of these membranes is possible with submicrosecond pulses. In addition to these field-induced membrane potentials at various timescales, other factors may also play additional roles in facilitating the observed permeabilizations. For example, Muller (46) has proposed that electrodeformation force due to Maxwell stress at membrane interfaces may promote enlargement of permeabilized membranes when ρe ≠ ρi. Similarly, Kakorin (17,36) have shown substantial reduction (∼10–15-fold) in the critical field-induced membrane potential Δφc for highly curved membranes (i.e., small-sized cells and vesicles). Although it is difficult to assign relative contributions of these effects, if any, to the membrane permeabilizations observed here, our results are not necessarily inconsistent with these earlier studies. In the vesicle system studied here, for example, the salt-filled vesicles may well experience an electrodeformation force in addition to the rapidly induced potential to achieve the selective permeabilization observed at the lower field strength, whereas such force would have no bearing on the sucrose-filled vesicles. On the other hand, in COS-7 cells with the internalized vacuoles, we have shown with our simplified model the possibility of faster charging of the vacuole membrane which may result in its preferential permeabilization. Further consideration of the vacuoles' smaller size, and hence greater membrane curvature, would only facilitate its selective permeabilization even in the case in which the induced membrane voltages are the same on the vacuole and the cell membrane.
In summary, our results demonstrate that nanosecond electric pulses can extend, under appropriate conditions, the range of selective manipulation of cells and vesicles to achieve various degrees of differential electroporation. We expect these findings will enhance the utility of current electric field applications, particularly in cellular research and clinical applications.
Acknowledgments
We thank Dr. Julie Donaldson for providing us the plasmid constructs encoding Arf6-Q67L and PH-GFP, Drs. Fraser Brown and Roberto Weigert for helpful suggestions on COS-7 cell transfection, Jody White and Dr. Peter Blackmore for allowing us access to their fluorescence spectrometer, and Dr. P. Shuck for use of the dynamic light scattering equipment.
APPENDIX
Two membrane capacitances, C1 for the outer cell plasma membrane and C2 for the inner vacuole membrane, are being charged by current from an external voltage source, Uo(t) (Fig. 3 A, bottom; see also Fig. 3 legend). Both membranes are assumed to be nonconductive with respect to the conductivity of surrounding media. The resistances R1–R5 depend on the resistivity of the media and the size of the cell and the intracellular vacuole. Assuming that only small volumes of buffer adjacent to the cell surface contribute to the charging of its membrane capacitance, R1 and R2 correspond to resistances of small layers of media approximately equal to the volume of the cell, R3 to the resistance of cell interior; R4 to resistance of a small volume of buffer of the size of the vacuole; and R5 to the resistance of the vacuole interior.
Application of an external potential difference will result in a current flow around and through the cell interior. If both capacitances initially carry no electric charge, the current going mainly through R1, R3, and R4, and to some extent through C2 and R5, will charge C1, whereas the current through R5 also charges the C2 capacitance. The relative magnitude of these currents is schematically shown on Fig. 3 A as the thickness of the conductors connecting the model components. It should be noted that the current flow through R3 and R4 nodes is only transient, meaning that the field strength inside the cell drops to zero when C1 is fully charged. As a consequence, C2 will discharge through R4 and R5 after reaching some maximal value. In the absence of external voltage, C1 will discharge through R2–R3 nodes.
If the inner vacuole structure is small relative to the enclosing cell, the components R4, R5, and C2 have little effect on the time course of charging the cellular capacitance C1 and can be ignored in the expression for the voltage on it. With initial condition, U0(0) = 0, the membrane voltage U1(t) can be found from the equation
 |
(A1) |
With a voltage step, U0(t) = 1, applied to the circuit input, the solution is given by
 |
(A2) |
where
 |
(A3) |
As described earlier, for a cell of radius a with resistivities of buffer inside and outside the cell ρi and ρe, respectively, and membrane capacitance per unit area Cm, the values of the model components can be chosen according to the following definitions:
 |
(A4) |
Therefore, R1–R3, represent resistance of a buffer layer with thickness a and an area normal to the field of πa2, whereas C1 is the capacitance of the same area of the cell membrane. With these substitutions, the expression for the time constant
 |
(A5) |
becomes identical to the well-known form (Eq. 2). To finalize normalization of this electronic invariant, we note that the parameter α in Eq. A2 stands for the maximal membrane voltage that in theory should be equal to 1.5aE0 at the cell poles. Since there is no explicit limitation on the magnitude of the externally applied voltage U0(t), it can be set to U0(t) = 3aE0. Considering that R1 = R2, the parameter α in Eq. A3 becomes α = 1/2, and Eq. A2 now reads
 |
(A6) |
and is identical to Eq. 1 (when θ = 1, at the pole). It can be seen now that in the absence of a vacuole inside the cell (components R4, R5, and C2 excluded), the remaining resistances R1–R3 form a voltage divider and the voltage across R3 right after application of a pulse (t ≪ τm) becomes
 |
(A7) |
Since R3 corresponds to the buffer layer of thickness a, the field strength inside the cell is
 |
(A8) |
and is equal to E0 when media resistivities inside and outside the cell are the same. Upon complete charging of C1 no further current flows through it and a resistive voltage divider is formed by R1 and R2 only. The voltage across the membrane capacitance is the same as on R2 and is equal to one-half of the applied voltage,
 |
(A9) |
whereas the voltage across R3 is zero, meaning that there is no field inside the cell. In the general case, we can express the field inside the cell as
 |
(A10) |
As mentioned earlier, the components R4, R5, and C2 were excluded from the analysis of the cell membrane voltage because of their negligible effects on U1(t). As long as the vacuole is small, the development of its membrane voltage U2(t) in the intracellular field Ei(t) is governed by the same formalism as the induction of cell membrane voltage U1(t) in an externally applied field E0. Therefore, we used the same circuit again (and Eq. A1) with a straightforward modification, where R4 is substituted for R2, R3 for R1, and R5 for R3 to get the membrane voltage U2(t) from the equation
 |
(A11) |
In this case, the voltage applied to the inner components will be an exponential pulse decaying with the time constant of the outer cellular membrane τm. Because the maximal field strength inside the cell is now equal to Ei(t), and the vacuole radius is denoted as b, the normalized voltage applied to inner model components will be
 |
(A12) |
and the voltage on the vacuole membrane will be
 |
(A13) |
where
 |
(A14) |
The time course of the voltage across the vacuole membrane is a difference between a slow and a fast decaying exponent. Note that R3 in this case represents a layer of buffer with thickness b and ρv is the resistivity of vacuole interior. Making similar substitutions as shown earlier,
 |
(A15) |
the charging time constant for the vacuole membrane becomes
 |
(A16) |
and Eq. A13 takes the form
 |
(A17) |
Fig. 3 B shows model plots of membrane voltage changes for several vacuole/cell size ratios. The input parameters were chosen to reflect the experimental conditions described in this work and are given in the legend to Fig. 3 B. Our model described above, however, does not include any effects due to the dielectric permittivity of water, which could be modeled by shunting every resistance on Fig. 3 A with a properly chosen capacitance. In general, water permittivity is mostly ignored in typical biological buffers with resistivity of 1 Ω m because the charge relaxation time is of the order of ∼5 × 10⁻¹⁰ s. Here, the resistivity of our extracellular media was sufficiently high (∼200-fold of that for cytosol), resulting in a proportional increase in the value for charge relaxation time, so that permittivity effects may not be ignored in this case. The modulus of impedance of a parallel RC circuit at a frequency ω is  times lower than the value of R alone. Here τ = RC is the time constant of the circuit, equal to the charge relaxation time in external media (∼100 ns if re = 200 Ω m). If we set ω to be the inverse of a pulse width ω = 1/(50 × 10−9 s) (worst case estimate), we find a ratio of effective resistivities in Eq. A17 of ∼0.01. The model plot shows that for relatively large vacuoles, b = 0.4a, for example, it is possible to achieve selective electropermeabilization of their membranes.
References
- 1.Bullock, T. H., and W. Heiligenberg (editors). 1986. Electroreception. John Wiley, New York.
- 2.Song, B., M. Zhao, J. V. Forrester, and C. D. McCaig. 2002. Electrical cues regulate the orientation and frequency of cell division and the rate of wound healing in vivo. Proc. Natl. Acad. Sci. USA. 99:13577–13582. [DOI] [PMC free article] [PubMed] [Google Scholar]
- 3.Wang, E., Y. Yin, M. Zhao, J. V. Forrester, and C. D. McCaig. 2003. Physiological electric fields inhibit proliferation of vascular endothelial cells by block at G1. FASEB J. 17:458–460. [DOI] [PubMed] [Google Scholar]
- 4.Astumian, R. D., P. B. Chock, and T. Y. Tsong. 1987. Absorption and conversion from dynamic electric fields by membrane proteins—electroconformational coupling. Studies Biophys. 119:123–130. [Google Scholar]
- 5.Potter, H. 1988. Electroporation in biology: methods, applications, and instrumentation. Anal. Biochem. 174:361–373. [DOI] [PubMed] [Google Scholar]
- 6.Neumann, E., A. E. Sowers, and C. A. Jordan. eds. 1989. Electroporation and Electrofusion in Cell Biology. Plenum Press, New York.
- 7.Tekle, E., R. D. Astumian, and P. B. Chock. 1991. Electroporation by using bipolar oscillating electric fields: an improved method for DNA transfection of NIH3T3 cells. Proc. Natl. Acad. Sci. USA. 88:4230–4234. [DOI] [PMC free article] [PubMed] [Google Scholar]
- 8.Chang, D. C., P. Q. Gao, and B. L. Maxwell. 1991. High-efficiency gene transfection by electroporation using a radiofrequency electric-field. Biochim. Biophys. Acta. 1092:153–160. [DOI] [PubMed] [Google Scholar]
- 9.Al-Atabee, J. S., B. J. Mulligan, and J. B. Powers. 1990. Interspecific somatic hybrids of Rudbeckia hirta and R. laciniata (compositae). Plant Cell Rep. 8:517–520. [DOI] [PubMed] [Google Scholar]
- 10.Karsten, U., P. Stolley, I. Walther, G. Papsdorf, S. Weber, K. Conard, L. Pasternak, and J. Kopp. 1988. Direct comparison of electric field-mediated and PEG-mediated cell fusion for the generation of antibody producing hybridomas. Hybridoma. 7:627–633. [DOI] [PubMed] [Google Scholar]
- 11.Mouneimne, Y., P. F. Tosi, R. Barhoumi, and C. Nicolau. 1991. Electroinsertion of xeno-proteins in red blood cell membranes yields a long lived protein carrier in circulation. Biochim. Biophys. Acta. 1066:83–89. [DOI] [PubMed] [Google Scholar]
- 12.Prausnitz, M. R., V. G. Bose, R. Langer, and J. C. Weaver. 1993. Electroporation of mammalian skin- mechanism to enhance transdermal drug delivery. Proc. Natl. Acad. Sci. USA. 90:10504–10508. [DOI] [PMC free article] [PubMed] [Google Scholar]
- 13.Heller, R., M. J. Jaroszeski, L. F. Glass, J. L. Messina, D. P. Rapaport, R. C. DeConti, N. A. Fenske, R. A. Gilbert, L. M. Mir, and D. S. Reintgen. 1996. Phase I/II trial for the treatment of cutaneous and subcutaneous tumors using electrochemotherapy. Cancer. 77:964–971. [DOI] [PubMed] [Google Scholar]
- 14.Mir, L. M., N. Marsili, J. R. Garbay, V. Billard, C. Robert, and M. Marty. 2003. Electrochemotherapy: a new treatment of solid tumors. J. Exp. Clin. Canc. Res. 22:145–148. [PubMed] [Google Scholar]
- 15.Teissie, J., and T. Y. Tsong. 1981. Electric field induced transient pores in phospholipid bilayer vesicles. Biochemistry. 20:1548–1554. [DOI] [PubMed] [Google Scholar]
- 16.Zhelev, D. V., and D. Needham. 1993. Tension-stabilized pores in giant vesicles: determination of pore size and pore line tension. Biochim. Biophys. Acta. 1147:89–104. [DOI] [PubMed] [Google Scholar]
- 17.Kakorin, S., and E. Neumann. 1998. Kinetics of the electroporative deformation of lipid vesicles and biological cells in an electric field Ber. Bunsenges Phys. Chem. 102:670–675. [Google Scholar]
- 18.Tekle, E., R. D. Astumian, W. A. Friauf, and P. B. Chock. 2001. Asymmetric pore distribution and loss of membrane lipid in electroporated DOPC vesicles. Biophys. J. 81:960–968. [DOI] [PMC free article] [PubMed] [Google Scholar]
- 19.Correa, N. M., and Z. A. Schelly. 1998. Dynamics of electroporation of synthetic liposomes studied using a pore-mediated reaction, Ag+ + Br− → AgBr. J. Phys. Chem. B. 102:9319–9322. [Google Scholar]
- 20.Correa, N. M., H. G. Zhang, and Z. A. Schelly. 2000. Preparation of AgBr quantum dots via electroporation of vesicles. J. Am. Chem. Soc. 122:6432–6434. [Google Scholar]
- 21.Chiu, D. T., C. F. Wilson, F. Ryttsen, A. Stromberg, C. Farre, A. Karlsson, S. Nordohm, A. Gaggar, B. P. Modi, A. Moscho, R. A. Garza-Lopez, O. Arwar, and R. N. Zaré. 1999. Chemical transformations in individual ultrasmall biomimetic containers. Science. 283:1892–1895. [DOI] [PubMed] [Google Scholar]
- 22.Schwan, H. P. 1983. Biophysics of the interaction of electromagnetic energy with cells and membranes. In Biological Effects and Dosimetry of Non-Ionizing Radiation. M. Grandolfo, S.M. Michaelson, and A. Rindi, editors. Plenum Press, New York. 213–231.
- 23.Neumann, E., and K. Rosenheck. 1973. Potential difference across vesicular membranes. J. Membr. Biol. 14:194–196. [Google Scholar]
- 24.Kotnik, T., and D. Miklavicic. 2000. Analytical description of transmembrane voltage induced by electric field on spheroidal cells. Biophys. J. 79:670–679. [DOI] [PMC free article] [PubMed] [Google Scholar]
- 25.Lojewska, Z., D. L. Farkas, B. Ehrenberg, and L. M. Loew. 1989. Analysis of the effect of medium conductance on the amplitude and kinetics of the membrane potentials induced by externally applied electric fields. Biophys. J. 56:121–128. [DOI] [PMC free article] [PubMed] [Google Scholar]
- 26.Tekle, E., R. D. Astumian, and P. B. Chock. 1990. Electro-permeabilization of cell membranes: effect of the resting membrane potential. Biochem. Biophys. Res. Commun. 172:282–287. [DOI] [PubMed] [Google Scholar]
- 27.Hibino, M., H. Itoh, and K. Kinosita, Jr. 1993. Time course of cell electroporation as revealed by submicrosecond imaging of transmembrane potential. Biophys. J. 64:1789–1800. [DOI] [PMC free article] [PubMed] [Google Scholar]
- 28.Schoenbach, K. H., S. Katsuki, R. H. Stark, E. S. Buescher, and S. J. Beebe. 2002. Bioelectrics—new applications for pulsed power technology. IEEE Trans. Plasma Sci. 30:293–300. [Google Scholar]
- 29.Sixou, S., and J. Teissie. 1990. Specific electropermeabilization of leukocytes in a blood sample and application to large volume cells. Biochim. Biophys. Acta. 1028:154–160. [DOI] [PubMed] [Google Scholar]
- 30.Gowrishankar, T. R., and J. C. Weaver. 2003. An approach to electrical modeling of single and multiple cells. Proc. Natl. Acad. Sci. USA. 100:3203–3208. [DOI] [PMC free article] [PubMed] [Google Scholar]
- 31.Schoenbach, K. H., S. J. Beebe, and E. S. Buescher. 2001. Intracellular effect of ultrashort electrical pulses. J. Bioelectromagnet. 22:440–448. [DOI] [PubMed] [Google Scholar]
- 32.Schoenbach, K. H., R. P. Joshi, J. F. Kolb, N. Chen, M. Stacey, P. F. Blackmore, E. S. Buescher, and S. J. Beebe. 2004. Ultrashort electrical pulses open a new gateway into biological cells. Proc. IEEE. 92:1122–1137. [Google Scholar]
- 33.Moscho, A., O. Orwar, D. T. Chiu, B. P. Modi, and R. N. Zare. 1996. Rapid preparation of giant unilamellar vesicles. Proc. Natl. Acad. Sci. USA. 93:11443–11447. [DOI] [PMC free article] [PubMed] [Google Scholar]
- 34.Hope, M. J., M. B. Bally, G. Webb, and P. R. Cullis. 1985. Production of large unilamellar vesicles by a rapid extrusion procedure—characterization of size distribution, trapped volume and ability to maintain a membrane-potential. Biochim. Biophys. Acta. 812:55–65. [DOI] [PubMed] [Google Scholar]
- 35.Tekle, E., and Z. A. Schelly. 1994. Modeling the electric birefringence relaxations of AOT/Isooctane/H2O water-in-oil microemulsions. J. Phys. Chem. 98:7657–7664. [Google Scholar]
- 36.Kakorin, S., E. Redeker, and E. Neumann. 1998. Electroporative deformation of salt-filled lipid vesicles. Eur. Biophys. J. 27:43–53. [Google Scholar]
- 37.Vernier, T. P., A. Li, L. Marcu, C. M. Craft, and M. A. Gundersen. 2003. Ultrashort pulsed electric fields induce membrane phospholipids translocation and caspase activation: differential sensitivities of Jurkat T lymphoblasts and Rat Glioma C6 cells. IEEE Trans Dielectr. Electr. Insul. 10:795–809. [Google Scholar]
- 38.Beebe, S. J., P. M. Fox, L. J. Rec, L. K. Willis, and K. H. Schoenbach. 2003. Nanosecond high intensity pulsed electric fields induce apoptosis in human cells. FASEB J. 30:286–292. [DOI] [PubMed] [Google Scholar]
- 39.Vernier, T. P., Y. H. Sun, L. Marcu, C. M. Craft, and M. A. Gundersen. 2004. Nanoelectropore-induced phosphatidylserine translocation. Biophys. J. 86:4040–4048. [DOI] [PMC free article] [PubMed] [Google Scholar]
- 40.Brown, F. D., A. L. Rozelle, H. L. Yin, T. Balla, and J. G. Donaldson. 2001. Phosphatidylinositol 4,5-bisphosphate and Arf-regulated membrane traffic. J. Biol. Chem. 154:1007–1017. [DOI] [PMC free article] [PubMed] [Google Scholar]
- 41.White, J. A., P. F. Blackmore, K. H. Schoenbach, and S. J. Beebe. 2004. Stimulation of capacitative calcium entry in HL-60 cells by nanosecond pulsed electric fields. J. Biol. Chem. 279:22964–22972. [DOI] [PubMed] [Google Scholar]
- 42.Hibino, M., M. Shigemori, H. Itoh, K. Nagayama, and K. Kinosita, Jr. 1991. Membrane conductance of electroporated cell analyzed by submicrosecond imaging of transmembrane potential. Biophys. J. 59:209–220. [DOI] [PMC free article] [PubMed] [Google Scholar]
- 43.Okada, C. Y., and M. Rechsteiner. 1982. Introduction of macromolecules into cultured mammalian cells by osmotic lysis of pinocytic vesicles. Cell. 29:33–41. [DOI] [PubMed] [Google Scholar]
- 44.Wang, J., E. Tekle, H. Oubrahim, J. J. Mieyal, E. R. Stadtman, and P. B. Chock. 2003. Stable and controllable RNA interference: investigating the physiological function of glutathionylated actin. Proc. Natl. Acad. Sci. USA. 100:5103–5106. [DOI] [PMC free article] [PubMed] [Google Scholar]
- 45.Benz, R., F. Beckers, and U. Zimmermann. 1979. Reversible electrical breakdown of lipid bilayer membranes: a charge-pulse study. J. Membr. Biol. 48:181–204. [DOI] [PubMed] [Google Scholar]
- 46.Muller, K. J., V. L. Sukhorukov, and U. Zimmermann. 2001. Reversible electropermeabilization of mammalian cells by high-intensity, ultra-short pulses of submicrosecond duration. J. Membr. Biol. 184:161–170. [DOI] [PubMed] [Google Scholar]