

Abstract
In the recently published x-ray crystal structure of the “bicelle” bacteriorhodopsin (bbR) crystal, the protein has quite a different structure from the native and the in cubo bacteriorhodopsin (cbR) crystal. Instead of packing in parallel trimers as do the native membrane and the cbR crystals, in the bbR crystal the protein packs as antiparallel monomers. To date, no functional studies have been performed, to our knowledge, to investigate if the photocycle is observed in this novel protein packing structure. In this study, both Raman and time-resolved transient absorption spectroscopy are used to both confirm the presence of the photocycle and investigate the deprotonation-reprotonation kinetics of the Schiff base proton in the bbR crystal. The observed rates of deprotonation and reprotonation processes of its Schiff base have been compared to those observed for native bR under the same conditions. Unlike the previously observed similarity of the rates of these processes for cbR crystals and those for native bacteriorhodopsin (bR), in bbR crystals the rate of deprotonation has increased by 300%, and the rate of reprotonation has decreased by nearly 700%. These results are discussed in light of the changes observed when native bR is delipidated or monomerized by detergents. Both the change of the hydrophobicity of the environment around the protonated Schiff base and Asp85 and Asp96 (which could change the pKa values of proton donor-acceptor pairs) and the water structure in the bbR crystal are offered as possible explanations for the different observations.
INTRODUCTION
The photocycle of native bacteriorhodopsin (bR) was studied in the mid-1970s (1) and is well documented in the literature. Upon the absorption of light by the all-trans retinal chromophore of bR, isomerization occurs as the first step in the photocycle that forms different intermediates of lifetimes ranging from picoseconds to milliseconds and then results in the transfer of a proton from the cytoplasmic to the extracellular side of the membrane with intermediates with well-characterized visible absorption spectra (2–19):
|
|
At a critical step in the cycle, a proton is transferred from the protonated Schiff base (PSB) of the retinal to a nearby Asp85 residue in the hydrophilic channel, resulting in the only deprotonated retinal intermediate in the cycle, the M intermediate. In the M intermediate the absorption of the retinal is at 412 nm (5,20,21). The formation of the M intermediate is accompanied by the appearance of a proton on the extracellular surface. The retinal Schiff base is then reprotonated in a subsequent step with a proton from the Asp96 residue of the hydrophobic channel. The Asp96 residue is also reprotonated by the end of the process, both ready for another turn of the cycle. The only light-dependent event in the photocycle is the initial all-trans to 13-cis isomerization of retinal. All subsequent steps are thermal transformation processes (5).
In the native membrane, the bR molecules are arranged as hexagonal sheets of parallel trimers consisting of three monomer units each in a hexagonal unit cell 63 Å in diameter. Within each monomer, the retinal molecule lies in a plane that makes a small angle to the plane perpendicular to the helix axis and is attached to the protein via a PSB at Lys216 of helix G (7,22,23). Retinal separates the hydrophilic extracellular region (containing many polar side chains and bound water molecules) from the more hydrophobic cytoplasmic region (24).
In 1996, Rosenbusch and Landau published their in cubo crystallization method for bR (25) with the protein structure refined in 1997 to 2.5 Å (26). In the in cubo bacteriorhodopsin (cbR) crystals, as in the native membrane, the parallel trimer structure is present and protein contacts are mediated by organized lipids. Time-resolved Fourier transform infrared (FTIR) difference spectroscopy was performed on the hexagonal cbR crystals in which the time-resolved vibrational intensities of several marker bands associated with the M intermediate are measured. The time traces for the kinetics of the cbR crystals were essentially the same as those observed for the native membrane (27).
In 2003, Heyes and El-Sayed published their findings on how both partial and complete removal of lipids from the native membrane affected the kinetics of M rise and decay (28). Since in the bbR crystals the native lipids are almost completely removed (29), it is worthwhile to discuss their findings for comparison. They remind the reader that partial delipidation of the native membrane (75% of native lipids removed) maintains the trimer unit cell while reducing the unit cell dimensions (30). Complete lipid removal results in a loss of the trimer structure altogether, resulting in monomerization of the protein (28).
In the partially delipidated protein with the smaller trimer unit cell dimensions, the M rise and decay time were extended (28). In contrast, the completely delipidated protein in which the trimer structure is gone and the monomers were free in solution resulted in a faster M rise relative to the native membrane and about the same M decay time as the native, which still has its larger trimer structure intact (28).
In 2002, Bowie and Farham developed a new bR “bicelle” crystallization technique (29). In contrast to both the native membrane and to the cbR crystals studied by Rosenbusch and Landau (27), in these bicelle bR (bbR) crystals the trimer structure is no longer present, and the protein monomers are arranged in an antiparallel arrangement (29). A comparison of the structure of the bbR crystals with that of the cbR crystals performed by Bowie and Farham (29) emphasizes differences in the protein packing between these two crystal forms. For the bbR crystals, the packing structure is not one of parallel trimers but of antiparallel monomers that exhibit a vertical displacement relative to one another within the plane (29).
In the bbR crystals, we are dealing with a detergent-solubilized protein, one in which the native lipid membrane is no longer present. In this respect the protein within the bbR crystal is similar to both the detergent-monomerized bR examined by Heyes and El-Sayed (28) and to the cbR crystals examined by Rosenbusch and Landau (27,31). However, the structure of the protein within the bbR crystal differs from both of these examples on key points. In contrast to the detergent-monomerized bR that consists of protein monomers free in solution, in the bbR crystals the individual protein monomers are not free in solution but locked into a crystal structure with set unit dimensions. In contrast to the cbR crystal consisting of parallel trimers, in the bbR crystal we have an antiparallel arrangement of monomers. The question then arises as to what effects this drastic change in the structure and environment of the bR protein has on its deprotonation/protonation function.
In this study, both resonance Raman and time-resolved transient spectroscopy are used to determine 1), if the bbR crystals are capable of undergoing the photocycle, and 2), how the deprotonation-reprotonation kinetics compare to those for the detergent-solubilized, cbR crystals, and native bR. It is found that the photocycle is indeed present in the bbR crystals. Compared to these rates in both native and cbR crystals, the deprotonation of the PSB is much faster and the reprotonation of the Schiff base is much slower. Possible explanations for the observed differences are qualitatively discussed in terms of hydration effects and pKa values for the bbR crystals.
MATERIALS AND METHODS
Sample preparation
The bR samples were obtained from a cell line of Halobacterium salinarium and were purified by established procedures (3). Diamond-shaped bR bicelle crystals were made by the method of Bowie et al. (32) with the following modifications: the precipitant well solution was made by mixing 4.0 M NaH2PO4, H2O, and 6.0 M 1,6-hexanediol in a 29:1:1.4 volume ratio, and it was this precipitant solution that was mixed with the 8.0 mg/mL bR/8% bicelles mixture (32). The concentration of bR was adjusted to ∼10 mg/mL by monitoring the absorbance of the light-adapted (20 min light exposure using a 40 W bulb) bR sample at 570 nm until the absorbance spectrum was constant.
The samples were monitored periodically for the next 2 weeks as the relatively fluid mixture suspension slowly gelled during equilibration between the suspended solution and the saturated solution underneath. The slides were then examined by light microscopy for evidence of crystal growth. Typical diamond-shaped crystals, having dimensions of 100 μm × 200 μm, are shown in Fig. 1.
FIGURE 1.
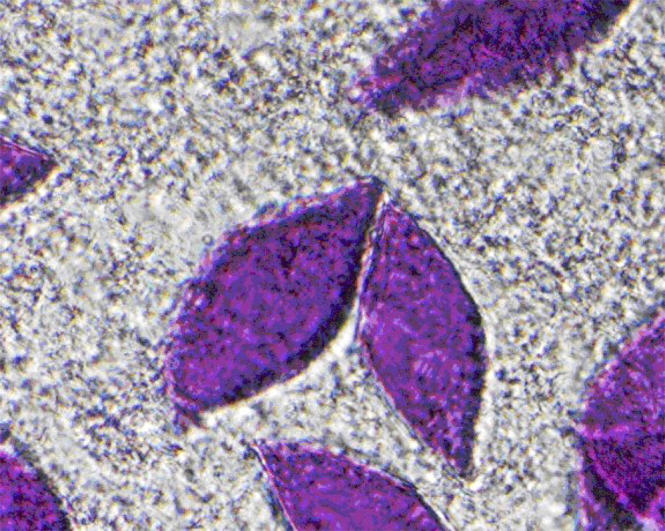
Typical diamond-shaped crystals produced in our lab, each having dimensions of 100 μm × 200 μm, grown by the method of Bowie et al. (29,32) The crystals are pictured here within the detergent matrix.
Crystals were collected by repeated washing of the crystal-detergent matrix with deionized distilled water (DDW) into microcentrifuge tubes. The higher-density crystals settled to the bottom of the solution within a matter of minutes, whereas the white detergent flakes remained suspended in the supernatant, which was easily removed. Washing the crystals in this manner removed the bulk detergent while leaving the crystals intact. For the Raman experiments, after washing, a concentrated drop of the crystal suspension was placed on a glass coverslip covered with aluminum foil, and the sample was allowed to dry at room temperature under ambient light until the bulk water above the drop had evaporated, immobilizing the crystal on the surface. After the crystals were dried to the glass slide, a drop of DDW was added to the crystal before the Raman spectrum was taken.
For the flash photolysis experiments, crystals were placed at the bottom of a solution of DDW, with the pump and probe light being directed from the top down through this well and then to the detector. A multi-well sample holder with an optically clear and flat surface was needed to examine several different samples quickly. Such a multi-well sampling system was designed by taking a rectangular microscope slide and using spray adhesive to attach a piece of rubber matting ∼2 mm thick. This rubber matting contained holes punched through it (before its attachment to the glass) that were each ∼3–4 mm in diameter. After washing the crystals as described above, a concentrated drop of the crystal suspension in DDW was placed in a well of the sampling tray. A glass coverslip was sealed with vacuum grease over the well to prevent evaporation of the water during the experiment.
Instrumentation and data analysis
Raman spectra of single crystals were acquired using a Renishaw in Via Raman spectrometer running the WiRE 2.0 software package (Renishaw, Gloucestershire, UK). The sampling area was ∼1 μm2. To ensure that the hydration level of all samples remained uniform, all Raman spectra were taken by submerging the objective underwater to obtain the spectrum of the native film or the single crystal. The intense Raman band at 520 cm−1 of a silicon wafer was used for automatic wavelength calibration by the software. A 514 nm laser was used with a maximum power output at the sample of 25 mW. All data presented were imported as x-y data first to OMNIC E.S.P. 5.2 for baseline correction, and then transferred to the Microcal Origin 7.0 software package (Microcal Software, Northhampton, MA).
Transient absorption experiments were carried out using the frequency doubled output of a Q-switched nanosecond-pulsed Nd:YAG laser (Spectra Physics Quanta-Ray Series, Mountain View, CA) providing 1-mJ pulses of 532 nm light and 10 ns pulse width with a 10 Hz repetition rate. Monitoring light was provided by a Xenon arc lamp (PTI, Lawrenceville, NJ) running in CW mode. The output of the lamp was focused onto one end of a fiber optic cable, and the output from the other end of the cable was directed toward the sample, focused to a ∼2 mm diameter spot at the sample, recollected, and focused onto another fiber optic that directed the transmitted light to the entrance slit of the monochromator. The monochromator (Acton Research 300i, Acton, MA) wavelength was fixed at 412 nm. A filter was placed in front of the entrance slit of the monochromator to remove any 532 nm excitation light while allowing passage of the 412 nm light. Single wavelength kinetics monitored at 412 nm were recorded using a photomultiplier tube (Hamamatsu, Hamamatsu City, Japan) coupled to the laser pulses. The PMT has a rise time of 1 μs, and this response was digitized using a LeCroy 9350A 500 MHz oscilloscope (LeCroy 9350A, Chestnut Ridge, NJ). The laser Q-switch triggers data acquisition by the LeCroy 9350 oscilloscope at a frequency of 10 Hz.
The Winspec32 software program (Roper Scientific, Trenton, NJ) was used to select the monochromator wavelength. The Scope Explorer v2.16 software program (Lecroy, New York, NY) was used to convert the waveform traces into XY format, which were plotted and fitted using the Origin software package (OriginLab, Northampton, MA) In all cases, attempts were made to fit the rise and decay data for both samples to both a monoexponential and a biexponential decay, and the fits with the higher R2 values and lowest error were chosen.
RESULTS
Fig. 2 shows the intensity changes in the Raman spectrum of a single hydrated bbR crystal under increasing power of the incident 514 nm laser. The inset demonstrates how the ratio of the intensity of the 1562 cm−1 band (the C=C stretch of M) to that of the 1525 cm−1 band (the vibration of the parent bbR) increases with increasing 514 nm laser power, indicating an increase in the M population. This is the first evidence for the production of the M intermediate within the crystals and strong support that bbR undergoes a photocycle leading to the deprotonation of the PSB.
FIGURE 2.

Intensity changes in the Raman spectrum of a single hydrated bicelle crystal under increasing power of the incident 514 nm laser. (Inset) Ratio of the intensity of the 1562 cm−1 band (the C=C stretch of M) to that of the 1525 cm−1 band (the same vibration for the ground state) with increasing 514 nm laser power indicates that increasing the 514 nm laser power does indeed increase the M population and promotes the photocycle of the bbR crystal.
Fig. 3 compares the M rise kinetics as a measure of the intensity of the signal monitored at 412 nm (expressed here as I412) for crystals suspended in DDW and for a native solution of bR suspended in DDW. Fig. 4 compares the decay rates of this same process for the same two samples in DDW. The data have been normalized for ease of comparison. In both the native and the bbR crystals, the M rise data fit best to a biexponential expression. In the native sample, the M decay fit best to a biexponential expression, whereas in the bbR crystals the M decay data fit best to a monoexponential. These times are reported in Table 1, along with times previously reported by Heyes and El-Sayed (28) for both native bR in DDW detergent-treated native membrane.
FIGURE 3.

Comparison of M rise kinetics in DDW, expressed as the intensity of the 412 nm absorption. Both the native and the bicelle crystals fit to a biexponential rise, with an average rise time for the native sample of 83 μs and an average rise time for the crystals of 24 μs. The crystals have a rise time for the M intermediate that is three times faster relative to the M rise in the native sample.
FIGURE 4.

Comparison of M decay kinetics in DDW, expressed as the intensity of the 412 nm absorption. The M decay for the native solution fits best to a biexponential expression with an average decay time of 10 ms, whereas that for the bicelle crystals fits best to a monoexponential expression with an average decay time of 73 ms—a decay time over seven times slower than observed in native bR.
TABLE 1.
Kinetic parameters for M rise and decay for both native bR and bbR in DDW
| Sample | τ1 (A1) | τ2 (A2) | M rise τavg | τ1 (A1) | τ2 (A2) | M decay τavg |
|---|---|---|---|---|---|---|
| Native bR in DDW | 16 μs (0.09) | 90 μs (0.91) | 83 μs | 6 ms (0.72) | 20 ms (0.28) | 10 ms |
| Bicelle crystals in DDW | 3 μs (0.99) | 24 μs (0.01) | 24 μs | 73 ms | ——— | 73 ms |
| Native bR in DDW* | 8.49 μs (0.21) | 75.8 μs (0.79) | 61.7 μs | 8.57 ms | ——— | 8.57 ms |
| Native + CHAPS in DDW* | 23.5 μs (0.49) | 137 μs (0.51) | 81.4 μs | 27.7 ms | ——— | 27.7 ms |
| Native + Trition in DDW* | 1.76 μs (0.42) | 9.71 μs (0.58) | 6.71 μs | 9.47 ms (0.96) | 34.0 ms (0.04) | 10.5 ms |
τavg is calculated by τavg = (A1 × τ1) + (A2 × τ2), where A1 + A2 = 1. Data are presented as a time component (τ) with the relative contribution to the overall process (A) in parentheses.
From Heyes and El-Sayed (28).
From Fig. 3 it is observed that the M rise kinetics for the bbR crystals is faster than it is for the native sample. The average time for M rise in native is 83 μs: a two-component rise with τ1 = 16 μs (9% contribution) and τ2 = 90 μs (91% contribution).
For the bbR crystals the total time for M rise is 24 μs; a two-component rise with τ1 = 3 μs (1% contribution) and τ2 = 24 μs (99% contribution). The bbR crystal's average M rise time is over three times faster than in the native sample. The data for both the native and the bbR samples fits best to a biexponential M rise, consistent with the literature (33).
From Fig. 4, it is observed that the M decay for the bbR crystals is slower than it is for the native sample. These data for the native fit best to a biexponential decay, whereas the decay data for the bbR crystals fit best to a monoexponential expression. As mentioned in the introduction, the M decay data for native bR have been characterized in the literature as either a monoexponential (28,34) or a biexponential process, with a total decay time in the tens of milliseconds (33,35). Here the average time for M decay in native is 10 ms; a two-component decay with τ1 = 6 ms (72% contribution) and τ2 = 20 ms (28% contribution). For the bbR sample, the average time for M decay is much longer and monoexponential, with a total decay time of 73 ms. This M decay is over seven times slower for the bbR crystals than it is in the native.
It is interesting to note that whereas the M rise of the bbR crystals is ∼3 times faster than it is in the native membrane, the M decay is over seven times slower relative to native. As stated before in the introduction, the M rise process involves the movement of a proton from the PSB to Asp85, which in the native membrane is located only 4–5 Å below the Schiff base (17,18). Any environmental or structural difference in the bicelle structure relative to the native that facilitates the transfer of the Schiff base proton to Asp85 would result in faster M rise. Likewise, any structural or environmental differences relative to the native that hinder the transfer of a proton from the Asp96 residue to the deprotonated Schiff base would result in slower M decay.
It is important to mention that in native bR, the existence of at least two species of M intermediate present with different lifetimes was first reported in 1975 (36), a finding that has been repeatedly confirmed (37). The rise of the M intermediate in native bR is often characterized as fitting to a biexponential curve (33,35), whereas decay time for the M intermediate has been characterized as both a mono- (34,28,38) and a biexponential (33,35) process. In native bR, two primary models have been presented to account for the biexponential rise. The first model is of that of parallel photocycles: that there are two different ground state bR species, each going through their own photocycle with the same spectral intermediates (39–41). The other model assumes that there is only one photocycle but that there is a transition between two M states, M1 and M2, that is spectrally silent in the visible region (35,42–44). During the M1 → M2 transition, the Schiff base redirects its orientation from the extracellular to the cytoplasmic half-channel (45) when it accepts the proton from Asp96, the only ionizable residue in the cytoplasmic half-channel (18).
In its native form, the purple membrane is 75% protein and 24% lipid by weight, with ∼10 lipid molecules per bR monomer (46). The protein units are arranged as parallel trimers. In contrast, in the bbR crystal form of this protein all the native lipids are removed, the trimer cell unit is lost, and the bR protein molecules are arranged in an antiparallel form. As stated in the introduction, the removal of the native lipids of the bilayer surrounding the protein trimers has been demonstrated to alter the M kinetics. Jang and El-Sayed found that removing 75% of the lipid from the protein (which results in a tighter trimer unit cell; 30) results in both a decrease in the amount of M produced and a reduction of the rate of M rise from the biexponential rise times of 7.2 μs (15% contribution) and 57 μs (85% contribution) observed in the native membrane to 18 μs (37% contribution) and 115 μs (63% contribution) for the 75% delipidated sample under the same temperature and pH conditions (34). They also found that in these tighter trimer unit cells, the M decay rate slows down from a time of 3.9 ms in the native sample to 55 ms (34).
Later, Heyes and El-Sayed again examined the M rise and decay effects resulting from the tighter trimer unit cell created as above and the effect of monomerization of the membrane, in which the trimer structure is no longer present (28). As mentioned in the introduction, they found that the tighter trimer unit cell displayed both a slower M rise and M decay, whereas loss of the trimer structure altogether in the monomerized protein resulted in a faster M rise and a recovery of the M decay time to that of native (28). In addressing the M rise data, they speculated that the slower M rise in the tighter trimer unit cell and the faster M rise in the monomerized protein may be caused either by 1), different pKa values between the Schiff base (SB) and Asp85 between these two samples, or 2), a difference in water access to the cavity. In addressing the pKa difference, they argue that if in the tighter trimer unit cell the pKa difference between the SB and Asp85 is not very large, the proton transfer reaction between these two would be inhibited; however in the monomerized sample, if the pKa difference between the SB and Asp85 is very large the proton transfer reaction would be enhanced. In addressing the point about water access to the cavity, they reason that in the tighter trimer unit cell the access to water would be more restricted compared to the native membrane's larger trimer unit cell, resulting in a more hydrophobic environment through which the proton would have to travel between the SB and Asp85, slowing down the process. In the monomerized sample they reason that the loss of the trimer unit cell altogether allows water greater access to this cavity, providing a more hydrophilic environment in which the proton could travel than in the tighter trimer unit cell (28).
In addressing the M decay data, the authors speculated that the slower M decay in the tighter trimer unit cell and the faster M decay in the monomerized protein may be caused by the difference in conformational freedom between these two samples. They speculate that the protein situated within the tighter trimer unit cell has less conformational freedom than the monomerized protein in which the trimer structure is no longer present and that it is this reduction in conformational freedom in the tighter trimer unit cell that inhibits the necessary rotation of retinal from the cytoplasmic to extracellular side that enables the retinal to accept the proton from Asp96 during the reprotonation process (28). Their work demonstrates the role native lipids play in determining photocycle kinetics by possibly affecting both the pKa values of the proton donor-acceptor groups and the hydrophobicity of the retinal binding pocket.
In the cbR crystals studied by Rosenbusch and Landau, as in the native membrane, the parallel trimer structure is present and protein contacts are mediated by organized lipids. As mentioned in the introduction, FTIR performed on the hexagonal cbR crystals, in which the time-resolved vibrational intensities of several marker bands associated with the M intermediate are measured, revealed that the time traces for the kinetics of the cbR crystals were essentially the same as those observed for the native membrane (27). The presence of the trimer structure of the protein units in both the native membrane and within the cbR crystals was the explanation given for these observations, a claim the authors backed up by citing the work of Danshina (47) in which monomeric bR created by solubilizing with detergent solution exhibits a longer-lived photocycle.
In contrast, the structure of the protein within the native membrane or in the cbR crystals, the packing structure of the bbR crystals is not one of parallel trimers but of antiparallel monomers. As was addressed in the case of the bicelle crystallization technique, this process removes nearly all the native lipids so that from the x-ray crystal structure, only one bound lipid per monomer remains (29).
The M rise data for the bbR crystals presented here demonstrate an increase in the deprotonation rate (faster M rise) relative to the native membrane. This rate increase was also observed by Heyes and El-Sayed (28) upon exposure of native bR to Trition detergent. In both cases there is a loss of the trimer packing structure. However, in the case of the native bR monomerized by Trition, the monomers are free in solution; in the bbR crystals the monomers are arranged within a crystals lattice, oriented in an antiparallel fashion.
One explanation for this observation may involve changes in the pKa values of the Schiff base proton donor and the Asp85 proton acceptor in the different environments. Of course, the environment itself would be affected by whether the trimer structure is preserved or not and on the type of detergent used in monomerization or delipidation of native bR. In discussing the M rise (the deprotonation of the PSB), a change in the pKa value of either the PSB or the Asp85 could lead to a change in the rate of the deprotonation step. For an acid dissociation constant, one can show that the acid dissociation constant Ka is related to the rate constants of deprotonation and reprotonation by the equation
 |
Thus in an environment which is more hydrophilic, the PSB becomes more acidic and the rate of deprotonation increases. It is likely that the trimer structure keeps the environment more hydrophobic, thus making the rate of deprotonation slow. It becomes slower if the trimer structure is reduced in size, thus becoming more effective in protecting the hydrophobic environment of the PSB. By destroying the trimer structure, the open structure becomes more accessible to water and the environment becomes more hydrophilic. This could explain the increase in the rate of the deprotonation of the PSB upon monomerization of bR. These results suggest that the PSB in the L550 intermediate of bbR may have a lower pKa in the antiparallel monomer structure than in the trimer structure of native bR or in the cbR crystal, making deprotonation of the PSB more favorable.
As mentioned before, the M rise process involves the donation of a proton from the PSB to Asp85 (48,49). In the literature, a change in the difference in pKa between the PSB and the Asp85 makes this donation possible (50). In native bR, the pKa value for the Schiff base has been calculated by Druckmann et al. (51) to be 13.3 ± 0.3 for the PSB in the parent molecule, a value later confirmed by Sheves et al. (52). The pKa value for the Asp85 is found to be 2.6 (53–55). This PSB pKa of 13.3 and the low Asp85 pKa of 2.6 means that in the light-adapted ground state the Schiff base is protonated and the Asp85 is deprotonated.
In native bR, the pKa value of the L550 intermediate drops to ≤2.6 for the Schiff base (56)—a decrease in the pKa value of the PSB of nearly 11 units. This drastic pKa change reduces the affinity of the Schiff base for the proton, making proton donation from the Schiff base to Asp85 more favorable, and a proton is donated from the Schiff base to Asp85 in this M rise step.
Perhaps in the bbR crystals, the loss of the parallel trimer structure in some way affects these pKa values. It may be the case that in the light-adapted ground state of the bbR crystals, the pKa value for the Schiff base is below the 13.3 value of the native, making proton donation more favorable and thus making M rise faster. On the other hand, instead of having a lower pKa for the PSB, in the bbR crystals the pKa of the Asp85 acceptor may be higher, making this proton acceptor in the bbR crystals a better proton acceptor. It may be the case that the loss of trimer structure by any means (disruption of trimer structure by Trition or by crystallization as antiparallel monomers) results in a decrease in the pKa difference between the Schiff base and Asp85, which in turn results in faster M rise kinetics.
The “two M states” model assumes that the M intermediate actually consists of two M species, M1 and M2. The transition between M1 and M2 was optically silent in the visible region (21,35,42–44) and results in the redirection of the Schiff base after the deprotonation process from the extracellular side (where Asp85 is located) to the cytoplasmic side (where Asp96 is located; 20,45). The above discussion of the M rise results applies to the M1 species in this model.
As mentioned before, the M decay process involves the transfer of a proton from the protonated Asp96 residue in the cytoplasmic channel to the deprotonated Schiff base (48,57) in M2. There are a number of processes involved in this transfer process, any one of them could be or become rate limiting and could slow down the rate in bbR. First, a change in the rate of the deprotonation rate of the Asp96 could result from a change in its pKa. Second, a change in the rate of transfer of the proton from the Asp96 to the Schiff base could result in a slower M decay process. It has been proposed (58–60) that the reprotonation of the Schiff base by Asp96 takes place via a hydrogen-bonded chain of water molecules. A change in the structure of the water hydrogen bonded network could change the transfer rate. Third, a change in the relative orientation of the unprotonated Schiff base in the M2 type intermediate with respect to this water chain could result in a slower M decay process. Of course, the mechanism of the transfer process itself could be different and involve the diffusion of the proton from where Asp96 is to the Schiff base in M2. Finally, the distance between Asp96 and the Schiff base in M2 in the bbR could be greater than it is in the native and in the cbR forms. If this is the case, then the distance the proton would have to travel from the Asp96 to the Schiff base would be longer, which could result in a longer decay time. It is difficult to conclude which process is rate limiting, but it is easy to understand that small changes in the environment could lead to a large change in the rate of this process.
Acknowledgments
The authors thank Dr. Colin Heyes in the initial synthesis efforts of bbR crystals.
The authors thank the Chemical Sciences, Geosciences, and Biosciences Division, Office of Basic Energy Science, Office of Sciences, U.S. Department of Energy (under grant DE-FG02-97ER14799).
References
- 1.Goldschmidt, C. R., M. Ottolenghi, and R. Korenstein. 1976. On the primary quantum yields in the bacteriorhodopsin photocycle. Biophys. J. 16:839–843.M [DOI] [PMC free article] [PubMed] [Google Scholar]
- 2.Fodor, S. P., J. B. Ames, R. Gebhard, E. M. van den Berg, W. Stoeckenius, J. Lugtenburg, and R. A. Mathies. 1988. Chromophore structure in bacteriorhodopsin's N intermediate: implications for the proton-pumping mechanism. Biochemistry. 27:7097–7101. [DOI] [PubMed] [Google Scholar]
- 3.Oesterhelt, D., and B. Hess. 1973. Reversible photolysis of the purple complex in the purple membrane of Halobacterium halobium. Eur. J. Biochem. 37:316–326. [DOI] [PubMed] [Google Scholar]
- 4.Stoeckenius, W., and R. H. Lozier. 1974. Light energy conversion in Halobacterium-halobium. J. Supramol. Struct. 2:769–774. [DOI] [PubMed] [Google Scholar]
- 5.Lozier, R. H., R. A. Bogomolni, and W. Stoeckenius. 1975. Bacteriorhodopsin, a light-driven proton pump in Halobacterium halobium. Biophys. J. 15:955–962. [DOI] [PMC free article] [PubMed] [Google Scholar]
- 6.Jan, L. Y. 1975. Isomeric configuration of the bacteriorhodopsin chromophore. Vision Res. 15:1081–1086. [DOI] [PubMed] [Google Scholar]
- 7.Henderson, R. 1977. The purple membrane from Halobacterium halobium. Annu. Rev. Biophys. Bioeng. 6:87–109. [DOI] [PubMed] [Google Scholar]
- 8.Stoeckenius, W., R. H. Lozier, and R. A. Bogomolni. 1979. Bacteriorhodopsin and the purple membrane of halobacteria. Biochim. Biophys. Acta. 505:215–278. [DOI] [PubMed] [Google Scholar]
- 9.Michel, H., and D. Oesterhelt. 1976. Light-induced changes of the pH gradient and the membrane potential in H. halobium. FEBS Lett. 65:175–178. [DOI] [PubMed] [Google Scholar]
- 10.Bakker, E. P., H. Rottenberg, and S. R. Caplan. 1976. An estimation of the light-induced electrochemical potential difference of protons across the membrane of Halobacterium halobium. Biochim. Biophys. Acta. 440:557–572. [DOI] [PubMed] [Google Scholar]
- 11.Belyakova, T. N., J. Kadziauskas, V. P. Skulachev, I. A. Smirnova, L. N. Chekulaeva, and A. Jasaitis. 1975. Generation of hydrogen(1+) ion electrochemical potential and photophosphorylation in Halobacterium halobium cells. Dokl. Akad. Nauk SSSR. 223:483–486. [PubMed] [Google Scholar]
- 12.Lewis, A., J. Spoonhower, R. A. Bogomolni, R. H. Lozier, and W. Stoeckenius. 1974. Tunable laser resonance Raman spectroscopy of bacteriorhodopsin. Proc. Natl. Acad. Sci. USA. 71:4462–4466. [DOI] [PMC free article] [PubMed] [Google Scholar]
- 13.Braiman, M., and R. Mathies. 1982. Resonance Raman spectra of bacteriorhodopsin's primary photoproduct: evidence for a distorted 13-cis retinal chromophore. Proc. Natl. Acad. Sci. USA. 79:403–407. [DOI] [PMC free article] [PubMed] [Google Scholar]
- 14.Mathies, R. A., C. H. Brito Cruz, W. T. Pollard, and C. V. Shank. 1988. Direct observation of the femtosecond excited-state cis-trans isomerization in bacteriorhodopsin. Science. 240:777–779. [DOI] [PubMed] [Google Scholar]
- 15.Pollard, W. T., C. H. Cruz, C. V. Shank, and R. A. Mathies. 1989. Direct observation of the excited-state cis-trans photoisomerization of bacteriorhodopsin: multilevel line shape theory for femtosecond dynamic hole burning and its application. J. Chem. Phys. 90:199–208. [Google Scholar]
- 16.Ames, J. B., and R. A. Mathies. 1990. The role of back-reactions and proton uptake during the N—O transition in bacteriorhodopsin's photocycle: a kinetic resonance Raman study. Biochemistry. 29:7181–7190. [DOI] [PubMed] [Google Scholar]
- 17.Braiman, M. S., T. Mogi, T. Marti, L. J. Stern, H. G. Khorana, and K. J. Rothschild. 1988. Vibrational spectroscopy of bacteriorhodopsin mutants: light-driven proton transport involves protonation changes of aspartic acid residues 85, 96, and 212. Biochemistry. 27:8516–8520. [DOI] [PubMed] [Google Scholar]
- 18.Gerwert, K., B. Hess, J. Soppa, and D. Oesterhelt. 1989. Role of aspartate-96 in proton translocation by bacteriorhodopsin. Proc. Natl. Acad. Sci. USA. 86:4943–4947. [DOI] [PMC free article] [PubMed] [Google Scholar]
- 19.Varo, G., and J. K. Lanyi. 1991. Thermodynamics and energy coupling in the bacteriorhodopsin photocycle. Biochemistry. 30:5016–5022. [DOI] [PubMed] [Google Scholar]
- 20.Oesterhelt, D., and W. Stoeckenius. 1973. Functions of a new photoreceptor membrane. Proc. Natl. Acad. Sci. USA. 70:2853–2857. [DOI] [PMC free article] [PubMed] [Google Scholar]
- 21.Lanyi, J. 1993. Proton translocation mechanism and energetics in the light-driven pump bacteriorhodopsin. Biochim. Biophys. Acta. 1183:241–261. [DOI] [PubMed] [Google Scholar]
- 22.Glaeser, R. M., J. S. Jubb, and R. Henderson. 1985. Structural comparison of native and deoxycholate-treated purple membrane. Biophys. J. 48:775–780. [DOI] [PMC free article] [PubMed] [Google Scholar]
- 23.Nuss, M. C., W. Zinth, W. Kaiser, E. Koelling, and D. Oesterhelt. 1985. Femtosecond spectroscopy of the first events of the photochemical cycle in bacteriorhodopsin. Chem. Phys. Lett. 117:1–7. [Google Scholar]
- 24.Lanyi, J. K. 2000. Molecular mechanism of ion transport in bacteriorhodopsin: insights from crystallographic, spectroscopic, kinetic, and mutational studies. J. Phys. Chem. B. 104:11441–11448. [Google Scholar]
- 25.Landau, E. M., and J. P. Rosenbusch. 1996. Lipidic cubic phases: a novel concept for the crystallization of membrane proteins. Proc. Natl. Acad. Sci. USA. 93:14532–14535. [DOI] [PMC free article] [PubMed] [Google Scholar]
- 26.Pebay-Peyroula, E., G. Rummel, J. P. Rosenbusch, and E. M. Landau. 1997. X-ray structure of bacteriorhodopsin at 2.5 angstroms from microcrystals grown in lipidic cubic phases. Science. 277:1676–1681. [DOI] [PubMed] [Google Scholar]
- 27.Heberle, J., G. Buldt, E. Koglin, J. P. Rosenbusch, and E. M. Landau. 1998. Assessing the functionality of a membrane protein in a three-dimensional crystal. J. Mol. Biol. 281:587–592. [DOI] [PubMed] [Google Scholar]
- 28.Heyes, C. D., and M. A. El-Sayed. 2003. Proton transfer reactions in native and deionized bacteriorhodopsin upon delipidation and monomerization. Biophys. J. 85:426–434. [DOI] [PMC free article] [PubMed] [Google Scholar]
- 29.Bowie, J., and S. Farham. 2002. Bicelle crystallization: a new method for crystallizing membrane proteins yields a monomeric bacteriorhodopsin structure. J. Mol. Biol. 316:1–6. [DOI] [PubMed] [Google Scholar]
- 30.Szundi, I., and W. Stoeckenius. 1987. Effect of lipid surface charges on the purple-to-blue transition of bacteriorhodopsin. Proc. Natl. Acad. Sci. USA. 84:3681–3684. [DOI] [PMC free article] [PubMed] [Google Scholar]
- 31.Pebay-Peyroula, E., R. Neutze, and E. M. Landau. 2000. Lipidic cubic phase crystallization of bacteriorhodopsin and cryotrapping of intermediates: towards resolving a photocycle. Biochim. Biophys. Acta. 1460:119–132. [DOI] [PubMed] [Google Scholar]
- 32.Faham, S., D. Yang, E. Bare, S. Yohannan, J. P. Whitelegge, and J. U. Bowie. 2003. Side-chain contributions to membrane protein structure and stability. J. Mol. Biol. 335:297–305. [DOI] [PubMed] [Google Scholar]
- 33.Hanamoto, J. H., P. Dupuis, and M. A. El-Sayed. 1984. On the protein (tyrosine)-chromophore (protonated Schiff base) coupling in bacteriorhodopsin. Proc. Natl. Acad. Sci. USA. 81:7083–7087. [DOI] [PMC free article] [PubMed] [Google Scholar]
- 34.Jang, D. J., and M. A. El-Sayed. 1988. Deprotonation of lipid-depleted bacteriorhodopsin. Proc. Natl. Acad. Sci. USA. 85:5918–5922. [DOI] [PMC free article] [PubMed] [Google Scholar]
- 35.Varo, G., and J. K. Lanyi. 1990. Pathways of the rise and decay of the M photointermediate(s) of bacteriorhodopsin. Biochemistry. 29:2241–2250. [DOI] [PubMed] [Google Scholar]
- 36.Slifkin, M. A., and S. R. Caplan. 1975. Modulation excitation spectro-photometry of purple membrane of Halobacterium halobium. Nature. 253:56–58. [DOI] [PubMed] [Google Scholar]
- 37.Hendler, R. W., Z. Dancshazy, S. Bose, R. I. Shrager, and Z. Tokaji. 1994. Influence of excitation energy on the bacteriorhodopsin photocycle. Biochemistry. 33:4604–4610. [DOI] [PubMed] [Google Scholar]
- 38.Dencher, N. A., K. D. Kohl, and M. P. Heyn. 1983. Photochemical cycle and light-dark adaptation of monomeric and aggregated bacteriorhodopsin in various lipid environments. Biochemistry. 22:1323–1334. [DOI] [PubMed] [Google Scholar]
- 39.Balashov, S. P., R. Govindjee, and T. G. Ebrey. 1991. Red shift of the purple membrane absorption band and the deprotonation of tyrosine residues at high pH. Origin of the parallel photocycles of trans-bacteriorhodopsin. Biophys. J. 60:475–490. [DOI] [PMC free article] [PubMed] [Google Scholar]
- 40.Eisfeld, W., T. Althaus, and M. Stockburger. 1995. Evidence for parallel photocycles and implications for the proton pump in bacteriorhodopsin. Biophys. Chem. 56:105–112. [DOI] [PubMed] [Google Scholar]
- 41.Hendler, R. W., R. I. Shrager, and S. Bose. 2001. Theory and procedures for finding a correct kinetic model for the bacteriorhodopsin photocycle. J. Phys. Chem. B. 105:3319–3328. [DOI] [PubMed] [Google Scholar]
- 42.Oka, T., N. Yagi, F. Tokunaga, and M. Kataoka. 2002. Time-resolved X-ray diffraction reveals movement of F helix of D96N bacteriorhodopsin during M-MN transition at neutral pH. Biophys. J. 82:2610–2616. [DOI] [PMC free article] [PubMed] [Google Scholar]
- 43.Perkins, G. A., E. Liu, F. Burkard, E. A. Berry, and R. M. Glaeser. 1992. Characterization of the conformational change in the M1 and M2 substates of bacteriorhodopsin by the combined use of visible and infrared spectroscopy. J. Struct. Biol. 109:142–151. [DOI] [PubMed] [Google Scholar]
- 44.Lanyi, J. K. 1992. Reaction cycle and thermodynamics in bacteriorhodopsin. Acta Physiol. Scand. 607:245–248. [PubMed] [Google Scholar]
- 45.Schatzler, B., N. A. Dencher, J. Tittor, D. Oesterhelt, S. Yaniv-Checover, E. Nachliel, and M. Gutman. 2003. Subsecond proton-hole propagation in bacteriorhodopsin. Biophys. J. 84:671–686. [DOI] [PMC free article] [PubMed] [Google Scholar]
- 46.Kates, M. 1973. Techniques of Lipidology: Isolation, Analysis, and Identification of Lipids. American Elsevier Publishing, New York, NY.
- 47.Danshina, S. V., L. A. Drachev, A. D. Kaulen, and V. P. Skulachev. 1992. The inward hydrogen ion pathway in bacteriorhodopsin: the role of M412 and P(N)560 intermediates. Photochem. Photobiol. 55:735–740. [Google Scholar]
- 48.Dioumaev, A. K., L. S. Brown, R. Needleman, and J. K. Lanyi. 1998. Partitioning of free energy gain between the photoisomerized retinal and the protein in bacteriorhodopsin. Biochemistry. 37:9889–9893. [DOI] [PubMed] [Google Scholar]
- 49.Chon, Y.-S., J. Sasaki, H. Kandori, L. S. Brown, J. K. Lanyi, R. Needleman, and A. Maeda. 1996. Hydration of the counterion of the Schiff base in the chloride-transporting mutant of bacteriorhodopsin: FTIR and FT-Raman studies of the effects of anion binding when Asp85 is replaced with a neutral residue. Biochemistry. 35:14244–14250. [DOI] [PubMed] [Google Scholar]
- 50.Brown, L. S., A. K. Dioumaev, R. Needleman, and J. K. Lanyi. 1998. Local-Access model for proton transfer in bacteriorhodopsin. Biochemistry. 37:3982–3993. [DOI] [PubMed] [Google Scholar]
- 51.Druckmann, S., M. Ottolenghi, A. Pande, J. Pande, and R. H. Callender. 1982. Acid-base equilibrium of the Schiff base in bacteriorhodopsin. Biochemistry. 21:4953–4959. [DOI] [PubMed] [Google Scholar]
- 52.Sheves, M., A. Albeck, N. Friedman, and M. Ottolenghi. 1986. Controlling the pKa of the bacteriorhodopsin Schiff base by use of artificial retinal analogs. Proc. Natl. Acad. Sci. USA. 83:3262–3266. [DOI] [PMC free article] [PubMed] [Google Scholar]
- 53.Balashov, S. P., R. Govindjee, E. S. Imasheva, S. Misra, T. G. Ebrey, Y. Feng, R. K. Crouch, and D. R. Menick. 1995. The two pKa's of aspartate-85 and control of thermal isomerization and proton release in the arginine-82 to lysine mutant of bacteriorhodopsin. Biochemistry. 34:8820–8834. [DOI] [PubMed] [Google Scholar]
- 54.Balashov, S. P., R. Govindjee, M. Kono, E. Imasheva, E. Lukashev, T. G. Ebrey, R. K. Crouch, D. R. Menick, and Y. Feng. 1993. Effect of the arginine-82 to alanine mutation in bacteriorhodopsin on dark adaptation, proton release, and the photochemical cycle. Biochemistry. 32:10331–10343. [DOI] [PubMed] [Google Scholar]
- 55.Brown, L. S., L. Bonet, R. Needleman, and J. K. Lanyi. 1993. Estimated acid dissociation constants of the Schiff base, Asp-85, and Arg-82 during the bacteriorhodopsin photocycle. Biophys. J. 65:124–130. [DOI] [PMC free article] [PubMed] [Google Scholar]
- 56.Chronister, E. L., T. C. Corcoran, L. Song, and M. A. El-Sayed. 1986. On the molecular mechanisms of the Schiff base deprotonation during the bacteriorhodopsin photocycle. Proc. Natl. Acad. Sci. USA. 83:8580–8584. [DOI] [PMC free article] [PubMed] [Google Scholar]
- 57.Otto, H., T. Marti, M. Holz, T. Mogi, M. Lindau, H. G. Khorana, and M. P. Heyn. 1989. Aspartic acid-96 is the internal proton donor in the reprotonation of the Schiff base of bacteriorhodopsin. Proc. Natl. Acad. Sci. USA. 86:9228–9232. [DOI] [PMC free article] [PubMed] [Google Scholar]
- 58.Maeda, A., F. L. Tomson, R. B. Gennis, H. Kandori, T. G. Ebrey, and S. P. Balashov. 2000. Relocation of internal bound water in bacteriorhodopsin during the photoreaction of m at low temperatures: an FTIR study. Biochemistry. 39:10154–10162. [DOI] [PubMed] [Google Scholar]
- 59.Cao, Y., G. Varo, M. Chang, B. F. Ni, R. Needleman, and J. K. Lanyi. 1991. Water is required for proton transfer from aspartate-96 to the bacteriorhodopsin Schiff base. Biochemistry. 30:10972–10979. [DOI] [PubMed] [Google Scholar]
- 60.Schobert, B., L. S. Brown, and J. K. Lanyi. 2003. Crystallographic structures of the M and N intermediates of bacteriorhodopsin: assembly of a hydrogen-bonded chain of water molecules between Asp-96 and the retinal Schiff base. J. Mol. Biol. 330:553–570. [DOI] [PubMed] [Google Scholar]