

Abstract
It has been demonstrated that a “near-Levinthal” cooperative mechanism, whereby the common Gō interaction scheme is augmented by an extra favorability for the native state as a whole, can lead to apparent two-state folding/unfolding kinetics over a broad range of native stabilities in lattice models of proteins. Here such a mechanism is shown to be generalizable to a simplified continuum (off-lattice) Langevin dynamics model with a Cα protein chain representation, with the resulting chevron plots exhibiting an extended quasilinear regime reminiscent of that of apparent two-state real proteins. Similarly high degrees of cooperativity are possible in Gō-like continuum models with rudimentary pairwise desolvation barriers as well. In these models, cooperativity increases with increasing desolvation barrier height, suggesting strongly that two-state-like folding/unfolding kinetics would be achievable when the pairwise desolvation barrier becomes sufficiently high. Besides cooperativity, another generic folding property of interest that has emerged from published experiments on several apparent two-state proteins is that their folding relaxation under constant native stability (isostability) conditions is essentially Arrhenius, entailing high intrinsic enthalpic folding barriers of ∼17–30 kcal/mol. Based on a new analysis of published data on barnase, here we propose that a similar property should also apply to a certain class of non-two-state proteins that fold with chevron rollovers. However, several continuum Gō-like constructs considered here fail to predict any significant intrinsic enthalpic folding barrier under isostability conditions; thus the physical origin of such barriers in real proteins remains to be elucidated.
INTRODUCTION
In our investigation of protein folding, certain seemingly mundane, generic experimental properties of proteins have proven to be surprisingly informative. This springs from the realization that these properties are not readily reproduced by most of the current explicit-chain polymer models. Therefore, by requiring a chain model to mimic these behaviors, significant constraints are placed on the possible forms of the protein folding potential function. Among such properties, a defining characteristic in the folding of many small, single-domain proteins such as chymotrypsin inhibitor 2 (CI2) is the linearity of the folding and unfolding arms of their chevron plots (1), a feature that has also been termed kinetic cooperativity (2). Another remarkable yet less explored property is that some proteins' folding rates exhibit essential Arrhenius behavior under isostable (i.e., isostability) conditions (3,4). This feature is closely related but distinct from the usual thermodynamic and kinetic criteria for cooperativity. The present study focuses on both of these two generic properties.
Computationally, it is not yet feasible to ascertain the chevron behaviors of high-resolution atomic models of proteins, notwithstanding tremendous recent progress (5–7). Whether common molecular dynamics force fields are sufficient for kinetic cooperativity remains an open question. To date, chevron plots (8) have been obtained in several theoretical simulations using simplified chain representations, encompassing lattice (9) as well as continuum (off-lattice) Cα-based approaches (10). In this—as in many other respects of protein folding—simplified (11,12), and even native-centric or Gō-like constructs, are useful for posing and addressing questions of general physical principles (13–19). Most common simple Gō models are insufficient for predicting kinetic cooperativity, however. Recent advances (20) indicate that Gō-like models with essentially pairwise additive contact energies exhibit behaviors more akin to real proteins when they are simulated at the transition midpoint (21) than under thermodynamic conditions that are mildly to strongly favorable to the native state in the model. Indeed, consistent with this observation, although chevron rollovers are not typical for natural, small single-domain proteins (22,23), direct simulations of folding rates of several such Gō-like protein models under a range of native stability conditions, corresponding to that accessible by experiment, have led to chevron plots with severe rollovers (9,10,24).
We have made a first step toward rectifying this discrepancy by showing that chevron plots with an extended quasilinear regime are achievable in native-centric lattice models when the common pairwise additive contact energies are augmented by physically plausible many-body interactions. These terms include, but are not necessarily limited to:
Imparting an extra energetic favorability to the native state as a whole.
Coupling local conformational preference with favorable nonlocal interactions, or both (25,26).
The first part of this article concerns an extension of scheme 1 (above) to a continuum model. The present scope does not include further exploration of interaction schemes with local-nonlocal coupling (scheme 2, above). It is noteworthy, nevertheless, that such an interaction scheme has provided a rationalization for the dependence of folding rate on contact order (27) in a lattice-model context (26).
Conceptually, scheme 1 (above) means that the native state of a protein can attain an extra degree of stability from interactions that play little or no role during the kinetic folding process before the final assembly of the native structure. This idea is motivated by experimental data suggesting a partial separation between the interactions responsible for thermodynamic stability on one hand, and the driving forces for folding kinetics on the other (28,29). The interaction scheme 1 (above) is formally somewhat similar to a many-body native-centric lattice interaction scheme introduced independently by Jewett et al. (30), although there are important differences (2,25). Obviously, the ultimate physical origin (or lack thereof) of any proposed effective intraprotein interactions should be formulated in terms of atomistic models that are based upon general, non-native-centric interactions. Nonetheless, in view of current limitations in both computational resources and theoretical understanding, native-centric considerations are a useful stepping stone to novel physics. Following this philosophy, here we implement a native-centric interaction similar to the lattice scheme 1 (above), but now in a continuum protein model with a simplified Cα chain representation. This exercise is designed to assess under more realistic, off-lattice circumstances whether imparting extra favorability to the native state as a whole is effective for quasilinear chevron behavior.
Another generic feature of interest to the present study is the variation of folding rate with native stability and temperature. Protein folding rates generally depend strongly on temperature but are typically non-Arrhenius, i.e., they vary nonlinearly with the reciprocal of absolute temperature, 1/T (see, e.g., Refs. 31 and 32). A major cause of this behavior is that folding is driven by temperature-dependent solvent-mediated interactions. However, for several two-state proteins, folding kinetics becomes Arrhenius when the temperature dependence of folding rate is deconvoluted from the temperature dependence of native stability. This remarkable regularity was unmasked by “global analyses” of temperature and denaturant effects. Specifically, when temperature T is allowed to vary whereas native stability is maintained at a given level by adjusting denaturant concentration (i.e., ΔGf/kBT kept constant, where ΔGf is free energy of folding and kB is the Boltzmann constant), the resulting T-dependent folding rate was found to be essentially linear in 1/T (3,4). The height of the intrinsic enthalpic barrier to folding under such isostability conditions is protein-dependent, but are all rather high at ∼20 kcal/mol. The physical origin of such high enthalpic barriers is yet to be determined. Nonetheless, it is obvious that they must play major roles in the energetics and cooperativity of protein folding.
Using experimental data from the literature, here we show that this feature is likely applicable to the folding of barnase as well. This is noteworthy: unlike the apparent two-state proteins for which global analyses have been performed, barnase is a non-two-state protein with a chevron rollover. Thus, our finding suggests a more broad-based phenomenon, that two-state as well as a certain class of non-two-state proteins generally possess high isostable intrinsic enthalpic folding barriers. Accordingly, this generic behavior may be used as an additional experimental criterion against which protein chain models can be evaluated. In lattice models, we have shown that a similar behavior can be produced by stipulating that the models' timescale, or “Monte Carlo clock,” has a strong temperature dependence, envisioned to arise from an assumed high enthalpic barrier for elementary conformational transitions (25,33,34). However, the relationship between physical time and the number of Monte Carlo time steps is inevitably somewhat ad hoc in lattice modeling. Moreover, lattice-model considerations have not supplied a plausible physical origin for the rather great heights of these barriers. In any event, it is more relevant to explore this physical question in off-lattice, continuum models of protein dynamics. With this in mind, here we apply this new test to several continuum native-centric Langevin-dynamics models.
MODELS AND METHODS
Lattice models are also considered in this study. The relationship between thermodynamic and kinetic cooperativity in several representative lattice models (30,35) will be explored. Here the lattice example in Fig. 1 illustrates how imparting an extra energetic favorability to the native state as a whole (upper panel of the figure) can lead to enhanced protein folding cooperativity. Relative to the pairwise additive Gō model, such a scheme gives rise to a higher free energy barrier between the folded and denatured states (Fig. 1, lower panel) at the folding/unfolding transition midpoint and hence a higher degree of thermodynamic or calorimetric cooperativity (2). Kinetically, lattice dynamics simulations of several similar 27-mer models show that although pairwise additive Gō interactions lead to severe chevron rollovers, models with extra native favorability (large values of Egs) have chevron plots that exhibit extended quasilinear regimes (25,26).
FIGURE 1.

Enhancing cooperativity by imparting extra energetic favorability to the native state. (Upper panel) The solid curve shows the logarithmic density of states of a 27-mer Gō model in Kaya and Chan (26) with relative contact order CO = 224/756 = 0.296 and ground-state energy = −28; g(E) is number of conformations as a function of energy E estimated by standard Monte Carlo histogram techniques and sampling near the transition midpoint. The arrow and vertical lines mark the shift in ground state to E = −42 (Egs = −14) for a thermodynamically more cooperative model as in Ref. 25. (Lower panel) Free energy profiles at the transition midpoints for the Gō (solid curve, ε/kBT = −1.47) and the Egs = −14 (dashed curve, ε/kBT = −0.929) models, as the negative logarithm of their respective Boltzmann population P(Q), where Q is the fractional number of native contacts (note that P(Q = 27/28) = 0 for these models).
Here we implement an interaction scheme with a similar provision for extra native favorability in a continuum Cα model. The present construct is based—with a simple modification—on the following commonly used native-centric potential (10,16,36,37),
 |
(1) |
where N is the total number of Cα atoms; r, θ, and φ are, respectively, the virtual bond length between successive Cα positions, virtual bond angle, and virtual torsion angle along the chain sequence; and r0, θ0, and φ0 are the corresponding native values from the PDB structure. In the last two summations, rij is the spatial distance between two Cα positions that are sequentially separated by at least three residues. For native contacts, r′ij is the distance between the Cα positions of contacting residues i and j. For non-native contacts, rrep provides excluded volume repulsion. Using Langevin dynamics (38),
 |
(2) |
where m, v,  , Fconf, γ and η are, respectively, mass, velocity, acceleration, conformational force, friction (viscosity) constant and random force. We have applied Eq. 1 to the N = 64 truncated form of chymotrypsin inhibitor 2 (CI2) by equating the conformational force to the negative gradient of the above potential function, i.e., Fconf = −∇Vtotal. We refer to this previous setup as the “without-solvation” model because it does not involve solvation/desolvation barriers (10), although the terms in Eq. 1 may be construed as accounting for certain other aspects of solvent-mediated interactions.
The new, more cooperative interaction scheme explored in the present work is obtained from this previous model by allowing for stronger interactions when the chain conformation is considered “native.” To this end, the conformational force term in the Langevin equation (Eq. 2) is hereby modified to
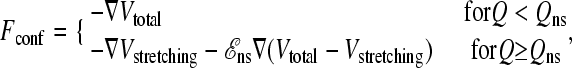 |
(3) |
where a scaling factor ℰns > 1 now provides for stronger native-centric forces to impart extra favorability to the native state as a whole. Q is the fractional number of native contacts, and Qns is a threshold such that only conformations with Q ≥ Qns belong to the stronger-interacting native-state ensemble. The Langevin force is identical to the original model for Q < Qns. For Q ≥ Qns, the ℰns scaling applies to every term in Vtotal except virtual bond stretching Vstretching. This term is not modified because its only function is to maintain an essentially constant Cα-Cα distance. Physically, this distance is not expected to depend on whether the protein is in the native state. In any event, for the cases tested, the differences in predictions obtained from not scaling versus scaling Vstretching by ℰns for Q ≥ Qns are negligible (data not shown). To compare with our previous CI2 results, here we apply this modified formulation to CI2 as well, to ascertain whether the altered interaction scheme specified by Eq. 3 is effective in affording a higher degree of kinetic cooperativity. The present analysis uses the set of 142 native contacts that we referred to as “NCS2.” We set ℰns = 1.8 and Qns = 117/142. The latter corresponds roughly to the Q-value of the native free energy minimum of the original (ℰns = 1) model under transition-midpoint conditions. We use rrep = 4 Å, Kθ = 20ε, Kφ(1) = ε, and Kφ(3) = 0.5ε (ε > 0) as before. Thus, for a given ℰns, except for the virtual bond stretching factor Kr, the overall strength of the interactions in the model is parameterized by ε. We adopt the same values for m and γ, employ the same procedure for generating the random force η, and conduct the Langevin dynamics simulations in the same manner as before (10). This modified formulation is referred to as the scaled model.
This prescription is a simple embodiment—among many theoretical possibilities—of the idea of extra native favorability. The conformational force in Eq. 3 is derived from two different potential functions for two separate regions of configurational space. As such, it is not defined as the negative gradient of a single potential; and probably this scaled interaction scheme is not expressible in terms of any single analytic potential function. Hence, the Langevin formulation in Eqs. 1–3 is similar in spirit but not entirely analogous to the previous lattice models that provide extra native favorability through an additional Egs energy term in the potential (25). Continuum formulations that serve a similar purpose but are based on a single potential have not been explored; and they would likely involve more complex conformational forces.
Folding kinetics simulations in our scaled model are initiated from random conformations. Folding time is defined by the first passage time when Q ≥ Qns = 117/142 is achieved. Unfolding simulations start from the Q = 1 PDB conformation; unfolding time is defined by the duration of simulation needed to first achieve Q ≤ 25/142. As the main goal of this study is to test whether the scaled model affords an apparent two-state folding/unfolding kinetics that is consistent with native stability measurements (9), the computation of conformational population distribution is based on the same definition of folding and unfolding. Specifically, during conformational sampling of the scaled model, whenever the boundary Q = Qns is crossed from the unfolded to the folded side, the simulation is restarted from the PDB Q = 1 conformation, with velocities from the previous time step. Physically, this prescription effectively stipulates that equilibration among the native Q ≥ Qns conformations is rapid, even though the pertinent mechanisms might not have been fully taken into consideration in the simple formulation of the present scaled model. Technically, this procedure also serves to circumvent possible energy-non-conservation problems at Q = Qns.
Fig. 2 compares the behavior of the original and scaled models. As a check, the average kinetic energies for the two trajectories in Fig. 2 are determined to be (a) 78.77 and (b) 78.78, in essential agreement with 3NT/2 = 78.72 for N = 64 and T = 0.82. Conspicuously, the extra native favorability of the scaled model pushes the conformations in the native state to higher values of Q: the native conformations (with Q ≥ Qns) in the original model fluctuate around Q ≈ 0.83, and the native conformations in the scaled model fluctuate around Q ≈ 0.97 (compare to Fig. 3). Folding and unfolding times at the transition midpoint are at least one order-of-magnitude longer for the scaled model than for the original model, consistent with the scaled model's much higher free energy barrier under midpoint conditions (Fig. 3). Operationally, Fig. 2 b shows that the scaled model exhibits basic features of a polymer molecule that undergoes sharp folding and unfolding transitions. Thus, despite the scaled model's somewhat ad hoc construct, the model is useful in taking a step toward elucidating the mechanisms of cooperative protein folding.
FIGURE 2.

Comparing two native-centric models for the 64-residue truncated form of CI2 based on the native contact set NCS2, and the original and modified (scaled) “without-solvation” formulations at T = 0.82. Time in this and all subsequent figures is in units of simulation time step δt, as in Ref. 10. (a) A typical trajectory with many folding/unfolding cycles near the transition midpoint (ε = 0.81) of the original model, depicted by the time-dependence of Q (upper panel), and of kinetic energy (lower panel) given by  where vi values are the Cα velocities. (b) Corresponding data for a trajectory showing an unfolding/folding cycle near the transition midpoint (ε = 0.732) of the scaled model. Here the Qns = 117/142 level is marked by a horizontal line (upper panel). The example trajectory in b is from a continuous run: in this case, and unlike the procedure adopted for determining native population, Langevin dynamics of the scaled model was allowed to continue without interruption when the chain crosses over from Q < 117/142 to Q ≥ 117/142 (no restarting from a Q = 1 conformation at time ≈ 3.1 × 10⁸ for this particular trajectory). Key features of this continuous scaled-model trajectory are very much similar to that of trajectories simulated with Q = 1 restarts as described in the text (corresponding time-dependence data not shown).
FIGURE 3.

The free energy profiles of the original Gō-like (dashed curve, ε/kBT = 0.99) and the scaled (solid curve, ε/kBT = 0.88) models in Fig. 2 are provided by the negative logarithm of their respective population P(Q) simulated at T = 0.82. Bias potentials and histogram techniques were employed to enhance sampling for the scaled model.
To explore the dependence of folding rate on denaturant- versus temperature-induced changes in native stability, we assume that denaturant effects may be mimicked by a uniform weakening of the native-centric interactions (10). Accordingly, we model constant-temperature denaturant concentration changes by varying ε while keeping T fixed. This approach is consistent with the fact that native stabilities of small single-domain proteins are essentially linear in denaturant concentration, as model native stability at constant T is often an approximately linear function of ε as well. In contrast, for temperature-induced changes in native stability, T is varied whereas ε is kept fixed. The value Kr in Vstretching is kept constant (independent of ε, T) in both sets of simulations.
RESULTS AND DISCUSSION
Quasilinear chevron plot of the scaled model
Fig. 4 shows a chevron plot for the scaled model obtained by multiple kinetic simulations at a constant T. A prominent rollover is observed under strongly native conditions (−ε more negative), with the folding rate (reciprocal of folding MFPT) peaking at −ε/kBT ≈ −1.2. A milder rollover is seen for unfolding under very strongly unfolding conditions (−ε much less negative). This trend is similar to that of less cooperative native-centric continuum and lattice chain models (10,24). The hypothetical two-state chevron (V-shape) in this figure is constructed to be consistent with native stability. At any given ε, the ratio of folding and unfolding rates afforded by the two inclined lines and their linear extrapolations is equal to the equilibrium population ratio at the same ε, and native stability is estimated using population profiles (compare to Fig. 3) computed directly at different ε-values (detailed data not shown).
FIGURE 4.

Chevron plot of the scaled CI2 model is given by the negative logarithmic mean first passage time (MFPT) of folding (open circles) and unfolding (solid circles) as functions of interaction strength −ε/kBT. Results shown are for T = 0.82. The V-shaped lines constitute a hypothetical chevron plot consistent with the population-based free energy difference between the folded (Q ≥ 117/142) and unfolded (Q ≤ 25/142) conformations. MFPTs are averaged from 500 independent trajectories for −ε/kBT ≤ −1.01 and −ε/kBT ≥ −0.73, and 100 independent trajectories for −0.83 ≤ −ε/kBT < −0.73, and −1.01 ≤ −ε/kBT <−0.92. For the remaining −ε/kBT values shown, each MFPT datapoint is averaged from ∼40 independent trajectories.
The scaled model results in Fig. 4 affirm our previous argument that a certain degree of rollover of a chevron's folding arm is probably intrinsic to any physically plausible polymer model, and difficult to avoid altogether. More importantly, within this framework, Fig. 4 shows clearly that imparting extra favorability to the native state as a whole, which make it harder to unfold, can lead to more linear chevron behavior in a continuum model as have been demonstrated in a lattice context (25). A comparison of the folding arm of the hypothetical two-state chevron with the simulated datapoints in Fig. 4 indicates that the two sets of rates do not begin to diverge until −ln(MFPT) ≈ −15.5. This translates into a quasilinear chevron regime that extends to a native stability of ≈9 kBT, which is comparable to the experimental zero-denaturant native stabilities of many single-domain proteins. In contrast, for the original nonscaled, essentially pairwise additive without-solvation model, the corresponding quasilinear regime extends only to a native stability of, at most, 4 kBT (compare to Fig. 7 in Ref. 10).
FIGURE 7.

A two-temperature isostability kinetic analysis of wild-type barnase in 2H2O and guanidine hydrochloride (see text). (Left panel) Folding rate kf (circles and squares) as a function of ΔGf/RT for T1 = 298.15K (25°C) and pD 7.5 are compared with that for T2 = 310.15K (37°C) and pD 7.6. The fitted curves are guides for the eye. The kf values are read off from the corresponding folding arms of the chevron plots in Fig. 1 of Ref. 46; the ΔGf/RT values are obtained from the log KN-D curves in Fig. 6 of the same reference by setting ΔGf/RT = ln KN-D. (Right panel) The approximate difference in logarithmic folding rate at the two temperatures as a function of ΔGf/RT. This result is obtained directly from the fitted curves in the left panel. Here ln kf(T1) = ln kf(ΔGf/RT;T1) and ln kf(T2) = ln kf(ΔGf/RT;T2).
Enthalpic folding barriers under experimental isostability conditions
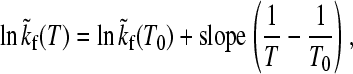
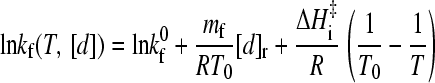
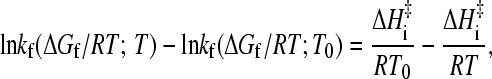
We now turn to the observation of essentially Arrhenius folding kinetics under isostability conditions, which is an intriguing feature that has emerged from the global analyses of at least two apparent two-state proteins (3,4), and is a remarkable experimental phenomenon that deserves theoretical attention. The observed pattern of behavior is summarized by the following simple relation,
 |
(4) |
where  is the T-dependent folding rate along a given temperature/denaturant contour that maintains a constant value of ΔGf/T (the tilde character here serves to highlight this isostability constraint), T0 is a reference temperature, and
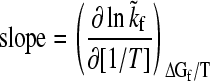 |
(5) |
is the slope of the folding rate versus 1/T plot along the given constant ΔGf/T contour. Here ΔGf = −kBT ln([N]/[D]) where [N] and [D] are native and denatured population, respectively. When molar quantities are desired, kB is replaced by the gas constant R. Global analyses of folding kinetics under multiple temperature and denaturant conditions for the 62-residue Y43W mutant of the IgG binding domain of protein L and the 56-residue N-terminal domain of L9 (NTL9) indicate that the slope in Eq. 5 is essentially T-independent for each constant ΔGf/T contour. To a good approximation, this slope (<0) is also independent of ΔGf/T. Hence, an intrinsic enthalpic barrier to folding  = − kB × (slope) [or −R × (slope)] may be associated with each protein. For protein L and NTL9, ΔHi‡ ≈ 22 and 17 kcal/mol, respectively (3,4). By analyzing the fitted activation parameters from a set of more than 300 temperature- and urea-dependent folding rates of cold shock protein B (39), Scalley and Baker (3) found that the ΔHi‡ value for cold shock protein B is very similar to that of protein L. Subsequently, by applying a simplifying assumption on the original data that provide only a limited coverage of joint temperature/denaturant variation for chymotrypsin inhibitor 2 (CI2) (40) and the histidine-containing phosphocarrier protein (41), Kuhlman et al. (4) estimated Δ
 ≈ 26 kcal/mol (CI2) and ≈30 kcal/mol (histidine-containing phosphocarrier protein) for these proteins.
For transition-state analyses that stipulate ln(kf/T)—instead of ln kf—to be the quantity that varies linearly with an activation free energy divided by T (e.g., Ref. 42), 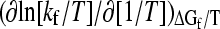 = (slope) + T. Thus, if this derivative is used to define a slope, it would differ from Eq. 5 by the absolute temperature T. Nonetheless, since (slope) ∼104 (4) and the variation in T in folding studies is generally <102, the variation in T is small relative to the overall magnitude of the slope. It follows that if the (slope) defined by Eq. 5 is independent of T, to a reasonable approximation the above derivative of ln [kf/T] is also essentially independent of T.
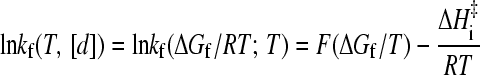
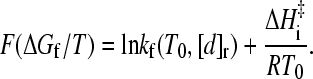
A general formulation
The above observations suggest that the following general formula for the logarithmic folding rate ln kf as a function of T and denaturant concentration [d] should hold to a good approximation for apparent two-state proteins with linear folding chevron arms:
 |
(6) |
Here kf0 ≡ kf(T0, 0) is the zero-denaturant ([d] = 0) folding rate at the reference temperature T0, mf (<0) is the m-value for [d]-dependent folding at T0, i.e., ln kf(T0, [d]) = ln kf0 + mf[d]/RT0, and [d]r is the reference denaturant concentration such that
 |
(7) |
These relations imply that once the native stability and folding rate as a function of [d] (chevron plot) is known at a given T0, the temperature- and denaturant-dependent kf(T, [d]) can be calculated via Eq. 6 by first matching the native stability at T, [d] with that at T0 (Eq. 7). The intrinsic enthalpic barrier ΔHi‡ in Eq. 6 then accounts for the temperature difference (T versus T0). Now, Eqs. 6 and 7 can be expressed as
 |
(8) |
to emphasize that the folding rate under any combined temperature/denaturant condition is a function only of ΔGf/T (or, equivalently, the dimensionless variable ΔGf/RT) and T. Therefore, whenever two or more such combined conditions lead to the same ΔGf/T, the differences in their folding rates are governed solely by their temperatures through a simple enthalpic dependence. In particular, for proteins with free energy of folding that varies linearly with denaturant, i.e., ΔGf(T0, [d]) = ΔGf0 + meq[d], where ΔGf0 ≡ ΔGf(T0, 0) at [d] = 0 and meq is the equilibrium m-value for the given denaturant, Eq. 7 implies that
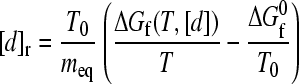 |
(9) |
Thus, it follows from Eqs. 6 and 7 that the function F in Eq. 8 is given by
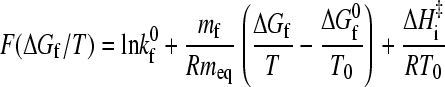 |
(10) |
for apparent two-state proteins.
A thorough experimental assessment of Eq. 8 requires a global analysis using extensive measurements to ascertain whether the general relationship applies to a given protein under multiple temperature/denaturant conditions (see above). Nevertheless, even in the absence of such extensive data, whether a protein's behavior is consistent with Eq. 8 can still be partially verified or falsified if rate data at more than one temperature are available. For instance, Eq. 8 implies that the difference between a temperature-dependent rate ln kf(ΔGf/RT;T) determined at zero denaturant and a denaturant-dependent rate ln kf(ΔGf/RT;T0) measured at a fixed temperature (chevron plot) is given by
 |
(11) |
which is linear in 1/T with a slope equal to −ΔHi‡/R. As an example, Fig. 5 presents such an analysis for the published NTL9 data: We first express the [d] = 0, variable-T rate and the variable-[d], constant-T rate as functions of native stability ΔGf/RT (left panel) by using the TS→U and F→U thermodynamic parameters (for folding kinetics and equilibrium native stability, respectively), the kinetic and equilibrium m-values in Table 1 of Kuhlman et al. (4), and the corresponding pre-exponential front factor used by these authors. (As far as the present analysis is concerned, we can be agnostic about the physical meaning of the thermodynamic parameters in Kuhlman et al.; their sole purpose here is to reproduce the experimental data.) We then compute the difference in rate under isostability condition (same ΔGf/RT) for the two sets of kinetic data (right panel) which, in agreement with Eq. 11, shows a linear dependence on 1/T with a slope ≈−9000 (ΔHi‡ ≈ 18 kcal/mol). The slope estimated from Fig. 5 essentially agrees with the values of −8600 or −8950 in the original report of Kuhlman et al. (4).
FIGURE 5.

Isostability kinetic analysis of NTL9, an apparent two-state protein. (Left panel) Logarithmic folding rate (vertical axis, kf in units of s−1) versus native stability (free energy of folding in units of RT, horizontal axis) from varying denaturant concentration at constant temperature T0 = 298.15 K (dotted straight line, ln kf(ΔGf/RT;T0)) is compared with that from varying temperature T at zero denaturant (solid curve, ln kf(ΔGf/RT;T)). Thus, the native stability value at the point of intersection of the two sets of rates corresponds to that at T0 and zero denaturant. This plot is based on the experimental measurement of Kuhlman et al. (4) of NTL9 in 2H2O (pD 5.45) and using guanidine deuterium chloride (GuDCl) as denaturant. (Right panel) The difference between the two isostability logarithmic folding rates is essentially linear in 1/T, as stipulated by Eq. 11.
Whereas the above formulation is developed for apparent two-state proteins, the manifestly general form of Eq. 8, which involves neither m-values nor transition-state heat capacities, suggests that this relation may have wider applicability (33), at least in the stability regime with essentially single-exponential kinetic relaxation (25,26), with the F function in Eq. 10 taking a more general form of
 |
(12) |
Now, for proteins with folding-arm chevron rollovers (mf no longer constant at T0), but which still maintain a linear dependence of native stability on denaturant (meq remains constant), Eq. 9 continues to provide an expression for [d]r that can be substituted into Eq. 12. More generally, when the dependence of native stability on denaturant is not necessarily linear, [d]r is determined by the isostability relation defined by Eq. 7.
The case of barnase
As a first evaluation of the generalized Eq. 12 to ascertain its applicability to proteins with chevron rollovers, we have performed isostability kinetic analyses on barnase (Figs. 6 and 7), which is commonly classified as a non-two-state folder. Both its temperature-dependent rates at zero denaturant and chevron plots are available. Following a procedure very much similar to that for NTL9 above, we first obtain barnase's [d] = 0, variable-T folding rate and the variable-[d], constant-T rate as functions of native stability ΔGf/RT. This is achieved by using the equilibrium (N versus D) data from Table 1 in Oliveberg and Fersht (43) for the T-dependence of ΔGf at zero denaturant, the top panel of Fig. 2 in Matouschek et al. (44) for variable-[d], constant-T folding rates and the corresponding ΔGf values, and the top panel of Fig. 2 in Oliveberg et al. (42) for T-dependent folding rates at zero denaturant. (Note that these data are essentially identical to that in Figs. 3 and 4 of Dalby et al., Ref. 45.) The result of this analysis is shown in the left panel of Fig. 6. We then check whether the isostability relation Eq. 11 holds for this set of data, noting that if Eq. 8 is generally valid, Eq. 11 should follow as a direct consequence irrespective of the functional form of F(ΔGf/T). The right panel of Fig. 6 demonstrates that this is indeed the case, the slope of the isostability rate difference versus 1/T plot is ∼−14,900, corresponding to  ≈ 30 kcal/mol. Interestingly, this
  value for the non-two-state barnase is at the high end of the range of
  documented by Kuhlman et al. (4) for apparent two-state proteins. It is quite remarkable that despite the large curvature exhibited by the 1/T dependence of its folding rate and its chevron rollover, a pattern of isostability behavior very much similar to that observed for apparent two-state proteins exists for barnase.
FIGURE 6.

Isostability kinetic analysis reveals intrinsic Arrhenius relaxation in the folding of wild-type barnase. Data used in this analysis are from the experiments at pH 6.3 described in the text, using urea as denaturant. (Left panel) Logarithmic folding rate versus native stability from varying denaturant concentration at constant T0 = 298.15 K (datapoints exhibiting less curvature along the dotted curve) is compared with that from varying T at zero denaturant (datapoints along solid curve). Notation and units are the same as that in Fig. 5. Here the dotted curve is a quadratic fit to the constant T = T0 data, extrapolated to exhibit a hypothetical maximum folding rate at ΔGf/RT ≈ −40 (24). (Right panel) The difference between the two isostability logarithmic folding rates of barnase (solid curve) is seen to vary essentially linearly with 1/T (compare to fitted dotted straight line).
Fig. 7 extends isostability analyses to the more recent experimental investigation of barnase folding in 2H2O by Khan et al. (46) using guanidine hydrochloride as denaturant (whereas the barnase data in Fig. 6 are for a H2O solvent using urea as denaturant). As an illustration, folding rates for two different temperatures and at slightly different pD values are compared (left panel of Fig. 7). Although Eq. 8 may not account for pH or pD effects, if the small pD difference in this case can be neglected, Eq. 8 implies that the difference in logarithmic folding rate should be a constant that equals ΔHi‡(1/T2 − 1/T1)/R. Not inconsistent with this expectation, the right panel of Fig. 7 shows that for this dataset, the difference in ln kf is nearly though not exactly independent of ΔGf/RT. The logarithmic rate difference ln [kf(T1)/kf(T2)] ranges approximately from 1.9 to 2.3. This translates into a ΔHi‡ value of 29–35 kcal/mol, which is remarkably similar to the ΔHi‡ value obtained for the H2O/urea data in Fig. 6, suggesting that intrinsic enthalpic folding barriers may be relatively independent of denaturant. This possibility deserves further studies. It also remains to be elucidated whether the weak yet existent dependence of ln [kf(T1)/kf(T2)] on ΔGf/T in Fig. 7 can be attributed chiefly to the pD difference—or whether it is an indication of more basic limitations of the general formulation in Eq. 8.
A simple lattice scenario for intrinsic enthalpic folding barriers
Explicit-chain modeling efforts to rationalize the empirical intrinsic enthalpic protein folding barrier have not been extensive. Advances so far are limited to lattice models. As mentioned briefly above, it was proposed several years ago that Eyring and chevron plots of protein folding can be rationalized under a single physical framework in Monte Carlo model protein dynamics by using 1), a hydrophobic-like temperature-dependent intraprotein interaction; and 2), a temperature-dependent Monte Carlo clock (timescale in the model) that envisions the intrinsic rate of conformational transitions to speed up with increasing T and has an Arrhenius dependence (33,34). This approach has been applied to a couple of short-chain two-dimensional lattice models, and has led to results that are in qualitative agreement with experiment (see, e.g., Fig. 7 of Ref. 47). Consistent with subsequent experimental findings on apparent two-state proteins (3), the T-dependent Monte Carlo clock presupposed by these lattice models implies a simple relationship between Eyring and chevron plots of protein folding, as the intrinsic enthalpic folding barrier discovered by experiments may be identified with the activation enthalpy for the Arrhenius intrinsic conformational transition rate in the model. The formulation has also been generalized to suggest that the Eyring and chevron plots of non-two-state proteins may also be linked by an intrinsic enthalpic folding barrier (33), as we have now verified for the case of barnase.
We now extend this approach to longer-chain three-dimensional lattice models (Fig. 8). Previous studies using short-chain two-dimensional lattice models are useful for general principles; but they are often not well-suited for more quantitative matches with experiment because their limited conformational freedom precludes an adequate modeling of the folding free energy barrier of real proteins. This is reflected by the fact that they often fail to produce the calorimetric two-state cooperativity observed experimentally for many relatively small proteins (48). Here Fig. 8 provides an isostability analysis of a recent three-dimensional lattice model. Similar to the earlier two-dimensional constructs, this model contains a temperature-dependent interaction ε0(T) as well as a temperature-dependent Monte Carlo clock; however, Metropolis dynamics is used here instead of the Kawasaki dynamics employed in the earlier short-chain two-dimensional models for chevron behavior (33). As in Figs. 5 and 6, here both the constant-T folding rate at variable interaction strength (denaturant-dependent rate) and the variable-T folding rate (corresponding to zero denaturant in the model) are plotted in the left panel of Fig. 8 as functions of ΔGf/kBT. Plotting folding rate versus stability is a useful modeling technique (49) that serves to eliminate explicit dependence on model interaction parameters and facilitate more direct comparison with experiment (26). Fig. 8 provides rationalization for the intrinsic enthalpic folding barrier in apparent two-state proteins as well as non-two-state proteins. The folding chevron arm of this model is essentially linear for ΔGf/kBT > −10. This corresponds to a quasilinear chevron regime with a significantly wide range of native stability comparable to many real, small, single-domain proteins (25). Accordingly, this region of the ln kf versus ΔGf/kBT curves in the left panel of Fig. 8 resembles that in Fig. 5 for NTL9. At the same time, this set of model results also shows a clear chevron rollover for ΔGf/kBT < −15. Consequently, the curves in this region of the left panel of Fig. 8 exhibit a trend similar to that in Fig. 6 for barnase. When an isostability analysis identical to that in Figs. 5 and 6 is performed on these simulated rates, a single Arrhenius dependence is seen to cover both the quasilinear chevron regime and the stability regime with severe chevron rollover (Fig. 8, right panel). In this case, the slope (≈20,000) of the Arrhenius dependence follows directly from the assumed temperature-dependence timescale given by the quantity −ln [A(T)/A0] in Kaya and Chan (25), an input parameter of the model. Thus, in essence, this model attributes the entire intrinsic enthalpic folding barrier to the pre-exponential (front) factor that governs conformational diffusion (10,34), and thus is equivalent to “Model I” of Scalley and Baker (3). It is conceptually difficult, however, to justify a uniformly high enthalpic barrier for all conformational transitions. Therefore, further investigation is imperative.
FIGURE 8.

A lattice modeling scenario that assumes an intrinsic enthalpic barrier can reproduce trends from isostability kinetic analyses. Results in this figure are based on the model in Fig. 1 with ground-state energy = −42. (Left panel) Logarithmic folding rate versus native stability. The chain move set and all other aspects of the kinetic model are identical to that in Ref. 25; compare to Fig. 5 of this reference. ΔGf is determined by standard Monte Carlo histogram techniques and sampling at ε/kBT = −0.91. Here the dotted curve (with a smaller curvature) connects datapoints (not shown individually) of simulated constant-T logarithmic folding rates [ln kf(ΔGf/kBT;T0)], each averaged over 500 trajectories. This serves as a model for varying denaturant concentration. On the other hand, the solid curve provides the T-dependent logarithmic folding rate ln kf(ΔGf/kBT;T), obtained by combining the dependence of ln kf on the model zero-denaturant interaction strength ε0/kBT with a hypothetical T-dependence of ε0 and a hypothetical T-dependent intrinsic conformational transition rate. Both hypothetical ingredients used here correspond to that in Fig. 7 b of Ref. 25. (Right panel) By construction, the difference between the two isostability logarithmic folding rates of this model is linear in 1/T.
Common continuum Gō models exhibit no isostable enthalpic barriers
To explore whether intrinsic enthalpic folding barriers ΔHi‡ of significant magnitudes are predicted by common continuum Gō-like native centric models, Fig. 9 compares two sets of kinetics of the scaled model. As discussed above, by design the constant-T, variable-ε simulations model experimental variations of denaturant concentration at constant temperature, whereas the constant-ε, variable-T simulations model experimental variations of temperature at constant denaturant concentration. Zero-denaturant conditions are identified with a certain choice of constant ε. It is important to note that ΔHi‡ is different from the common enthalpic folding barrier obtained simply from a set of T-dependent folding rates whereas other conditions are kept constant. ΔHi‡ should be more amenable to modeling because the peculiar stability effect of hydrophobic-like temperature dependence has been factored out in the determination of ΔHi‡ (3).
FIGURE 9.

The negative logarithmic folding (open symbols) and unfolding (solid symbols) MFPTs of the scaled model in Fig. 4 as functions of ε/kBT at constant temperature (T = T0 = 0.82, circles) are compared with corresponding logarithmic MFPTs simulated at different temperatures with a constant interaction energy parameter (ε = 0.725, squares). The Vstretching term in both sets of simulations are identical and independent of ε, with Kr = 72.5. The solid and dashed curves passing respectively through the circles and squares are guides for the eye. Definition of folding and unfolding first passage and the number of trajectories used in MFPT averaging are the same as that in Fig. 4.
Based on the data in Fig. 9, an isostability analysis of the model folding rates is presented in Fig. 10. Unlike the above experimental (Figs. 5 and 6) and lattice-model (Fig. 8) isostability plots showing significant differences between constant-T versus variable-T folding rates, the left panel of Fig. 10 indicates that for the scaled model the two sets of rates are essentially identical. This isostability result follows directly from a similar ε/kBT-dependent trend in Fig. 9 because ΔGf/kBT is essentially linear in ε/kBT. Consequently, the right panel of Fig. 10 shows that ΔHi‡ ≈ 0 (slope ≈ 0). Therefore, with the present approach to modeling T and [d] variations, the scaled model does not predict a nonzero ΔHi‡.
FIGURE 10.

Isostability kinetic analysis of the scaled model results in Fig. 9. (Left panel) Logarithmic folding rates are given by the negative logarithmic folding MFPTs in Fig. 9; ΔGf is obtained by standard Monte Carlo histogram techniques (Figs. 3 and 4). Here ln kf values from constant-T simulations (open circles, ln kf(ΔGf/kBT;T0)) and constant-ε simulations (solid circles, ln kf(ΔGf/kBT;T)) are compared. (Right panel) The difference between the two model isostability logarithmic folding rates is essentially zero.
Fig. 11 applies the same constant-T versus variable-T analysis to the “without-solvation-SSR” model. As described by Kaya and Chan (10), this is a variation of the without-solvation model; the SSR construct posits shorter spatial ranges for the favorable native-centric contact-like interactions. Similar to the without-solvation model—but unlike the scaled model, the SSR model does not impart an extra energetic favorability to the native state as a whole. Similar to Fig. 9, the upper panel of Fig. 11 shows that the constant-T and variable-T folding rates are nearly coincident. Since ΔGf/kBT is a function of ε/kBT (lower panel of Fig. 11, where unfolding free energy = −ΔGf), the near-coincidence of the two sets of rates implies that, in the present implementation, the without-solvation-SSR model does not possess a nonzero ΔHi‡.
FIGURE 11.

Isostability consideration of the without-solvation-SSR NCS2 model for CI2 in Kaya and Chan (10). (Upper panel) Negative logarithmic MFPTs for folding (open symbols) and unfolding (solid symbols) as functions of −ε/kBT for variable-ε, constant temperature simulations (T = T0 = 0.64, circles) and variable-T, constant ε simulations (ε = 0.99, squares); Kr = 99 for both sets of simulations. Each MFPT datapoint is averaged from ∼400 trajectories except ∼100 trajectories are used per datapoint around the transition midpoint. Fitted curves are guides for the eye. Folding simulations are initiated from a random conformation; first passage for folding is defined by the chain achieving Q = 1. Unfolding simulations are initiated from a Q = 1 conformation; first passage of unfolding is achieved when Q ≤ 25/142. (Lower panel) Native stabilities from histogram techniques are given here by the natural logarithm of the Boltzmann population of the folded state (Q ≥ 137/142) minus that of the denatured population with Q ≤ 35/142 (solid curve) and Q ≤ 80/142 (dashed curve). The V-shaped lines in the upper panel are a hypothetical two-state chevron plot consistent with the solid native stability curve in the lower panel. The vertical line indicates that there is a small mismatch between the thermodynamic and kinetic transition midpoints of this model. As in the original formulation of Kaya and Chan (10), the present Langevin formulation does not contain a δ-function-like force term for the apparent discontinuity in pairwise interaction at rij = 1.2 r′ij as depicted in Fig. 3 b of Kaya and Chan for the without-solvation-SSR model. This implies that effectively all rij ≤ 1.2 r′ij values of pairwise interaction energy for this model in Fig. 3 b of Kaya and Chan should be upshifted by −ε[5(1/1.2)12 − 6(1/1.2)10] = 0.408ε such that the interaction energy is continuous. The conclusions of Kaya and Chan regarding the SSR models are not affected by this correction. Results from direct simulations (these include all kinetic data) remain unchanged. However, several results in Kaya and Chan that involve applications of thermodynamic histogram techniques need to be adjusted as follows: The heat capacity peaks of curves ii and iii in Fig. 5 of Kaya and Chan should be reduced to ≈3000 and 3500, respectively. The NCS2 stability curves and the hypothetical two-state chevron plot in Fig. 8 of Kaya and Chan should be replaced by the results in this figure; the corresponding corrections for NCS1 are very similar (data not shown). The front factor analysis for the without-solvation-SSR model in Fig. 12 d of Kaya and Chan should be replaced by the corresponding results in Fig. 13 b of the present article.
Models with elementary desolvation barriers: cooperativity increases with desolvation barrier height
Fig. 12 further extends the isostability analysis to a class of “with-solvation” models (10,50). Unlike the scaled model, these models do not provide extra energetic favorability to the native state as a whole. A key feature that distinguishes the with-solvation models is that their favorable native-centric contact-like interactions are governed by potential functions with desolvation barriers, which are introduced to take into account the particulate nature of water and mimic similar effects deduced from explicit-water simulations of potentials of mean force (10,50–57). In principle, the height of these barrier may be deduced from explicit-water simulations of solvent-mediated interactions among small nonpolar solutes. However, desolvation barrier heights from such simulations are often sensitive to the water model used (58,59) and are fundamentally dependent upon temperature and also not pairwise additive (59,60). It follows that the pairwise desolvation barriers in the present with-solvation models should be viewed as effective, “renormalized” quantities.
FIGURE 12.

(a) Isostability consideration of the with-solvation NCS2 model for CI2 in Kaya and Chan (10), with the desolvation barrier height ε″ = 0.1ε. Notation and the kinetic definitions of folding and unfolding are identical to that for the upper panel of Fig. 11. Each MFPT datapoint here is averaged from ∼400 trajectories except ∼100 trajectories are used per datapoint around the transition midpoint. Fitted curves are mere guides for the eye. The variable-ε, constant temperature simulations (circles) are performed at T0 = 0.82, whereas the variable-T, constant ε simulations (squares) are performed at ε = 0.92; Kr = 92 in both sets of simulations. The dashed V-shaped lines represent a hypothetical chevron plot that would be consistent with the population-based free energy difference between the folded and unfolded states determined from histogram techniques. The vertical double arrow marks a quasilinear (two-state-like) regime of the simulated chevron behavior. (b) Same as a except a higher pairwise desolvation barrier ε″ = 0.2ε is employed. Here ∼400 trajectories are used for each MFPT datapoint, except ∼50 trajectories each are used for MFPTs around the transition midpoint. (c) Same as a and b except for an even higher pairwise desolvation barrier ε″ = 5ε/9, and ε′ = ε/3. This prescription is identical to that of Cheung et al. (50). More than 150 trajectories are used to determine each of the MFPT datapoints shown. (Note that the expression (ε″ + ε′)/(ε′ − ε) on page 916 of Ref. 10 should read (ε″ + ε′)/(ε − ε′).) Owing to a technical oversight noted in the Corrigendum to Kaya and Chan (10), some results of the with-solvation models reported in Kaya and Chan were inaccurate. The errors are minor near the models' transition midpoint, as for Fig. 4 c and Fig. 6 of Kaya and Chan, but are larger under strongly folding and strongly unfolding conditions, necessitating the following corrections: The heat capacity curves iv and v in Fig. 5 of Kaya and Chan should both peak at kBT ≈ 0.88 and each peak value should be reduced by ≈5%. The first passage time distribution in Fig. 11 c of Kaya and Chan and the estimated single-exponential slopes and t0 should be replaced by the results in Fig. 13 of the present article. The front factor analysis for the with-solvation model in Fig. 12 d of Kaya and Chan should be replaced by the corresponding results in the present Fig. 13 b.
Fig. 12 shows that kinetic cooperativity increases with desolvation barrier height. Whereas the model in Fig. 12 a with a low desolvation barrier has a quasilinear regime along the folding chevron arm that extends to a native stability of only −ΔGf ≈ 6 kBT, the corresponding chevron plot for the model in Fig. 12 b with a higher desolvation barrier has a quasilinear regime that extends to a higher −ΔGf ≈ 8 kBT (compare the double arrows in Fig. 12, a and b). For the model in Fig. 12 c with an even higher desolvation barrier, corresponding to the one proposed originally by Cheung et al. (50), it is not yet practical to compute a full, accurate chevron plot with our available computational resources because of the very slow folding and unfolding rates near the transition midpoint. Nonetheless, by matching the hypothetical two-state V-shape (obtained using bias potentials as in Fig. 3) with the directly simulated folding and unfolding rates under conditions somewhat removed from the transition midpoint, it is quite apparent that for this case the quasilinear regime of the folding chevron arm would most likely reach a native stability of −ΔGf > 10 kBT, and thus satisfies an empirical criterion for kinetic cooperativity (25). This new result supersedes a previous observation by Kaya and Chan (10), based on the model in Fig. 12 a, that pairwise additive solvation-like contribution is insufficient for kinetic cooperativity. Fig. 12 now indicates that kinetic cooperativity is likely achievable in models with sufficiently high pairwise desolvation barriers.
We now turn to the question of how the with-solvation modeling framework may or may not produce an intrinsic enthalpic folding barrier. This issue is not identical to that of cooperativity: The results on the scaled model above demonstrate clearly that a thermodynamically and kinetically cooperative model can still be lacking a nonzero ΔHi‡. Now, similar to the approach taken for other continuum models studied above, in this first evaluation we have made the simplifying assumption in Fig. 12 that variations in denaturant concentration may be roughly captured by uniform, proportional changes of all native-centric forces in the model, including the potentials with desolvation barriers. Under this assumption, Fig. 12 shows that the constant-T and variable-T rates are essentially identical, irrespective of desolvation barrier height (and thus irrespective of cooperativity), very much similar to the situations in Fig. 9 and the upper panel of Fig. 11. This means that no intrinsic enthalpic folding barrier is predicted by the present with-solvation construct if a fixed proportionality relation is imposed between pairwise desolvation barrier height and contact minimum energy. However, these observations do not preclude the possibility that more sophisticated variations of these models may lead to intrinsic enthalpic barriers; but that remains to be explored.
Kinetic relaxation and the transition state picture
The relaxation properties of the with-solvation model with a low pairwise desolvation barrier is examined in Fig. 13 a. Despite this model's chevron rollover, and similar to the behavior of the without-solvation and without-solvation-SSR models (10), the distributions of first passage times (61,62) in this figure show that both the folding relaxation under moderately folding conditions (ε = 0.98, ΔGf ≈ −10 kBT) and unfolding relaxation under moderately unfolding conditions (ε = 0.83 or 0.88, ΔGf ≈ 9 kBT) are essentially single-exponential. Generally speaking, if the relaxation is single-exponential and P(t)dt is the probability for the folding or unfolding first passage time (FPT) to lie within a range dt around time t, then
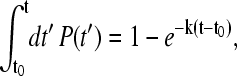 |
(13) |
where k is the (single-exponential) kinetic rate, and t0 ≥ 0 is a minimum FPT to take into consideration the finite time needed for pre-equilibration after initiation of the kinetic process at t = 0. In that case, for any finite FPT bin size Δt, ln [P(t)Δt] versus t should be a straight line with slope = −k = −(MFPT − t0)−1 (10). Fig. 13 a indicates that this relation indeed holds to a good approximation for all four sets of rates shown. (Note that in principle FPT distributions can be determined experimentally by single-molecule measurements; see, e.g., Refs. 63,64.)
FIGURE 13.

Single-exponential relaxation and front-factor contribution to chevron rollover. (a) Unfolding (open symbols) and folding (solid symbols) first passage time (FPT) distribution for the NCS2 with-solvation model in Fig. 12 a (circles). The corresponding NCS1 with-solvation model results (squares) are included for comparison (compare to Fig. 11 of Ref. 10). The vertical variable P(t)Δt is the probability for the FPT to lie within a range Δt around time t. The conditions for the present NCS1 unfolding and folding and NCS2 unfolding and folding are, in the same order, ε = 0.88, 0.98, 0.83, and 0.98; Δt/105 = 5.0, 7.5, 2.0, and 1.5; and the number of trajectories simulated are 1500, 1200, 1500, and 1200, respectively. The corresponding set of least-square fitted {[106 × (MFPT − t0)−1], [−106 × slope]} values for self-consistency checks are {1.59, 1.72}, {0.99, 0.97}, {3.83, 4.32}, and {0.43, 0.44}. (b) Front factor analysis for folding (solid symbols) and unfolding (open symbols) of the present without-solvation-SSR model (squares) and with-solvation model in Fig. 12 a (circles). The vertical variable here is given by lnℱ = −ln(MFPT) + ΔG‡/kBT, where values of the kinetic activation quantity ΔG‡/kBT are defined as in Fig. 12 of Kaya and Chan (10) in terms of the order parameter Q along the free energy profiles of the models (detailed data not shown). Results in this figure are obtained using Kr = 100ε as in Ref. 10.
Model chevron rollovers in Figs. 11 and 12 may be analyzed using the conventional protein-folding transition-state picture (65), which posits that folding or unfolding rate is given by
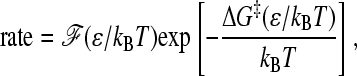 |
(14) |
where ΔG‡ is a thermodynamics-determined activation free energy and ℱ is the corresponding front (pre-exponential) factor (the function ℱ(ε/kBT) here is equivalent to the function F(ε, T) in Eq. 7 of Ref. 10). Fig. 13 b performs such an analysis for the without-solvation-SSR and one of the with-solvation models, with rate set equal to (MFPT)−1 from the kinetic simulations. For these models, rate essentially depends only on the quantity ε/kBT (Figs. 11 and 12). Similar to our previous conclusion for the without-solvation model (10), Fig. 13 b shows that if the activation free energy is defined by a Q-based free energy profile, chevron rollovers in the without-solvation-SSR and without-solvation models may be attributed to nonconstant front factors that are highly sensitive to ε/kBT. This phenomenon has been related to energy landscape ruggedness and kinetic trapping (9,24,66). But the microscopic basis of chevron rollover (46,67,68) and their precise relationship with other free-energy-profile-based scenarios (69,70) remain to be better elucidated.
Connection between thermodynamic and kinetic cooperativity
The interaction schemes of the continuum scaled model and the lattice construct in Fig. 1 may be termed “near-Levinthal” scenarios (25). Unlike common Gō models with essentially pairwise additive interactions but without elementary desolvation barriers, and which have significant chevron rollovers (compare to Fig. 11), the near-Levinthal models produce extended quasilinear regimes of chevron behavior. The key to this success in mimicking the apparent two-state folding of certain real proteins is in weakening the kinetic driving forces for folding in the physical accessible range of native stability (i.e., a less steep energy landscape for most of the conformational space), while at the same time ensuring sufficient thermodynamic stability by imparting an extra favorability to the native state as a whole (i.e., the native part of the energy landscape is “pulled down”). Thus, these model energy landscapes share some similarities with (though not identical to) the golf-course-like Levinthal landscape (47).
In the same vein, for models with pairwise desolvation barriers (Fig. 12), folding kinetics is expected to become two-state-like when the desolvation barrier heights are sufficiently high because the desolvation barriers tend to destabilize conformations with intermediate compactness and partially native structures. Thus, for a significant fraction of the conformational space encompassing open and semicompact chains, the desolvation barriers have a major effect in the reduction of the average energetic drive toward the native structure, while maintaining a high degree of thermodynamic stability for the native state as a whole (after all desolvation barriers are surmounted). As such, models with extra favorability for the native state as a whole as well as models with high pairwise desolvation barriers may be viewed as near-Levinthal interaction schemes. They both increase the thermodynamic cooperativity of the model by disfavoring conformations with intermediate energetic favorability. Therefore, their two-state-like folding kinetics suggests that thermodynamic and kinetic cooperativity in protein folding should be strongly correlated.
To further illustrate this general perspective, we consider another recently proposed lattice model (Fig. 14), which entails many-body, non-pairwise-additive interactions in the form of a presumed nonlinear relationship between energy and the fractional number of native contacts Q (30). Relative to the common Gō potential, this interaction scheme reduces the population of conformations with energies intermediate between those of the ground state and the fully unfolded state (Fig. 14, upper panel). Therefore, this model corresponds also to a near-Levinthal scenario with enhanced thermodynamic cooperativity. Its physics is qualitatively similar to that in Fig. 1. Consistent with the expected correlation between thermodynamic and kinetic cooperativity, the lower panel of Fig. 14 shows that the chevron plot of this model exhibits a quasilinear regime that extends to a native stability ΔGf ≈ −10 kBT (compare to Ref. 25).
FIGURE 14.

Thermodynamics and chevron behavior of the cooperative interaction scheme of Jewett et al. (30). The 27-mer lattice model in Fig. 1 is used in the present analysis. (Upper panel) The density of states of the common Gō model (solid curve, same as that in Fig. 1) is compared with that of the Jewett et al. interaction scheme (dashed curve). (Lower panel) Chevron plot of the Jewett et al. model. Folding (open circles) is initiated from a random conformation, and is completed when Q = 1. Besides the interaction scheme, the chain move set and other aspects of the kinetic model are identical to that in Kaya and Chan (25). Unfolding (solid circles) is initiated from the Q = 1 ground-state conformation, and unfolding first passage is achieved when Q ≤ 3/28. Each MFPT datapoint is averaged from 100 trajectories. The V-shaped lines is a hypothetical chevron plot consistent with the thermodynamic free energy difference between the folded (Q = 1) and unfolded (Q ≤ 3/28) conformations. Thermodynamic stability is estimated by standard Monte Carlo histogram techniques based on sampling at ε/kBT = −1.35. The arrow marks the interaction strength at which ΔGf = −10 kBT.
Conversely, Fig. 15 suggests that two-state-like kinetic cooperativity is unlikely in the absence of a high degree of thermodynamic cooperativity. The thermodynamic folding-unfolding transition of this lattice side-chain model has been shown to be sharper than that of the corresponding main-chain-only model, offering much insight (35). However, perhaps because of its short chain length, this particular side-chain model has also been demonstrated to fall short of meeting the calorimetric two-state criterion (25) (compare to Figs. 9 and 11 d of Ref. 71). Now, consistent with the expected correlation between thermodynamic and kinetic cooperativity, the severe chevron rollovers in Fig. 15 means that the folding kinetics of this model is not two-state-like. Several different definitions of folding and unfolding were explored. In all cases considered, folding rate decreases as the model protein becomes more stable as −ε/kBT takes increasingly more negative values than that of the transition midpoint as defined by the model's heat capacity peak (vertical line at ε ≈ 3.75 kBT). Since the interactions in this model are temperature independent, native stability (−ΔGf) must increase monotonically with more negative values of −ε/kBT, even though this dependence may not be linear. Therefore, irrespective of the exact form of ΔGf's dependence on ε/kBT, this model predicts a decreasing folding rate with native stability increasing from the transition midpoint. This behavior is qualitatively similar to that of an earlier three-dimensional, two-letter, main-chain-only model, but is different from the experimental behavior of many small, single-domain real proteins (2). As noted before, however, not all proteins fold in an apparent two-state manner. In this regard, thermodynamically less cooperative models such as the one in Fig. 15 can be extremely useful for elucidating the folding/unfolding kinetics of thermodynamically non-two-state proteins, including those in the hypothesized yet controversial scenario of “downhill” folding (72–79).
FIGURE 15.

Chevron behavior of the 15-mer, three-dimensional, 20-letter lattice side-chain model of Klimov and Thirumalai (35). The interaction strength ε/kBT here is equivalent to the parameter 1/T in the original reference. Folding simulations are initiated from the ground-state conformation (energy = −14.5). Unfolding simulations are initiated from randomly generated conformations. The solid squares, triangles, and circles are −ln(MFPT) values for folding with first passage defined respectively by energy becoming ≤−12.5, ≤−13.5, and ≤−14.5. The open squares, triangles, and circles are −ln(MFPT) values for unfolding with first passage defined respectively by energy reaching a value ≥−4.2, ≥−3.2, and ≥−2.2. Each simulated MFPT datapoint is averaged from 500 trajectories. Continuous lines and curves are mere guides for the eye. The move set used in the kinetic simulations consists of end, corner, crankshaft, and side-chain moves, as in the original reference. The vertical line marks the interaction strength at the heat capacity peak of this model (compare to Fig. 2 c of Ref. 35 and Fig. 9 of Ref. 71).
CONCLUDING REMARKS
The focus on cooperativity and many-body interactions (2) has been increasingly sharpened in recent experimental (80,81) and theoretical (82) investigations of protein folding. Here we have shown that a continuum protein chain model (the scaled model) that imparts extra favorability to the native state as a whole can lead to chevron plots with extended quasilinear regimes. As well, kinetic cooperativity is seen to increase with desolvation barrier height in a class of models that embody pairwise desolvation barriers. These findings suggest that desolvation barriers are a major contributor to protein folding cooperativity (50), and that part of the physical mechanisms for apparent two-state folding may also lie in a partial separation of kinetic driving force for folding on one hand, and the interactions that stabilize the protein native state against unfolding on the other (25). This study is largely limited to native-centric approaches. In the future, it would be extremely instructive to pursue the same fundamental issues using more sophisticated chain representations and general, non-native-centric potential functions (e.g., Refs. 83–85).
Cooperativity is closely related to temperature effects in protein folding (see, e.g., Ref. 86). A simple approximate mathematical relation entailing a high intrinsic enthalpic barrier ΔHi‡ that links isostable folding rates under different temperature/denaturant conditions has been shown previously to hold for several apparent two-state proteins. Here we develop a generalized formulation for this empirical observation, and discover that an extension of this relation is likely to apply to barnase as well. This finding, which links Eyring and chevron plots by a single enthalpic term, suggests that the existence of a high isostable ΔHi‡ may be a robust feature for at least some non-two-state as well as two-state folders. As is evident from previous lattice efforts (33), this generic protein property should be amenable to rationalization through modeling. However, simple extensions of several common continuum native-centric Gō-like models are found to be insufficient to reproduce this experimental behavior, suggesting that more sophisticated approaches will be needed. The physics of this remarkable yet seldom explored regularity in protein folding remains to be better understood.
Acknowledgments
We thank the Canadian Institutes of Health Research (CIHR grant No. MOP-15323) and the Canada Research Chairs Program for financial support.
Hüseyin Kaya's present address is Dept. of Chemistry and Chemical Biology, Harvard University, 12 Oxford St., Cambridge, MA 02138.
References
- 1.Jackson, S. E., and A. R. Fersht. 1991. Folding of chymotrypsin inhibitor 2. I. Evidence for a two-state transition. Biochemistry. 30:10428–10435. [DOI] [PubMed] [Google Scholar]
- 2.Chan, H. S., S. Shimizu, and H. Kaya. 2004. Cooperativity principles in protein folding. Methods Enzymol. 380:350–379. [DOI] [PubMed] [Google Scholar]
- 3.Scalley, M. L., and D. Baker. 1997. Protein folding kinetics exhibit an Arrhenius temperature dependence when corrected for the temperature dependence of protein stability. Proc. Natl. Acad. Sci. USA. 94:10636–10640. [DOI] [PMC free article] [PubMed] [Google Scholar]
- 4.Kuhlman, B., D. L. Luisi, P. A. Evans, and D. P. Raleigh. 1998. Global analysis of the effects of temperature and denaturant on the folding and unfolding kinetics of the N-terminal domain of the protein L9. J. Mol. Biol. 284:1661–1670. [DOI] [PubMed] [Google Scholar]
- 5.Daggett, V. 2002. Molecular dynamics simulations of the protein unfolding/folding reaction. Acc. Chem. Res. 35:422–429. [DOI] [PubMed] [Google Scholar]
- 6.Gnanakaran, S., H. Nymeyer, J. Portman, K. Y. Sanbonmatsu, and A. E. García. 2003. Peptide folding simulations. Curr. Opin. Struct. Biol. 13:168–174. [DOI] [PubMed] [Google Scholar]
- 7.Rhee, Y. M., E. J. Sorin, G. Jayachandran, E. Lindahl, and V. S. Pande. 2004. Simulations of the role of water in the protein-folding mechanism. Proc. Natl. Acad. Sci. USA. 101:6456–6461. [DOI] [PMC free article] [PubMed] [Google Scholar]
- 8.Matthews, C. R. 1987. Effect of point mutations on the folding of globular proteins. Methods Enzymol. 154:498–511. [DOI] [PubMed] [Google Scholar]
- 9.Kaya, H., and H. S. Chan. 2002. Towards a consistent modeling of protein thermodynamic and kinetic cooperativity: how applicable is the transition state picture to folding and unfolding? J. Mol. Biol. 315:899–909. [DOI] [PubMed] [Google Scholar]
- 10.Kaya, H., and H. S. Chan. 2003. Solvation effects and driving forces for protein thermodynamic and kinetic cooperativity: how adequate is native-centric topological modeling? J. Mol. Biol. 326:911–931. Corrigendum: 337:1069–1070 (2004). [DOI] [PubMed] [Google Scholar]
- 11.Thirumalai, D., and D. K. Klimov. 1999. Deciphering the timescales and mechanisms of protein folding using minimal off-lattice models. Curr. Opin. Struct. Biol. 9:197–207. [DOI] [PubMed] [Google Scholar]
- 12.Head-Gordon, T., and S. Brown. 2003. Minimalist models for protein folding and design. Curr. Opin. Struct. Biol. 13:160–167. [DOI] [PubMed] [Google Scholar]
- 13.Micheletti, C., J. R. Banavar, A. Maritan, and F. Seno. 1999. Protein structures and optimal folding from a geometrical variational principle. Phys. Rev. Lett. 82:3372–3375. [Google Scholar]
- 14.Shea, J.-E., J. N. Onuchic, and C. L. Brooks III. 1999. Exploring the origins of topological frustration: design of a minimally frustrated model of fragment B of protein A. Proc. Natl. Acad. Sci. USA. 96:12512–12517. [DOI] [PMC free article] [PubMed] [Google Scholar]
- 15.Zhou, Y., and M. Karplus. 1999. Interpreting the folding kinetics of helical proteins. Nature. 401:400–403. [DOI] [PubMed] [Google Scholar]
- 16.Clementi, C., H. Nymeyer, and J. N. Onuchic. 2000. Topological and energetic factors: what determines the structural details of the transition state ensemble and “en-route” intermediates for protein folding? An investigation for small globular proteins. J. Mol. Biol. 298:937–953. [DOI] [PubMed] [Google Scholar]
- 17.Li, L., and E. I. Shakhnovich. 2001. Constructing, verifying, and dissecting the folding transition state of chymotrypsin inhibitor 2 with all-atom simulations. Proc. Natl. Acad. Sci. USA. 98:13014–13018. [DOI] [PMC free article] [PubMed] [Google Scholar]
- 18.Cieplak, M., and T. X. Hoang. 2003. Universality classes in folding times of proteins. Biophys. J. 84:475–488. [DOI] [PMC free article] [PubMed] [Google Scholar]
- 19.Zhang, J., Q. Meng, and W. Wang. 2005. Multiple folding mechanisms of protein ubiquitin. Proteins Struct. Funct. Bioinform. 59:565–579. [DOI] [PubMed] [Google Scholar]
- 20.Chavez, L. L., J. N. Onuchic, and C. Clementi. 2004. Quantifying the roughness on the free energy landscape: entropic bottlenecks and protein folding rates. J. Am. Chem. Soc. 126:8426–8432. [DOI] [PubMed] [Google Scholar]
- 21.Li, M. S., D. K. Klimov, and D. Thirumalai. 2004. Thermal denaturation and folding rates of single domain proteins: size matters. Polym. 45:573–579. [Google Scholar]
- 22.Jackson, S. E. 1998. How do small single-domain proteins fold? Fold. Des. 3:R81–R91. [DOI] [PubMed] [Google Scholar]
- 23.Baker, D. 2000. A surprising simplicity to protein folding. Nature. 405:39–42. [DOI] [PubMed] [Google Scholar]
- 24.Kaya, H., and H. S. Chan. 2003. Origins of chevron rollovers in non-two-state protein folding kinetics. Phys. Rev. Lett. 90:258104. [DOI] [PubMed] [Google Scholar]
- 25.Kaya, H., and H. S. Chan. 2003. Simple two-state protein folding kinetics requires near-Levinthal thermodynamic cooperativity. Proteins Struct. Funct. Genet. 52:510–523. [DOI] [PubMed] [Google Scholar]
- 26.Kaya, H., and H. S. Chan. 2003. Contact order dependent protein folding rates: kinetic consequences of a cooperative interplay between favorable nonlocal interactions and local conformational preferences. Proteins Struct. Funct. Genet. 52:524–533. [DOI] [PubMed] [Google Scholar]
- 27.Plaxco, K. W., K. T. Simons, and D. Baker. 1998. Contact order, transition state placement and the refolding rates of single domain proteins. J. Mol. Biol. 277:985–994. [DOI] [PubMed] [Google Scholar]
- 28.Northey, J. G. B., A. A. Di Nardo, and A. R. Davidson. 2002. Hydrophobic core packing in the SH3 domain folding transition state. Nat. Struct. Biol. 9:126–130. [DOI] [PubMed] [Google Scholar]
- 29.Di Nardo, A. A., D. M. Korzhnev, P. J. Stogios, A. Zarrine-Afsar, L. E. Kay, and A. R. Davidson. 2004. Dramatic acceleration of protein folding by stabilization of a nonnative backbone conformation. Proc. Natl. Acad. Sci. USA. 101:7954–7959. [DOI] [PMC free article] [PubMed] [Google Scholar]
- 30.Jewett, A. I., V. S. Pande, and K. W. Plaxco. 2003. Cooperativity, smooth energy landscapes and the origins of topology-dependent protein folding rates. J. Mol. Biol. 326:247–253. [DOI] [PubMed] [Google Scholar]
- 31.Segawa, S., and M. Sugihara. 1984. Characterization of the transition state of lysozyme unfolding. I. Effect of protein-solvent interactions on the transition state. Biopolymers. 23:2473–2488. [DOI] [PubMed] [Google Scholar]
- 32.Dimitriadis, G., A. Drysdale, J. K. Myers, P. Arora, S. E. Radford, T. G. Oas, and D. A. Smith. 2004. Microsecond folding dynamics of the F13W G29A mutant of the B domain of staphylococcal protein A by laser-induced temperature jump. Proc. Natl. Acad. Sci. USA. 101:3809–3814. [DOI] [PMC free article] [PubMed] [Google Scholar]
- 33.Chan, H. S. 1998. Modelling protein folding by Monte Carlo dynamics: chevron plots, chevron rollover, and non-Arrhenius kinetics. In Monte Carlo Approach to Biopolymers and Protein Folding. P. Grassberger, G.T. Barkema, and W. Nadler, editors. World Scientific, Singapore. 29–44.
- 34.Chan, H. S., and K. A. Dill. 1998. Protein folding in the landscape perspective: chevron plots and non-Arrhenius kinetics. Proteins Struct. Funct. Genet. 30:2–33. [DOI] [PubMed] [Google Scholar]
- 35.Klimov, D. K., and D. Thirumalai. 1998. Cooperativity in protein folding: from lattice models with sidechains to real proteins. Fold. Des. 3:127–139. [DOI] [PubMed] [Google Scholar]
- 36.Koga, N., and S. Takada. 2001. Roles of native topology and chain-length scaling in protein folding: a simulation study with a Gō-like model. J. Mol. Biol. 313:171–180. [DOI] [PubMed] [Google Scholar]
- 37.Knott, M., H. Kaya, and H. S. Chan. 2004. Energetics of protein thermodynamic cooperativity: contributions of local and nonlocal interactions. Polym. 45:623–632. [Google Scholar]
- 38.Veitshans, T., D. Klimov, and D. Thirumalai. 1997. Protein folding kinetics: timescales, pathways and energy landscapes in terms of sequence-dependent properties. Fold. Des. 2:1–22. [DOI] [PubMed] [Google Scholar]
- 39.Schindler, T., and F. X. Schmid. 1996. Thermodynamic properties of an extremely rapid protein folding reaction. Biochemistry. 35:16833–16842. [DOI] [PubMed] [Google Scholar]
- 40.Tan, Y. J., M. Oliveberg, and A. R. Fersht. 1996. Titration properties and thermodynamics of the transition state for folding: comparison of two-state and multi-state folding pathways. J. Mol. Biol. 264:377–389. [DOI] [PubMed] [Google Scholar]
- 41.van Nuland, N. A. J., W. Meijberg, J. Warner, V. Forge, R. M. Scheek, G. T. Robillard, and C. M. Dobson. 1998. Slow cooperative folding of a small globular protein HBr. Biochemistry. 37:622–637. [DOI] [PubMed] [Google Scholar]
- 42.Oliveberg, M., Y. J. Tan, and A. R. Fersht. 1995. Negative activation enthalpies in the kinetics of protein folding. Proc. Natl. Acad. Sci. USA. 92:8926–8929. [DOI] [PMC free article] [PubMed] [Google Scholar]
- 43.Oliveberg, M., and A. R. Fersht. 1996. Thermodynamics of transient conformations in the folding pathway of barnase: reorganization of the folding intermediate at low pH. Biochemistry. 35:2738–2749. [DOI] [PubMed] [Google Scholar]
- 44.Matouschek, A., J. T. Kellis, L. Serrano, M. Bycroft, and A. R. Fersht. 1990. Characterizing transient folding intermediates by protein engineering. Nature. 346:440–445. [DOI] [PubMed] [Google Scholar]
- 45.Dalby, P. A., M. Oliveberg, and A. R. Fersht. 1998. Folding intermediates of wild-type and mutants of barnase. I. Use of φ-value analysis and m-values to probe the cooperative nature of the folding pre-equilibrium. J. Mol. Biol. 276:625–646. [DOI] [PubMed] [Google Scholar]
- 46.Khan, F., J. I. Chuang, S. Gianni, and A. R. Fersht. 2003. The kinetic pathway of folding of barnase. J. Mol. Biol. 333:169–186. [DOI] [PubMed] [Google Scholar]
- 47.Dill, K. A., and H. S. Chan. 1997. From Levinthal to pathways to funnels. Nat. Struct. Biol. 4:10–19. [DOI] [PubMed] [Google Scholar]
- 48.Chan, H. S. 2000. Modeling protein density of states: additive hydrophobic effects are insufficient for calorimetric two-state cooperativity. Proteins Struct. Funct. Genet. 40:543–571. [DOI] [PubMed] [Google Scholar]
- 49.Onuchic, J. N., N. D. Socci, Z. Luthey-Schulten, and P. G. Wolynes. 1996. Protein folding funnels: the nature of the transition state ensemble. Fold. Des. 1:441–450. [DOI] [PubMed] [Google Scholar]
- 50.Cheung, M. S., A. E. García, and J. N. Onuchic. 2002. Protein folding mediated by solvation: water expulsion and formation of the hydrophobic core occur after the structural collapse. Proc. Natl. Acad. Sci. USA. 99:685–690. [DOI] [PMC free article] [PubMed] [Google Scholar]
- 51.Hillson, N., J. N. Onuchic, and A. E. García. 1999. Pressure-induced protein-folding/unfolding kinetics. Proc. Natl. Acad. Sci. USA. 96:14848–14853. [DOI] [PMC free article] [PubMed] [Google Scholar]
- 52.Sorenson, J. M., G. Hura, A. K. Soper, A. Pertsemlidis, and T. Head-Gordon. 1999. Determining the role of hydration forces in protein folding. J. Phys. Chem. B. 103:5413–5426. [Google Scholar]
- 53.Guo, C. L., M. S. Cheung, H. Levine, and D. A. Kessler. 2002. Mechanisms of cooperativity underlying sequence-independent β-sheet formation. J. Chem. Phys. 116:4353–4365. [Google Scholar]
- 54.Karanicolas, J., and C. L. Brooks III. 2002. The origins of asymmetry in the folding transition states of protein L and protein G. Protein Sci. 11:2351–2361. [DOI] [PMC free article] [PubMed] [Google Scholar]
- 55.Shea, J.-E., J. N. Onuchic, and C. L. Brooks III. 2002. Probing the folding free energy landscape of the src-SH3 protein domain. Proc. Natl. Acad. Sci. USA. 99:16064–16068. [DOI] [PMC free article] [PubMed] [Google Scholar]
- 56.Fernandez-Escamilla, A. M., M. S. Cheung, M. C. Vega, M. Wilmanns, J. N. Onuchic, and L. Serrano. 2004. Solvation in protein folding analysis: combination of theoretical and experimental approaches. Proc. Natl. Acad. Sci. USA. 101:2834–2839. [DOI] [PMC free article] [PubMed] [Google Scholar]
- 57.Sessions, R. B., G. L. Thomas, and M. J. Parker. 2004. Water as a conformational editor in protein folding. J. Mol. Biol. 343:1125–1133. [DOI] [PubMed] [Google Scholar]
- 58.Hummer, G., S. Garde, A. E. García, M. E. Paulaitis, and L. R. Pratt. 1998. The pressure dependence of hydrophobic interactions is consistent with the observed pressure denaturation of proteins. Proc. Natl. Acad. Sci. USA. 95:1552–1555. [DOI] [PMC free article] [PubMed] [Google Scholar]
- 59.Shimizu, S., and H. S. Chan. 2002. Anti-cooperativity and cooperativity in hydrophobic interactions: three-body free energy landscapes and comparison with implicit-solvent potential functions for proteins. Proteins Struct. Funct. Genet. 48:15–30. Erratum: 49:294 (2002). [DOI] [PubMed] [Google Scholar]
- 60.Moghaddam, M. S., S. Shimizu, and H. S. Chan. 2005. Temperature dependence of three-body hydrophobic interactions: potential of mean force, enthalpy, entropy, heat capacity, and nonadditivity. J. Am. Chem. Soc. 127:303–316. Correction: 127:2363 (2005). [DOI] [PubMed] [Google Scholar]
- 61.Abkevich, V. I., A. M. Gutin, and E. I. Shakhnovich. 1994. Free energy landscape for protein folding kinetics: intermediates, traps, and multiple pathways in theory and lattice model simulations. J. Chem. Phys. 101:6052–6062. [Google Scholar]
- 62.Zhou, Y., C. Zhang, G. Stell, and J. Wang. 2003. Temperature dependence of the distribution of the first passage time: results from discontinuous molecular dynamics simulations of an all-atom model of the second β-hairpin fragment of protein G. J. Am. Chem. Soc. 125:6300–6305. [DOI] [PubMed] [Google Scholar]
- 63.Schuler, B., E. A. Lipman, and W. A. Eaton. 2002. Probing the free-energy surface for protein folding with single-molecule fluorescence spectroscopy. Nature. 419:743–747. [DOI] [PubMed] [Google Scholar]
- 64.Leite, V. B. P., J. N. Onuchic, G. Stell, and J. Wang. 2004. Probing the kinetics of single molecule protein folding. Biophys. J. 87:3633–3641. [DOI] [PMC free article] [PubMed] [Google Scholar]
- 65.Nymeyer, H., N. D. Socci, and J. N. Onuchic. 2000. Landscape approaches for determining the ensemble of folding transition states: success and failure hinge on the degree of frustration. Proc. Natl. Acad. Sci. USA. 97:634–639. [DOI] [PMC free article] [PubMed] [Google Scholar]
- 66.Wang, J. 2004. The complex kinetics of protein folding in wide temperature ranges. Biophys. J. 87:2164–2171. [DOI] [PMC free article] [PubMed] [Google Scholar]
- 67.Chu, R. A., and Y. Bai. 2002. Lack of definable nucleation sites in the rate-limiting transition state of barnase under native conditions. J. Mol. Biol. 315:759–770. [DOI] [PubMed] [Google Scholar]
- 68.Went, H. M., C. G. Benitez-Cardoza, and S. E. Jackson. 2004. Is an intermediate state populated on the folding pathway of ubiquitin? FEBS Lett. 567:333–338. [DOI] [PubMed] [Google Scholar]
- 69.Oliveberg, M. 1998. Alternative explanations for “multistate” kinetics in protein folding: transient aggregation and changing transition-state ensembles. Acc. Chem. Res. 31:765–772. [Google Scholar]
- 70.Sanchez, I. E., and T. Kiefhaber. 2003. Evidence for sequential barriers and obligatory intermediates in apparent two-state protein folding. J. Mol. Biol. 325:367–376. [DOI] [PubMed] [Google Scholar]
- 71.Kaya, H., and H. S. Chan. 2000. Polymer principles of protein calorimetric two-state cooperativity. Proteins Struct. Funct. Genet. 40:637–661. Erratum: 43:523 (2001). [DOI] [PubMed] [Google Scholar]
- 72.Bryngelson, J. D., J. N. Onuchic, N. D. Socci, and P. G. Wolynes. 1995. Funnels, pathways, and the energy landscape of protein folding: a synthesis. Proteins Struct. Funct. Genet. 21:167–195. [DOI] [PubMed] [Google Scholar]
- 73.Sabelko, J., J. Ervin, and M. Gruebele. 1999. Observation of strange kinetics in protein folding. Proc. Natl. Acad. Sci. USA. 96:6031–6036. [DOI] [PMC free article] [PubMed] [Google Scholar]
- 74.Garcia-Mira, M. M., M. Sadqi, N. Fischer, J. M. Sanchez-Ruiz, and V. Muñoz. 2002. Experimental identification of downhill protein folding. Science. 298:2191–2195. [DOI] [PubMed] [Google Scholar]
- 75.Hagen, S. J. 2003. Exponential decay kinetics in “downhill” protein folding. Proteins Struct. Funct. Genet. 50:1–4. [DOI] [PubMed] [Google Scholar]
- 76.Nakamura, H. K., M. Sasai, and M. Takano. 2004. Squeezed exponential kinetics to describe a nonglassy downhill folding as observed in a lattice protein model. Proteins Struct. Funct. Bioinform. 55:99–106. [DOI] [PubMed] [Google Scholar]
- 77.Oliva, F. Y., and V. Muñoz. 2004. A simple thermodynamic test to discriminate between two-state and downhill folding. J. Am. Chem. Soc. 126:8596–8597. [DOI] [PubMed] [Google Scholar]
- 78.Ferguson, N., P. J. Schartau, T. D. Sharpe, S. Sato, and A. R. Fersht. 2004. One-state downhill versus conventional protein folding. J. Mol. Biol. 344:295–301. [DOI] [PubMed] [Google Scholar]
- 79.Meisner, W. K., and T. R. Sosnick. 2004. Barrier-limited, microsecond folding of a stable protein measured with hydrogen exchange: implications for downhill folding. Proc. Natl. Acad. Sci. USA. 101:15639–15644. [DOI] [PMC free article] [PubMed] [Google Scholar]
- 80.Scalley-Kim, M. L., and D. Baker. 2004. Characterization of the folding energy landscapes of computer generated proteins suggests high folding free energy barriers and cooperativity may be consequences of natural selection. J. Mol. Biol. 338:573–583. [DOI] [PubMed] [Google Scholar]
- 81.Feng, H., N.-D. Vu, and Y. Bai. 2004. Detection and structure determination of an equilibrium unfolding intermediate of Rd-apocytochrome b562: native fold with non-native hydrophobic interactions. J. Mol. Biol. 343:1477–1485. [DOI] [PubMed] [Google Scholar]
- 82.Ejtehadi, M. R., S. P. Avall, and S. S. Plotkin. 2004. Three-body interactions improve the prediction of rate and mechanism in protein folding models. Proc. Natl. Acad. Sci. USA. 101:15088–15093. [DOI] [PMC free article] [PubMed] [Google Scholar]
- 83.Irbäck, A., F. Sjunnesson, and S. Wallin. 2000. Three-helix-bundle protein in a Ramachandran model. Proc. Natl. Acad. Sci. USA. 97:13614–13618. [DOI] [PMC free article] [PubMed] [Google Scholar]
- 84.Knott, M., and H. S. Chan. 2004. Exploring the effects of hydrogen bonding and hydrophobic interactions on the foldability and cooperativity of helical proteins using a simplified atomic model. Chem. Phys. 307:187–199. [Google Scholar]
- 85.Clementi, C., and S. S. Plotkin. 2004. The effects of nonnative interactions on protein folding rates: theory and simulation. Protein Sci. 13:1750–1766. [DOI] [PMC free article] [PubMed] [Google Scholar]
- 86.Akmal, A., and V. Muñoz. 2004. The nature of the free energy barriers to two-state folding. Proteins Struct. Funct. Bioinform. 57:142–152. [DOI] [PubMed] [Google Scholar]