

Abstract
Changes in the x-ray diffraction pattern from a frog skeletal muscle were recorded after a quick release or stretch, which was completed within one millisecond, at a time resolution of 0.53 ms using the high-flux beamline at the SPring-8 third-generation synchrotron radiation facility. Reversibility of the effects of the length changes was checked by quickly restoring the muscle length. Intensities of seven reflections were measured. A large, instantaneous intensity drop of a layer line at an axial spacing of 1/10.3 nm−1 after a quick release and stretch, and its partial recovery by reversal of the length change, indicate a conformational change of myosin heads that are attached to actin. Intensity changes on the 14.5-nm myosin layer line suggest that the attached heads alter their radial mass distribution upon filament sliding. Intensity changes of the myosin reflections at 1/21.5 and 1/7.2 nm−1 are not readily explained by a simple axial swing of cross-bridges. Intensity changes of the actin-based layer lines at 1/36 and 1/5.9 nm−1 are not explained by it either, suggesting a structural change in actin molecules.
INTRODUCTION
X-ray diffraction is a unique technique that enables us to directly observe structural changes of proteins in muscle under physiological conditions. The first efforts to obtain an x-ray diffraction pattern from a contracting skeletal muscle were made in the 1960s (1,2). Later, with the advent of synchrotron radiation sources, experiments at a time resolution higher than 10 ms became possible (3). Behavior of cross-bridges after a quick length change has been extensively studied (4–9) and the results supported an axial swing in the neck region of a myosin head in force production (8).
Despite these studies, interpretation of the x-ray diffraction pattern from a contracting muscle is still incomplete. The layer-line reflections from the helical arrangement of myosin heads around the thick filament, which are dominant in a pattern from a relaxed muscle, are very weak in contracting muscle, showing that the arrangement of the heads is disturbed by their interaction with actin. The intensity of layer lines arising from the helical arrangement of actin molecules in the thin filament is generally stronger than in a pattern from a relaxed muscle, showing that myosin heads bind to actin and increase the apparent mass of actin molecules during contraction. However, this enhancement is much smaller than that observed when a muscle goes into rigor and all heads attach to actin. Wakabayashi et al. (10) showed by model calculation that structural changes in the actin molecule alone can account for these small intensity changes. Although this does not completely deny binding of myosin heads to actin, more evidence is required to establish stereospecific interaction of myosin heads with actin.
In these studies, the flux available from synchrotron radiation sources was still not high enough to measure intensities of weak reflections at high time-resolution. Bordas et al. (6) showed that there are numerous weak layer lines in a diffraction pattern from a contracting muscle. Yagi (11) explained some of these as arising from myosin heads that are attached to actin but still maintain their original periodicity along the thick filament. The crystallographic argument suggests that these layer lines arise solely from the heads that are bound to actin. Thus, by studying the intensity changes of these layer lines after a quick length change, conformational changes of attached myosin heads may be studied. However, this experiment has been impracticable because such layer lines are too weak to be measured at high time-resolution.
The high-flux beamline (BL40XU) at SPring-8, which is one of the so-called third-generation synchrotron radiation facilities, has an x-ray flux more than 10 times higher than that available at beamlines which have been used for muscle diffraction experiments so far (12). Using this beamline, it is now possible to record a detailed diffraction pattern from a skeletal muscle in less than 1 ms (13,14).
We performed time-resolved x-ray diffraction experiments with a time resolution of 0.53 ms using this beamline to study changes in the diffraction pattern after a quick length change of a frog skeletal muscle. To study the reversibility of the conformational change, the muscle length was returned to the original length immediately after the length change.
Here we show that:
The intensity changes of the 14.5-nm layer line (including the meridional reflection) and the 10.3-nm layer line from attached myosin heads support an axial conformational change of myosin heads that are still attached to actin.
The intensity changes of the 21.5 and 7.2-nm myosin meridional reflections are not readily explained by the conformational change.
Intensity responses of the actin-based layer lines to the quick length changes also suggest structural changes other than in the attached heads, possibly in the actin molecules.
METHODS
Muscle preparations
Sartorius muscle of a small (body length 6–8 cm) bullfrog (Rana catesbeiana), ∼40-mm long and 5-mm wide, was used. The muscle was held vertically in a specimen chamber, which had two Mylar windows to pass x rays. The bottom (pelvic) end was connected to a strain gauge force transducer (resonance frequency 1.5 kHz) and the tendon end was connected to a servo-controlled motor (General Scanning, Waterton, MA). The sarcomere length was 2.2–2.4 μm. A Ringer solution (composition: 115 mM NaCl, 2.5 mM KCl, 1.8 mM CaCl2, 3.0 mM HEPES, pH 7.2) continuously flowed through the chamber. The temperature was kept at 4–5°C.
The muscle was stimulated supramaximally with electrical pulses (1-ms duration, 50 Hz) for 0.6 s. At ∼0.2 s after the beginning of the stimulation, when the tension had become steady, the motor was activated to change the muscle length (Fig. 1). The amplitude of the motor movement was adjusted to give either ∼1% release or 0.6% stretch to the muscle. The movement of the motor was completed in 1.0 ms. In some experiments, the motor was moved back to the original position at ∼1.5 ms after the beginning of the first length step.
FIGURE 1.

Tension and length of muscle in quick length-change experiments. The blue lines are the length signal recorded from the servo motor and the red lines are the tension. The recording was made with 20-kHz sampling. Tension is normalized to the level in the isometric state. The length is normalized to the maximum displacement which was 1% in release and 0.6% in stretch. (a) Quick release experiment. (b) Release-stretch experiment. A stretch was induced at 1.5 ms after the beginning of the release. (c) Quick stretch experiment. For comparison with tension, length is scaled to 1.0 in the isometric state and 2.0 after the stretch. (d) Stretch-release experiment. A release was induced at 1.5 ms after the beginning of the stretch.
The tension and the motor position, together with other signals such as the frame timing of the x-ray detector, were recorded at 20-kHz sampling with a data acquisition system based on LabView (National Instruments, Austin, TX).
X-ray diffraction experiments
X-ray setup
The experiments were made using the SPring-8 synchrotron radiation facility (Harima, Hyogo, Japan) with a ring energy of 8 GeV and a stored current of 70–100 mA. The x-ray source of the beamline (BL40XU, high flux beamline; see Inoue et al. (12)) is a helical undulator with 132 magnetic poles and a 32-mm periodicity (15). The optics consists of two mirrors: the first mirror, coated with rhodium (Rh), reflects x rays in the horizontal direction with a glancing angle of 3 mrad, whereas the second mirror, coated with nickel (Ni), reflects x rays in the vertical direction with a glancing angle of 4 mrad. Slits upstream to the mirrors limited the beam aperture to 5 μrad vertically and 15 μrad horizontally. Since the helical undulator produces only weak harmonics in the center of radiation, they can be eliminated by reflection by the two mirrors. When the gap of the undulator is adjusted to give 15.0 keV fundamental radiation, which was used in the present study, the contaminating higher harmonics are <0.01% of the fundamental. The energy spread of the x rays is determined by the radiation spectrum of the undulator. It has a tail toward the low energy with a full-width at a half-maximum of ∼3% when the fundamental radiation is 15.0 keV. The x-ray flux was ∼7 × 10¹⁴ photons per s. The beam size at the specimen was ∼0.35 mm horizontally and 0.15 mm vertically. Two guard slits were placed just upstream to the specimen to remove scatter in the small-angle region. The specimen/detector distance was 2.8 m. Most of the beam path was evacuated.
X-ray detector
The x-ray detector was an x-ray image intensifier coupled by a relay lens to a fast charge-coupled device (CCD) camera, which has been described in detail (14). The image intensifier (V5445P, Hamamatsu Photonics, Hamamatsu, Japan; see Amemiya et al. (16)) has a fast-decay phosphor (P46) in the exit window to reduce persistence. At 0.5-ms time resolution, the persistence in the image intensifier was negligible (<2%). The CCD camera (C7770, Hamamatsu Photonics) has three CCDs, which work alternately. By shifting the exposure-readout cycle of the CCDs, a frame rate of 290 per s (3.4 ms per frame) is achieved with 640 × 480 pixels. By reducing the number of pixels in the vertical direction in the CCD, a higher frame rate can be used. For example, with 640 × 72 pixels the frame rate is 1890 per s (0.53 ms per frame). Since intensity profiles along the meridian were measured in the present study and a muscle was set vertically, the camera was rotated by 90° to have more pixels along the meridian.
Experimental protocols
Due to the very high flux of the beamline, when the same part of a muscle was kept irradiated, damage was recognizable after an exposure of 5 ms at 15 keV. To reduce the radiation damage, special care was taken. The specimen chamber was placed on a vertically moving stage (13,17). The chamber was moved downward at a speed of 100 mm/s. Before the windows of the chamber crossed the x-ray beam, electrical stimulation was begun. When the windows (5 mm in height) began to cross the beam, the x-ray diffraction recording was started. Then, the motor was activated to change the muscle length. The recording finished when the windows left the beam. For the length change to always start at the beginning of a certain frame, the whole experimental sequence was based on the framing of the detector. For each specimen, the experiment was repeated several times with a horizontal shift of 0.5 mm. This ensured that the same part of the specimen was never exposed twice to x rays. Using this protocol, no damage was apparent by an inspection under an optical microscope after the experiment. When the experiment was made for the second time on the same part of the muscle, the diffraction pattern looked the same as in the first experiment but a small portion of fibers was sometimes found to be torn under a microscope.
In the present experiment, two protocols were used to cover reflections in the whole area of a diffraction pattern at high time-resolution (14):
Protocol A. The number of pixels in the vertical direction of the CCD was set to 72 to achieve a time resolution of 0.53 ms. Since only part of the diffraction pattern can be recorded, the experiment was repeated by shifting the detector. The meridional region (0–0.03 nm−1 in the equatorial direction, both sides of the meridian), the off-meridional region (0–0.46 nm−1, one side only), and the layer-line region (0.026–0.063 nm−1, one side only) were recorded in separate experiments.
Protocol B. A disk was put on the x-ray beam upstream of the guard slits which rotated in synchrony with the frame timing of the CCD detector. There were apertures in the disk to pass x rays. Thus, x rays passed the disk only during a limited period within each frame. The camera was used with a full frame (3.4 ms per frame) and an aperture was chosen to give 0.68-ms exposure in each frame. The timing of the exposure within the frame was adjusted by delaying the motor movement relative to the frame timing. This protocol resulted in relatively low dose to the specimen so the experiment was repeated five times without a shift and the specimen was moved sideways as in Protocol A.
Although results with Protocol B are reported only for the quick release experiment in this report, other experiments were also performed with Protocol B. All results were consistent with those obtained with Protocol A, which are reported here. Fig. 2 is a diffraction pattern in the isometric state recorded with Protocol B. The layer lines measured in the present experiments are indicated.
FIGURE 2.
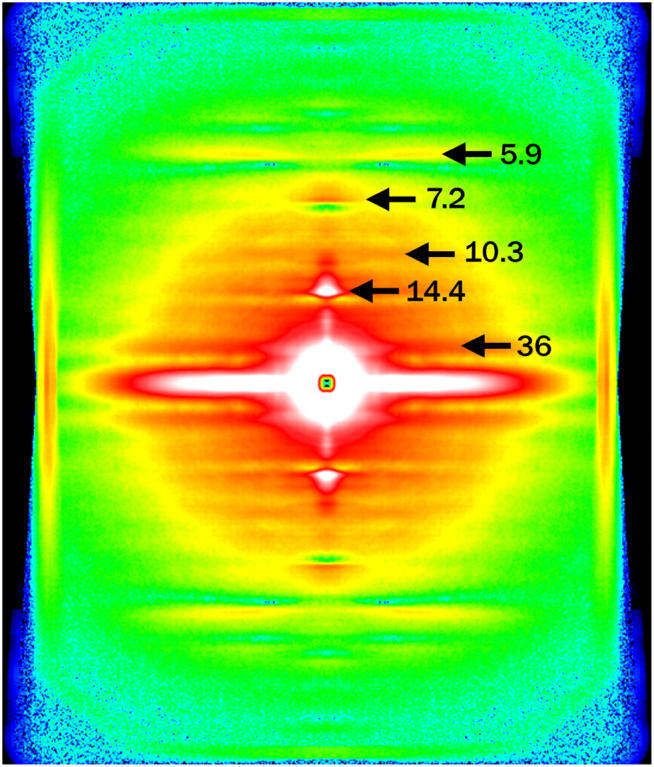
An x-ray diffraction pattern from an isometrically contracting frog skeletal muscle, obtained with Protocol B (see Methods). The muscle axis is vertical. Background subtraction based on the “roving” method of Dr. Paul Langan (adopted from software LSQINT, available through Collaborative Computational Project 13, http://www.ccp13.ac.uk/) was applied. The color scheme is white-red-yellow-green-blue-black, from strong to weak intensity. The pattern is a sum of 0.68-ms frames from 46 contractions of nine muscles.
Data analysis
X-ray diffraction images for each specimen were summed frame by frame after correcting for orientation of the muscle using the two third-order myosin meridional reflections at 1/14.5 nm−1 as markers of the meridional axis. When this reflection was not in the diffraction pattern, for example when the layer lines were measured with Protocol A, the strong equatorial scatter was used as a marker. The images obtained from each muscle were added, symmetric regions were summed, and the integrated intensity was measured as described below. Then, an isometric intensity level was obtained by averaging intensity in three frames before a length change. The intensity after the length change was normalized to this isometric level. Then, results from different muscles were averaged. To draw a background and obtain integrated intensity of a reflection, an intensity distribution along the meridian was obtained by summing intensity in the equatorial direction. The integration range was as follows: 0–0.014 nm−1 in the equatorial direction for the meridional reflections, 0.022–0.038 nm−1 for the (1,0) sampling of the third myosin layer line at 1/14.5 nm−1 and the layer line at 1/10.3 nm−1; and 0.048–0.063 nm−1 for the actin layer lines at 1/36 nm−1 and 1/5.9 nm−1. For an intensity measurement, a linear background was drawn by connecting two background points on the two sides of the reflection (Fig. 3). The integration above the background was used as integrated intensity of the reflection. Fitting nonlinear background, including polynomials up to the fourth order, was also tried. However, as the background is mostly monotonic and steep (see Fig. 3), the results were similar to those reported here.
FIGURE 3.

Background subtraction employed in this study. Red lines are during isometric contraction and blue ones at 1.1–1.6 ms after the beginning of a release. (a) Layer-line region at 0.048–0.063 nm−1 laterally. Summation of data from 23 contractions of one muscle. The two curves are identical but the upper curve is scaled up by threefold. The ordinate (in number of photons) corresponds to the lower curve. In the lower curve, the down-arrow is the 36-nm actin layer line and the arrowhead the 14.5-nm myosin layer line. In the upper curve, the arrowhead indicates the 5.9-nm actin layer line to which a linear background is drawn. (b) Region of the 10.3-nm layer line in the off-meridional region (0.032–0.054 nm−1 laterally). Summation of data from 19 contractions. A linear background is drawn. (c) Meridional intensity distributions (0–0.014 nm−1 laterally). Summation of data from 22 contractions. The upper curve is scaled up by 10-fold relative to the lower curve. The ordinate corresponds to the lower curve. The largest peak in the lower curve is the third-order myosin meridional reflection at 1/14.5 nm−1, whereas that in the upper curve is the sixth-order reflection at 1/7.2 nm−1.
Spacings of x-ray reflections were difficult to measure because the x-ray energy had a 3% spread. For a sharp peak, the position of the peak should give the correct spacing. However, this would give a spatial resolution of only one pixel. The precision of the measurement would be far better if the center of gravity of the reflection peak was used, but its drawback is that the center of gravity is affected when there is an overlapping reflection that changes intensity. This might happen even when the intensity of the overlapping reflection is much smaller than that of the reflection whose spacing is being measured. Thus, another approach was used in the current analysis (13). Five data points (nine points for a broad peak such as the 36-nm layer line) at the peak of the intensity (0.0018 nm−1 within the peak when five points were used) were chosen and the center of gravity was calculated. This method has less precision than using the whole peak but was much less liable to be affected by intensity changes of other reflections. The spacing was calibrated as the third meridional reflection from the thick filament at 1/14.5 nm−1.
Model calculation
A model of a thin filament decorated with myosin heads was constructed by using the model of actomyosin in rigor (18) (accession code 1ALM in Protein Data Bank). Actin molecules were helically arranged in 13:6 symmetry to obtain a model of the thin filament. Neither tropomyosin nor troponin was included. An actin filament with 366 actin monomers (length 999 nm) was constructed of which 722 nm was labeled with myosin heads representing the cross-bridge region of the thick filament (Fig. 7). Occupancy of actin by the heads in the overlap region was set to 0.56 × 0.3. The former number (0.56) is the ratio of myosin heads per actin monomer in the cross-bridge region of the thick filament. The latter (0.3) is based on an estimate of fraction of heads attached to actin in isometric contraction (19,20). Actin molecules were randomly labeled with myosin heads with a modulation function p(z) = A × exp(−(z/σ)2) where z was an axial distance (in nm) of the actin monomer from the regular 14.5-nm repeat, A was a normalization factor that was used to adjust the average occupancy to the desired value (0.56 × 0.3), and σ was set to 1.8 nm. This produces a variation in probability of myosin occupancy along the thin filament with a periodicity of 14.5 nm. This is a simplified model of actin labeling in muscle. In the actual filament lattice, because of the non-commensurate periodicities in the thick and thin filaments and the superlattice of the thick filaments in frog muscle (21), the occupancy function of each thin filament is much more complicated.
FIGURE 7.
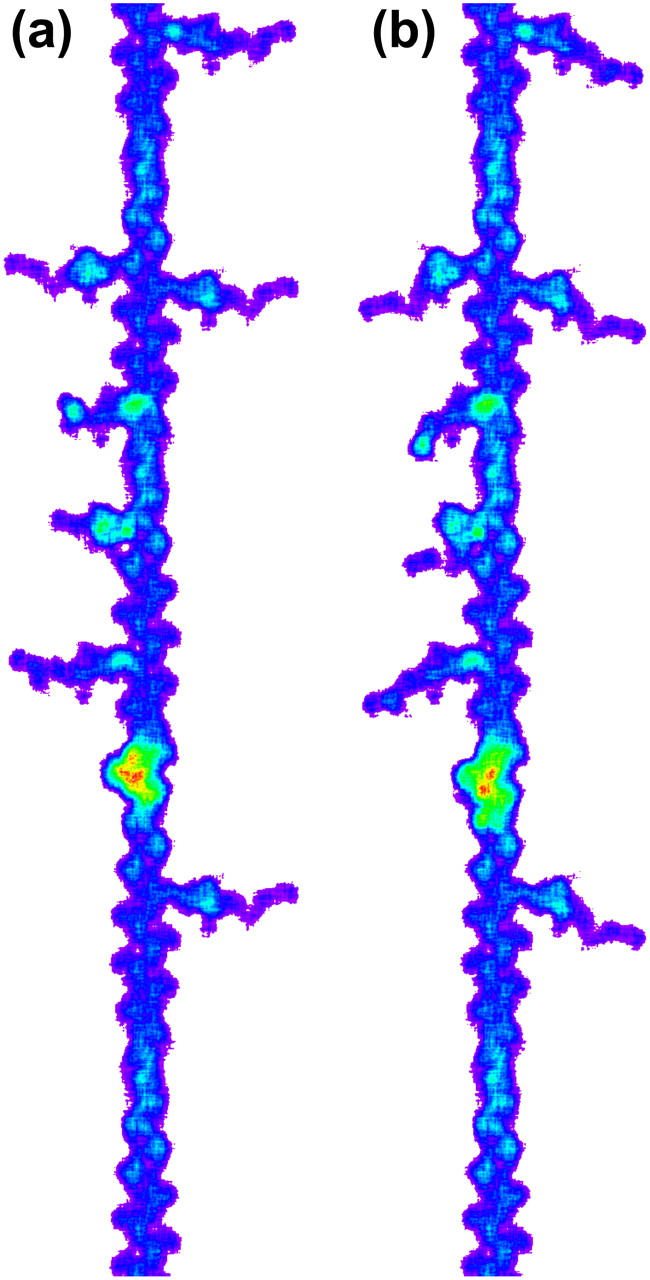
Models of the thin filament with myosin heads in contracting muscle, showing different conformations of the tail portion of myosin heads attached to the thin filament. The images were obtained from the 0.2-nm matrix used to calculate the diffraction patterns shown in Fig. 9. Only a short stretch of the filament is shown. (a) The isometric conformation. The lever-arm is swung 30° from the rigor conformation (18). Bottom is the direction of the Z-line. (b) The rigor conformation assuming no detachment. These were created by using the same seed in the random number generator, and thus the same actin monomers are decorated.
The lever-arm of a myosin head, which is assumed to consist of the 707–843 residues of the myosin heavy chain and the two light chains, was treated as a rigid structure around a vector connecting Cys707 and Pro830. The head in the original rigor conformation was used as a post-power-stroke structure. In the pre-stroke structure, the vector connecting Cys707 and Pro830 was tilted by 30° toward the M-line together with all atoms in the lever arm. An atomic model with Cα positions was made and projected down to a matrix of 40-nm laterally and 1000-nm axially, with a 0.2-nm step. Each amino acid residue was represented as a point with an equal mass at its Cα position. The matrix was Fourier-transformed to obtain a diffraction pattern. The resolution of transform was 0.000125 nm−1 axially, 0.005 nm−1 laterally. One-hundred filaments were generated and the intensity in four quadrants was averaged. Since this modeling assumes a statistical binding of myosin heads to actin, there is a strong continuous scatter in the small angle region. To obtain intensity distribution along layer lines, background was subtracted by linearly connecting the intensity on the two axial sides of each layer line. This was necessary to simulate the results of experimental data analysis. For the 36-nm layer line, the background amounted to ∼10% of the peak intensity of the layer line. The width of the axial integration was set rather large (0.035–0.065 nm−1) to match the axial integration in the data analysis. Thus, for instance, the 7.2-nm layer line includes not only the myosin layer line but also contribution from the actin 7.0-nm layer line.
RESULTS
Quick release experiments
When a muscle was released by ∼1% within 1 ms during isometric tetanus, tension dropped to 30% of the isometric level (Fig. 1 a). It then recovered gradually over tens of milliseconds. Intensity changes of seven reflections and a change in the Bragg spacing of the 14.5-nm meridional reflection are shown in Fig. 4 (open circles) and summarized in Table 1. The intensity of the 14.5-nm meridional reflection (Fig. 4 a) did not change significantly for 0.5 ms after the beginning of the release. Then, it went down to ∼30% in 1 ms, recovered halfway toward the resting level in 10 ms, and then the recovery slowed down. The lateral width of the reflection, which was 0.01 nm−1 (full-width at a half-maximum) in the isometric state, increased by 5%. The lateral width is probably an overestimate because it is affected by misalignment in the superposition of diffraction patterns (see Methods).
FIGURE 4.
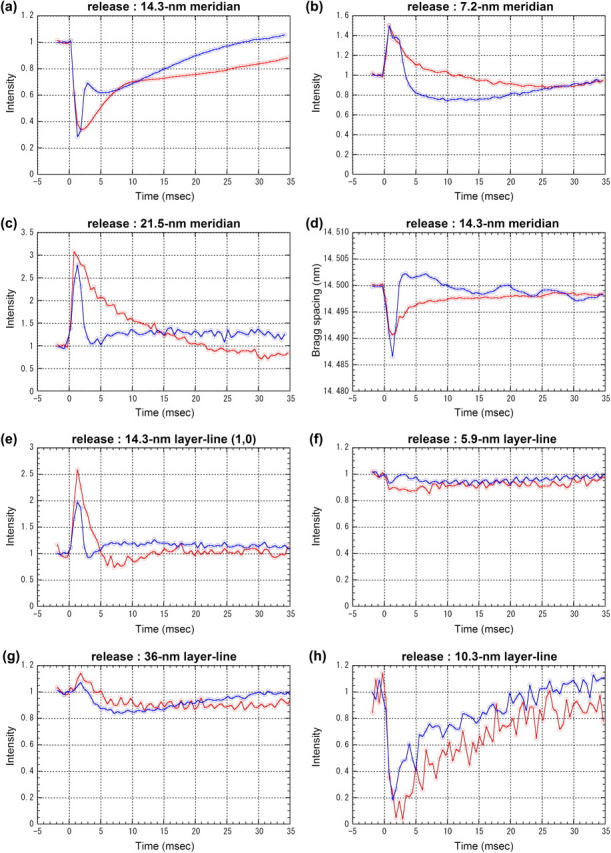
Changes in integrated intensity and Bragg spacing in release and release-stretch experiments obtained using Protocol A. Time resolution was 0.53 ms. Red lines are from release experiments and blue lines from release-stretch experiments, both of which are normalized by the average intensity before the release. (a) Intensity of the meridional reflection at 1/14.5 nm−1. The data for release are averages over 10 muscles, each of which contracted 12–22 times. The average intensity before the release was 1.3 × 10⁶ photons for each muscle. The data for release-stretch were averages over seven muscles, each of which contracted 8–11 times. The average intensity before the release was 7.3 × 10⁵ photons. (b) Intensity of the meridional reflection at 1/7.2 nm−1. From the same experiments as a. The average intensity before the release was 4.2 × 10⁴ and 3.0 × 10⁴ photons in the release and release-stretch experiment, respectively. (c) Intensity of the meridional reflection at 1/21.5 nm−1. From the same experiments as a. The average intensity before the release was 2.1 × 10⁴ and 6.2 × 10³ photons in the release and release-stretch experiment, respectively. (d) Axial Bragg spacing of the meridional reflection at 1/14.5 nm−1. From the same experiments as a. (e) Intensity of the (1,0) sampling of the 14.5-nm layer line. The data for release were averages over six muscles, each of which contracted 18–21 times. The average intensity before the release was 2.0 × 10⁴ photons. The data for release-stretch were averages over seven muscles, each of which contracted 9–14 times. The average intensity before the release was 4.0 × 10⁴ photons. (f) Intensity changes of the 5.9-nm layer line. The data for release were averages over six muscles, each of which contracted 14–23 times. The average intensity before the release was 3.6 × 10⁴ photons. The data for release-stretch were averages over six muscles, each of which contracted 24–32 times. The average intensity before the release was 5.8 × 10⁴ photons. (g) Intensity of the 36-nm actin layer line. From the same experiments as f. The average intensity before the release was 1.2 × 10⁵ and 1.5 × 10⁵ photons in the release and release-stretch experiments, respectively. (h) Intensity changes of the 10.3-nm layer line. From the same experiments as e. The average intensity before the release was 8.3 × 10³ and 1.4 × 10⁴ photons in the release and release-stretch experiments, respectively.
TABLE 1.
Responses to a release (quick release experiment)
| Delay (ms) | Time to a maximum change (ms) | Half-recovery time (ms) | Effect of stretch after the release | |
|---|---|---|---|---|
| 14.5-nm meridional reflection intensity | 0.5 | 1.9 | 8.5 | + |
| 14.5-nm meridional reflection spacing | 0 | 1.6 | 4.5 | ++ |
| 7.2-nm meridional reflection intensity | 0 | 0.8 | 2.9 | ++ |
| (1,0) sampling of 14.5-nm layer-line intensity | 0 | 1.3 | 2.6 | ++ |
| 21.5-nm meridional reflection intensity | 0 | 0.8 | 5.6 | ++ |
| 5.9-nm layer-line intensity | 0 | 0.8 | N.A. | ++ |
| 36-nm layer-line intensity | 1.0 | 1.9 | N.A. | + |
| 10.3-nm layer-line intensity | 0–0.5 | ∼2.4 | ∼8 | + |
| Tension | 0 | 1.0 | 22 | ++ |
Summary of changes in the intensity of seven reflections on axial spacing and tension. The symbols + and ++ in the last column indicate a small and large reversal, respectively, of the change caused by the initial release. The term N.A. indicates that the timecourse cannot be described as a simple asymptotic change.
On the other hand, the intensity of the sixth-order meridional reflection from the thick filament, at 1/7.2 nm−1, increased on a quick release (Fig. 4 b). The intensity increase was as quick as the drop of tension, reaching a peak at ∼1 ms, and then gradually decreased with a half time of 3.5 ms. The intensity went lower than the isometric level before finally settling to the isometric level. The second-order meridional reflection from the thick filament, at ∼1/21.5 nm−1, also increased in intensity on a release (Fig. 4 c; see also Huxley et al. (4). The increase was fast without a delay, reaching a peak of 300% at 1 ms, which corresponds to ∼3% of the isometric intensity of the 14.5-nm meridian, and then the intensity decreased to the isometric level with a half-time of ∼5 ms.
The axial Bragg spacing of the 14.5-nm meridional reflection decreased slightly after a quick release (Fig. 4 d). A marked delay was not observed. This is consistent with the result of Piazzesi et al. (9). It recovered with a half-time of <5 ms and did not reach the isometric level during the span of the observation (35 ms). The size of the peak change was 0.07%.
The (1,0) sampling spot on the 14.5-nm myosin layer line increased in intensity (Fig. 4 e), reaching a peak at ∼1 ms, and decreased quickly to the isometric level at 5 ms. An undershoot of ∼20% followed.
The intensity of the 5.9-nm actin layer line decreased by ∼14% after a quick release (Fig. 4 f). The intensity change was slow, taking ∼5 ms to reach the minimum, and recovered slowly. The intensity of the first layer line from the thin filament at 1/36 nm−1 increased by 10–15% in 2 ms after the beginning of a quick release with a delay of ∼1 ms (Fig. 4 g), and then decreased below the isometric level. The recovery toward the isometric level was incomplete within 35 ms. The intensity of this layer line included contribution from two neighboring layer lines, the 43-nm myosin layer line and the 36-nm actin layer line, which are unresolved because both layer lines are axially broad. During isometric contraction, the major contribution was from the actin layer line and thus the peak position was ∼1/38 nm−1. When the intensity increased after a release, the peak shifted by ∼1% toward higher angles. Thus, the intensity increase does not seem to be due to that of the myosin layer line.
The layer line at 1/10.3 nm−1 in the axial direction arises from periodic binding of myosin heads to actin (11). This is the first experiment in which the intensity change of this layer line was measured at high time-resolution. In the isometric state, the integrated intensity of this layer line was ∼3% of that of the 14.5-nm meridional reflection. The intensity of this layer line decreased to <20% of its isometric intensity after a quick release (Fig. 4 h), possibly with a slight lag. It then almost fully recovered to the isometric level during the course of the observation.
Full-frame time-resolved diffraction patterns were recorded with Protocol B (see Methods) and the difference from the pattern in the isometric state is shown in Fig. 5. Small intensity changes were still taking place before the release (between −0.68 and 0 ms). Such gradual changes are usually observed during isometric contraction (4,22). On a quick release of muscle, the scattering in the small-angle region to 1/7 nm−1 increased isotropically. Intensity changes of the layer lines are in general similar to those observed with Protocol A. It can be seen that the (1,0) sampling spot of the 14.5-nm myosin layer line increased after a quick release. The (1,1) sampling spot behaved similarly, but the intensity further along the layer line, at the (2,1) spot, decreased. The intensity of the fourth (at 1/10.8 nm−1) and ninth (at 1/4.8 nm−1) meridional reflections from the thick filament increased after a quick release. These results on the sampling spots on the 14.5-nm layer line and the meridional reflections were also confirmed in experiments using Protocol A, but the lower intensity of these reflections made it difficult to obtain a precise timecourse of the intensity changes. The intensity decrease in the layer lines at 1/10.3 and 1/5.9 nm−1 was clearly observed. There is no other layer line that might influence the intensity measurement of these layer lines. On the other hand, the region at the 36-nm actin layer line is more complicated. However, the reversal of the intensity change from increase to decrease is clearly seen between 2 and 4 ms.
FIGURE 5.
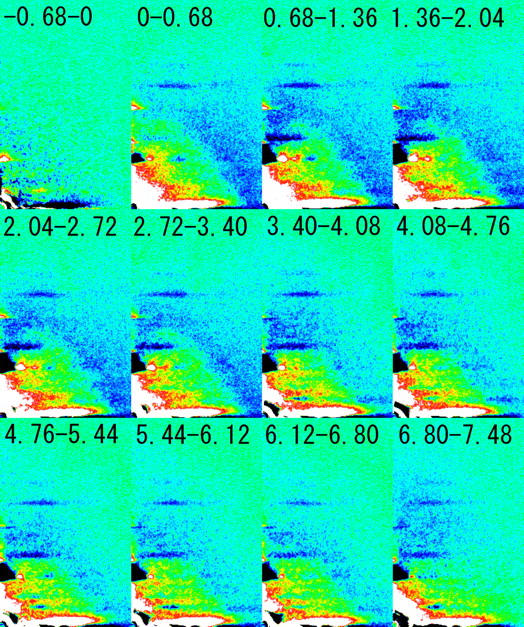
Difference diffraction patterns obtained with Protocol B in a release experiment. Each image is a four-quadrant average of patterns obtained from nine muscles, each of which was contracted 15–30 times. From each frame, a frame before the release that was recorded with the same CCD in the 3-CCD camera was subtracted. White-red-yellow regions increased in intensity whereas blue-black ones decreased. The numbers indicate the period after the beginning of a release in milliseconds. The label −0. 68–0 means a 0.68-ms period before the release. The large intensity change along the equator is due to saturation of the detector and thus not a true intensity change.
Quick release-stretch experiments
When the muscle was released and quickly restretched to its original length after the completion of the release (the length control started to reverse at 1.4 ms and was completed at 2.5 ms), tension began to increase at 1.6 ms and overshot to a peak at 2.4 ms (Fig. 1 b). The size of the overshoot was ∼20%, with some oscillation which probably originated in the force transducer. The tension showed an undershoot after the completion of the restretch. The overshoot took place when the restretch was still incomplete.
Intensity changes of seven reflections and a change in the Bragg spacing of the 14.5-nm meridional reflection are shown in Fig. 4 (blue circles) and summarized in Table 1 with + and ++ marks to classify the size of the effect of restretch. The intensity of the 14.5-nm meridional reflection recovered quickly to ∼70% of its isometric intensity by the restretch (Fig. 4 a). It peaked like the tension and recovered to the isometric level after a brief undershoot. The recovery is less complete than reported by Huxley et al. (4), who observed >90% recovery. They also observed an overshoot. The intensity of the 7.2-nm meridional reflection, which increased by the release, showed a decrease at 2.6–3.1 ms (Fig. 4 b); that is, ∼1 ms after the beginning of the restretch. Thus, there is no phase that corresponds to the quick recovery seen with the 14.5-nm reflection, showing that the intensity of this reflection is not affected much by the restretch for the first 1-ms. The intensity showed a marked undershoot before returning to the isometric level.
The 21.5-nm meridional reflection was affected strongly by the restretch (Fig. 4 c). Its intensity began to decrease during the restretch and returned close to the isometric level when the restretch was complete. It showed a small increase afterwards. The intensity between 0.5 and 1.5 ms after the beginning of the release recorded in this release-stretch experiment was lower than that in the release experiment (compare the red and blue lines in Fig. 4 c). This should be regarded as a limit of reproducibility of the data in the present study. The release and release-stretch experiments were made on different batches of frogs.
The axial Bragg spacing of the 14.5-nm meridional reflection recovered to the original level after a restretch just like the tension but with only a small overshoot (Fig. 4 d). It showed a small oscillation afterwards. The origin of this oscillation is not clear.
The intensity of the (1,0) sampling spot on the 14.5-nm myosin layer line was quite sensitive to the restretch (Fig. 4 e). It quickly returned to the isometric level at the same time as the tension returned, reaching the isometric level when the release was complete. Like the 21.5-nm meridional reflection, the intensity between 0.5 and 1.5 ms after the beginning of the release recorded in this experiment was lower than that in the release experiment.
The intensity of the 5.9-nm actin layer line returned to the isometric level with tension (Fig. 4 f). It was already close to the isometric level when the restretch was complete and showed a decrease afterwards. The intensity of the layer line from the thin filament at 1/36 nm−1 decreased on a restretch of the muscle (Fig. 4 g). It continued to decrease before starting to return to the isometric level at ∼8 ms.
The intensity of the 10.3-nm layer line showed a quick increase upon the restretch (Fig. 4 h). It had recovered to ∼50% of the isometric level when the restretch was complete, and then returned more slowly to the isometric level.
Quick stretch experiments
When a muscle was stretched by ∼0.6% within 1 ms during isometric tetanus, tension increased by ∼90% of the isometric tension (Fig. 1 c). It then declined toward the isometric level but was still higher than the isometric tension at the stretched sarcomere length even at the end of the 0.8-s tetanus (residual tension).
Intensity and spacing changes are shown in Fig. 6 (red circles) and summarized in Table 2. The intensity of the 14.5-nm meridional reflection started to drop without delay and decreased to ∼42% of the isometric intensity (23) (Fig. 6 a). Then, it gradually returned toward the isometric intensity level. The recovery was slower than that of tension, and at 35 ms after the stretch the intensity was still ∼30% lower than the isometric level before the stretch. The lateral width of the reflection did not change significantly upon a stretch but decreased by ∼2% in 8 ms and the recovered over 15 ms.
FIGURE 6.
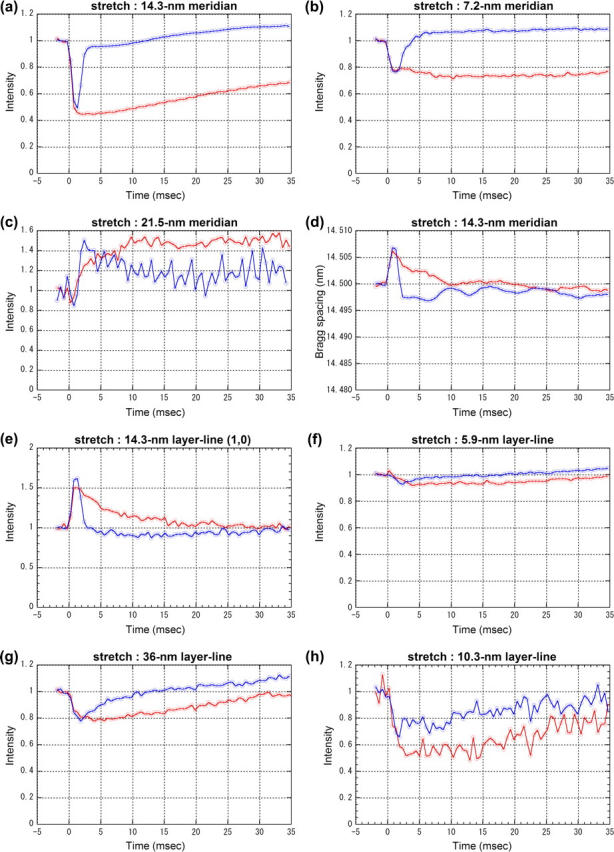
Changes in integrated intensity and Bragg spacing in stretch and stretch-release experiments obtained using Protocol A. Time resolution was 0.53 ms. Red lines are from stretch experiments and blue lines from stretch-release experiments, both of which are normalized by the average intensity before the stretch. (a) Intensity of the meridional reflection at 1/14.5 nm−1. The data for stretch were averages over six muscles, each of which contracted 5–10 times. The average intensity before the stretch was 6.5 × 10⁵ photons. The data for stretch-release were averages over eight muscles, each of which contracted 10–15 times. The average intensity before the stretch was 9.4 × 10⁵ photons. (b) Intensity of the meridional reflection at 1/7.2 nm−1. From the same experiments as a. The average intensity before the stretch was 3.1 × 10⁴ and 4.4 × 10⁴ photons in the stretch and stretch-release experiment, respectively. (c) Intensity of the meridional reflection at 1/21.5 nm−1. From the same experiments as a. The average intensity before the stretch was 1.1 × 10⁴ and 7.2 × 10³ photons in the stretch and stretch-release experiment, respectively. (d) Axial Bragg spacing of the meridional reflection at 1/14.5 nm−1. From the same experiments as a. (e) Intensity of the (1,0) sampling of the 14.5-nm layer line. The data for stretch were averages over six muscles, each of which contracted 9–14 times. The average intensity before the stretch was 5.0 × 10⁴ photons. The data for stretch-release were averages over seven muscles, each of which contracted 9–14 times. The average intensity before the stretch was 5.8 × 10⁴ photons. (f) Intensity changes of the 5.9-nm layer line. The data for stretch were averages over 11 muscles, each of which contracted 14–32 times. The average intensity before the stretch was 1.5 × 10⁴ photons. The data for stretch-release were averages over six muscles, each of which contracted 11–13 times. The average intensity before the stretch was 7.5 × 10⁴ photons. (g) Intensity of the 36-nm actin layer line. From the same experiments as f. The average intensity before the stretch was 8.2 × 10⁴ and 2.2 × 10⁵ photons in the stretch and stretch-release experiments, respectively. (h) Intensity changes of the 10.3-nm layer line. From the same experiments as e. The average intensity before the stretch was 1.6 × 10⁴ and 2.1 × 10⁴ photons in the stretch and stretch-release experiments, respectively.
TABLE 2.
Responses to a stretch (quick stretch experiment)
| Delay (ms) | Time to a maximum change (ms) | Half-recovery time (ms) | Effect of release after the stretch | |
|---|---|---|---|---|
| 14.5-nm meridional reflection intensity | 0 | 1.3 | N.A. | ++ |
| 14.5-nm meridional reflection spacing | 0 | 0.8 | ∼4 | ++ |
| 7.2-nm meridional reflection intensity | 0 | 0.8 | N.A. | ++ |
| (1,0) sampling of 14.5-nm layer-line intensity | 0 | 0.8 | 5.0 | ++ |
| 21.5-nm meridional reflection intensity | 1.0 | ∼10 | N.A. | + |
| 5.9-nm layer-line intensity | 1.0 | ∼4 | ∼25 | + |
| 36-nm layer-line intensity | 0 | 1.9 | ∼22 | + |
| 10.3-nm layer-line intensity | 0.5 | 2.9 | ∼32 | + |
| Tension | 0 | 0.75 | 5.5 | ++ |
Summary of changes in the intensity of seven reflections on axial spacing and tension. The symbols + and ++ in the last column indicate a small and large reversal, respectively, of the change caused by the initial stretch. The term N.A. indicates that the timecourse cannot be described as a simple asymptotic change.
The intensity of the 7.2-nm meridional reflection also decreased without a delay upon a quick stretch (Fig. 6 b). Its recovery was even slower than that of the 14.5-nm meridian, the intensity staying at the low level for 35 ms. The intensity of the 21.5-nm meridional reflection increased on a quick stretch with a delay of ∼1 ms (Fig. 6 c). The increase continued for 20 ms and reached 45% higher than the isometric intensity. Like the 7.2-nm meridional reflection, its intensity did not begin to return toward the isometric level at 35 ms.
The axial Bragg spacing of the 14.5-nm meridional reflection increased by 0.04% with a quick stretch (Fig. 6 d) without delay. It returned to the isometric spacing with a half-time of <5 ms, far faster than the decline of tension.
The (1,0) sampling spot on the 14.5-nm myosin layer line increased in intensity by a stretch (Fig. 6 e), and decreased to the isometric level with a half-time of ∼5 ms afterwards. When recorded with Protocol B, the (1,1) spot also showed an increase (data not shown).
The response of the intensity of the 5.9-nm actin layer line to a quick stretch was slow (Fig. 6 f). The first data point after the stretch may show a small increase, but this does not seem significant statistically (no increase was observed in the stretch-release experiment as shown below). Then, it decreased for ∼4 ms and recovered to the isometric intensity. The recovery was almost complete in 35 ms. The intensity of the 36-nm actin layer line decreased on a stretch (Fig. 5 g). It took ∼2 ms to reach the minimum, which was ∼20% lower than the isometric level, and then recovered gradually. The peak position shifted toward the lower angle by ∼1%.
The intensity of the 10.3-nm layer line decreased slowly, with a possible delay of 0.5 ms, to ∼50% of its isometric intensity taking ∼2 ms (Fig. 6 h). It then recovered to ∼80% of the isometric level during the course of the observation.
Quick stretch-release experiments
When the muscle was stretched and quickly released to its original length after the completion of the stretch (the stretch was completed at 1.0 ms and the release began at 1.4 ms and was completed at 2.3 ms), tension peaked at 0.8 ms and its decline was accelerated by the release (Fig. 1 d). The tension went below the isometric level and reached a minimum at 2.4 ms. Then, it returned to the isometric level asymptotically.
The intensity of the 14.5-nm meridional reflection recovered quickly to its isometric intensity by the release after a stretch (Fig. 6 a, blue circles; and see Lombard, et al. (23). The recovery was almost complete when the length returned to the original. The intensity increased slowly afterwards. The intensity of the 7.2-nm meridional reflection, which decreased by the stretch, also returned to the isometric level by the release (Fig. 6 b), slightly overshooting. The 21.5-nm meridional reflection increased in intensity with a delay of ∼1 ms when the muscle was stretched. When the muscle was released after the stretch, the intensity increased further (Fig. 6 c). After the release was completed, the intensity decreased but it did not return to the isometric level at 35 ms after the stretch.
The axial Bragg spacing of the 14.5-nm meridional reflection, which increased on a stretch, went below the isometric level after the release just like the tension (Fig. 6 d). It showed a small oscillation afterwards, as was the case in the release-stretch experiment.
The (1,0) sampling spot on the 14.5-nm layer line, which increased on stretch, was sensitive to the release (Fig. 6 e). It quickly returned to the isometric level when the length was restored.
The intensity of the 5.9-nm actin layer line was rather slow in response to a release after a stretch. It began to increase at ∼2.5 ms, when the tension had already returned to the isometric level (Fig. 6 f). Thus, the release does not have an immediate effect but seems to accelerate the intensity recovery. The intensity of the 36-nm actin layer line decreased on a stretch of the muscle and started to increase with a delay of ∼1 ms (Fig. 6 g) when the muscle length was returned to the original length. Thus, its recovery to the isometric level was clearly accelerated.
The intensity of the 10.3-nm layer line stopped decreasing when a quick release was applied after a stretch (Fig. 6 h). The intensity recovery was less obvious than in the case of stretch after release, but the difference in the intensity during the slow recovery phase shows that there was ∼20% recovery in intensity.
Model calculations
To simulate the structural changes in attached myosin heads expected during early tension recovery, a model of a thin filament with myosin heads was created (Fig. 7) and the diffraction pattern was calculated (see Methods for details). The myosin heads are assumed to be bound to actin, preserving their 14.5-nm axial repeat, on average. Their conformation was based on the crystal structure but the distal part of the head was rotated by 30° in the model before a release (i.e., the isometric state). This particular angle was chosen so that the changes in the mass distribution both along the filament and in the radial direction are maximal when the head tilts toward the rigor conformation upon a quick release. Since this model does not take into consideration the three-dimensional arrangement of myosin heads in the filament array or dispersion in lever arm angles of attached heads, it should be regarded as a simplified model. However, the model qualitatively accounts for most of the features in the diffraction pattern during isometric contraction (Fig. 8, red lines, and Fig. 9 a). The presence of the layer lines at 1/10.3 and 1/23 nm−1 is predicted. There are other layer lines as predicted by the theory (11) but they are too weak to be measured experimentally.
FIGURE 8.

Intensity distribution along major layer lines calculated with various models of myosin attachment to the thin filament. (a) 3.6-nm actin layer line, (b) 14.5-nm myosin layer line, (c) 10.3-nm actin-myosin layer line, (d) 7.2-nm myosin layer line, and (e) 5.9-nm actin layer line. The ordinate is in an arbitrary scale. The red line is for a model with a lever-arm tilted by 30° toward the M-line (the isometric model). The blue line is for a model with a lever arm in the rigor angle (the rigor model). The green line is for the rigor model with the number of attached heads reduced to 70% of the isometric state. The broken black line is for a model without myosin heads. The inner part of the 36-nm layer line has negative intensity due to the presence of a weak neighboring layer line.
FIGURE 9.

Comparison of observed diffraction patterns with the result of model calculation. (a) In the left half, an observed diffraction pattern in an isometric state (Fig. 2) is shown in two symmetric quadrants. The right half is a calculated diffraction pattern for isometric contraction, in which the lever-arm of the myosin head is tilted 30° toward the M-line (Fig. 7 a). The Bragg spacings of the layer lines are indicated. Since the filaments are arranged in a hexagonal array in a muscle, the meridional reflections and the 14.5-nm layer line are sampled by the lattice in an actual diffraction pattern shown in the left half. (b) The left half shows difference between the intensity at 1.4–2.0 ms after the beginning of a release and that before the release with the same exposure time. The color scheme is white-red-yellow-green-blue-black from increase to decrease upon a release. The right half shows differences between calculated intensity distributions with a 0° lever-arm position (Fig. 7 b) and a 30° lever-arm (Fig. 7 a), with the number of attached heads reduced by 30%.
As a tilt of myosin heads from isometric (30°) to rigor (0°) configuration causes a spread of mass of a myosin head projected onto the filament axis, the intensity of the 14.5-nm meridian decreases to 55% (Fig. 8 b). The tilt of myosin heads also reduces the radial spread of mass of myosin heads and the intensity distribution along the 14.5-nm layer line generally extends toward higher angles, causing both increase and decrease of intensity along the layer line (Fig. 8 b). This may explain a rapid intensity increase of the (1,0) and (1,1) sampling spots of this layer line upon a quick release and an intensity decrease at higher angles (Fig. 5). However, the current model does not predict a marked intensity increase at the position of the (1,0) sampling (0.28 nm−1). To induce a large intensity enhancement in this region, it is necessary to assume that the isometric conformation has larger mass at a larger radial distance than in the model. This may be realized by taking the second head and S2 portion of myosin into consideration.
A change in the radial mass distribution affects the intensity distribution not only along the 14.5-nm layer line but also on the equator (not shown in Fig. 8). However, it has been known that a quick length change does not affect the equatorial reflection intensity (4). It is plausible that the equatorial intensity is dominated by the mass distribution of backbones of the thick and thin filaments. Compared with the projected mass of the filament backbones, a radial redistribution in the mass of 30% of total myosin heads is relatively small. This is probably the reason a significant change is not observed on the equator.
The present model gives very low intensity for the 7.2-nm meridional reflection. This is because the probability function for binding of myosin heads to actin (see Methods) resembles a sinusoidal variation. By changing this function, higher intensity can be predicted for this reflection. However, whatever the probability function is, the 7.2-nm meridional intensity decreases in a manner similar to the 14.5-nm reflection (Fig. 8 d) contrary to the observation (Fig. 4 b). Thus, it is reasonable to assume that the intensity of this reflection is not dominated by diffraction from bound heads (24).
The intensity of other layer lines seems to depend largely on the conformation of the bound heads. The 36-nm and 5.9-nm actin layer lines show rather small changes in the intensity distribution from the isometric to the rigor configuration (Fig. 8, a and e). The decrease in the intensity of the 10.3-nm layer line, integrated over 0–0.05 nm−1, was ∼60% (Fig. 8 c).
When the number of attached heads in the rigor configuration is assumed to be 70% of that in the isometric state, the intensity of all layer lines decreased. The meridional intensity of the 14.5-nm layer line was ∼30% of the isometric intensity (Fig. 8 b), in good agreement with the observation (Fig. 4 a). The intensity of the 10.3-nm layer line integrated over 0–0.05 nm−1 was also ∼30% of the isometric intensity (Fig. 8 c), as in the observation (Fig. 4 h). These intensity changes are in accordance with the square-law of intensity (25), which predicts 49% intensity with 70% of attached heads. However, the intensity of actin layer lines does not follow this law, because of the interference between the structure factors of myosin heads and actin monomers. Generally, the experimentally observed intensity distribution along the layer lines has a peak farther away from the meridian than in the calculation (Fig. 9), suggesting that the actual radial mass distribution of myosin heads has higher density near the thin filament.
DISCUSSION
Structure of cross-bridges after a quick release of muscle
In mechanical experiments using a 0.2-ms step length change (26), it was shown that elastic elements in muscle either shorten or elongate upon quick sliding of filaments (phase 1). Then, myosin heads attached to actin quickly change conformation to recover force (early tension recovery, phase 2), which takes 2–5 ms at 0–3°C. Since the release employed in the present experiment took 1 ms, phase 2 does not take place in all heads synchronously. Instead, according to the difference in their original attached conformation, heads gradually undergo this process. Thus, except in the first 1–2 ms after the completion of the release, the tension recovery seen in Fig. 1 a is mostly due to the phase 4, which is a tension recovery much slower than phase 2. Another structural process taking place after a release is detachment and reattachment of heads. Lombardi et al. (27) showed that, in a frog muscle fiber at 4°C, substantial detachment or reattachment does no take place within 2 ms after a quick release of 5 nm per half-sarcomere. Thus, by restoring the muscle length, it is expected that the conformation of myosin heads can be reversed to the original isometric state. This has indeed been observed in x-ray diffraction experiments (4). Irving et al. (8) estimated from a mechanical experiment that 8% of the heads have detached (and not reattached) at 1 ms after a shortening step of 5 nm per half sarcomere, leading to 16% deficit in the intensity of the 14.5-nm meridional reflection. This calculation was based on the assumption that the intensity is proportional to the square of the number of scattering molecules (the square-law; see Haselgrove et al. (25). In the present results, the intensity of the 14.5-nm reflection recovered only to ∼70% (Fig. 4 a), suggesting 16% of bound heads have detached at 2.5 ms after the beginning of the release. This seems reasonable considering the larger (∼11 nm per half-sarcomere, ignoring series compliance) release used in the present study.
The structural change of the myosin heads during tension recovery and associated intensity changes in the x-ray diffraction diagram were calculated using an atomic model of myosin heads (Fig. 7). The results of the model calculation show (Figs. 8 and 9) that the intensity change of the 14.5-nm meridional reflection and the 10.3-nm layer line can, at least, be qualitatively explained by an axial conformational change in myosin heads that are attached to actin. The model calculation also shows that the axial tilt of the lever arm of myosin heads affects the intensity distribution along the 14.5-nm layer line (Fig. 8). Thus, the observed intensity changes along this layer line (Fig. 5) are good evidence for the conformational change of the attached heads.
The 10.3-nm layer line is supposed to be contributed only by attached heads. The intensity recovery of this layer line after a restretch of muscle was smaller compared with that of the 14.5-nm meridional reflection (Fig. 4 h). It recovered only to 50% (Fig. 4 h), suggesting 30% detachment. This discrepancy might be explained by different dependence of the intensities on the number of bound heads. Koubassova and Tsaturyan (28) and Tamura et al. (29) showed that a significant deviation from the square law may arise if the binding pattern of heads is not random. However, the model calculation (Fig. 8, b and c) shows that the intensity of both layer lines change more or less linearly to square of the number of attached heads. On the other hand, some features of intensity changes after a restretch resemble those seen after a stretch without a release (Fig. 6). For instance, the undershoot of intensity in the 14.5-nm and 7.2-nm meridional reflections and in the 5.9-nm actin layer line (Fig. 4, a, b, and f) resembles a decrease after a quick stretch (Fig. 6, a, b, and f). This suggests that some heads at 1.5 ms after a quick release are already in a state similar to that during isometric contraction, probably by reattachment, as also suggested by the overshoot in tension (Fig. 1 a). The fraction of reattached heads is unlikely to be larger than that of detached heads, which is estimated above to be 16–30% of the number of heads attached in the isometric state. Although these heads may also contribute to the diffraction pattern, their contribution was not included in the model calculation. To explain the details of the intensity recovery by the restretch, it is necessary to know more about these reattached heads.
Although some features in the intensity changes can be explained by the conformational change of attached myosin heads, the present study revealed that there are many features in the diffraction pattern that change in an unexpected manner. Such reflections are discussed below.
The intensities of many myosin reflections increased after a release. Those include the 7.2-nm, 21.5-nm, and other meridional reflections (Fig. 4, b and c, and Fig. 5) and the (1,0) and (1,1) sampling spots of the 14.5-nm layer line (Figs. 4 e and 5). The intensity of these reflections began to increase without a delay and started to return to the isometric level instantly when the release was completed. However, since the timecourses of the decay and the responses to the restretch are different among these layer lines, the intensity increases of these reflections seem to have different causes. Huxley et al. (4) assigned the intensity increase of the 21.5-nm reflection to detached heads that resume the helical positions around the thick filament. If this interpretation were correct, we would have to assume that detachment takes place very quickly upon a release. Moreover, since the intensity of the 21.5-nm meridional reflection quickly returns to the isometric level by a restretch (Fig. 4 c), the detached heads had to be sensitive to a stretch. Thus, it seems more reasonable to assume that the intensity increase of the 21.5-nm reflection is due to a conformational change of attached heads. However, the presence of this reflection is difficult to explain if we assume 14.5-nm modulation of binding. Since the 43-nm period is a helical repeat in the thick filament and 21.5 nm is its second order, a lattice model including the three-dimensional arrangement of both thick and thin filaments is required to explain the behavior of this reflection.
The 7.2-nm meridional reflection has been known to have little contribution from attached heads (4,24). Thus, its intensity increase on a release may not be entirely due to a conformational change of attached heads. When the muscle was stretched after a release, only the intensity of this reflection showed a delay in returning to the isometric intensity. A possible cause for this complicated behavior is interference between diffraction from myosin heads in the two halves of the thick filament (4,30). An experiment with a higher spatial resolution is required to fully clarify the complicated behavior of this reflection.
As for the actin layer lines, the 5.9-nm actin layer line decreases in intensity in 1 ms (Fig. 4 f). Although the peak intensity decrease was observed at ∼0.06 nm−1 in the lateral direction, the simulation assuming only a conformational change of myosin heads showed a small increase of intensity in this region (Fig. 8 e). Since contribution from bound heads is generally larger in a region closer to the meridian where intensity decrease is predicted, a structural change in an actin molecule may be important in the outer region of this layer line. The intensity of the 36-nm layer line increases with a delay of ∼1 ms and reaches a maximum at ∼2 ms before a slower decrease (Fig. 4 g). The delay suggests that the intensity decrease is due to detachment of heads from actin. As has been pointed out (31), the model calculation shows that the intensity of this layer line is relatively insensitive to conformation of bound heads (Fig. 8 a, red and blue curves). As the initial intensity increase upon a release is difficult to explain by detachment of attached heads either (Fig. 8 a, green curve), a structural change in actin may be playing a role.
Structure of cross-bridges after a quick stretch of muscle
The intensity of the 14.5-nm meridional reflection, as well as that of the 7.2-nm meridional reflection, decreases on a quick stretch without a lag (Fig. 6, a and b). These intensity changes can be reversed by quickly releasing the muscle. Irving and his colleagues (8,23) explained the intensity drop of the 14.5-nm meridional reflection upon a quick stretch in terms of the increased axial tilt of the regulatory domain of the myosin head. This also explains the intensity drop of the 7.2-nm meridional reflection, although attached heads may not contribute to this reflection much (4,24). Since the intensity recovery by a release was almost perfect, stretch does not seem to induce detachment up to 1.5 ms. The decline of tension after the initial peak may represent redistribution among different force-generating states of attached heads. However, other reflections cannot be interpreted as simply as these two reflections.
The intensity of the 21.5-nm meridional reflection increases with a delay of ∼1.5 ms (Fig. 6 c). This may suggest that the increase is due to detachment of myosin heads. When the muscle was released after a stretch, the increase in intensity was instantly accelerated and reached a peak at ∼3 ms and then declined. This increase seems similar to that seen in a quick release (Fig. 4 c). Thus, even after a stretch, some heads seem to behave as if they were not affected by it.
The intensities of the (1,0) sampling on the 14.5-nm layer line increased without a delay by a stretch (Fig. 6 e) and was reversed by a quick release. This can be explained by a conformational change of bound heads as discussed above for a release. Since their overall configuration in isometric contraction is close to perpendicular to the filament axis (Fig. 7 a), axial tilting of the lever arm affects the radial mass distribution in a similar manner whether it is toward the M-line or Z-line. When the heads tilt more, the mass is closer to the filament axis and the (1,0) sampling region is enhanced. This accounts for the observed enhancement of this reflection upon both release and stretch.
The intensity of the 5.9-nm actin layer line remains almost unchanged during a stretch, and then decreases slowly (Fig. 6 f). The intensity of the 36-nm actin layer line showed a quick decrease upon a stretch (Fig. 6 g). Since it takes place even during the stretch, it may be due to a conformational change of attached heads. The intensity of both layer lines does not reverse promptly on a release after stretch but recovered slowly afterwards. This slow recovery may be due to gradual changes in the myosin conformation through detachment and reattachment. The absence of quick response to the release suggests that the major part of the intensity changes of these layer lines is not due to a simple conformational change of attached heads, which is modeled in Fig. 7. The intensity of the 10.3-nm layer line decreases on a stretch and continues to decrease after the stretch finishes until ∼3 ms (Fig. 5 h). Since the number of attached heads does not change much after a quick stretch (8), the lower intensity, lasting over 20 ms, seems to be due to a different conformation of attached heads, which is kept much longer than after a release. When the muscle was released after a stretch, the intensity recovers, showing that the conformation of attached heads is reversed by a filament sliding to the opposite direction. In contrast to the 14.5-nm and 7.2-nm meridional reflections, the recovery was incomplete, only from 50–55% to 70–75%. If the square-law is valid as in the simulation, ∼85% of heads are estimated to be attached when the release was completed.
Since the tension remains high long after a stretch, it is plausible that there is some structural change remaining in the myofilaments. In the present results, meridional reflections are affected for a longer period than the layer lines. One possibility of the structural change would be a lower degree of axial alignment of the filaments, which affects the intensity of the meridional reflections more than that of layer lines (22). However, as the size of lateral broadening of meridional reflections upon a length change was found to be smaller than 5% in the present study, this is unlikely to be a major cause of the long-lasting effects of the quick length changes.
Concluding remarks
The present experiments revealed many unexpected features in x-ray intensity changes after a quick release and stretch in contracting frog skeletal muscle. Although an axial tilt of attached myosin heads has been successfully used to explain some of these features, results on many other reflections are not readily accounted for with a simple molecular model. It may be necessary to consider three-dimensional arrangement of filaments and a conformational change in actin molecules to explain these results. Another complication is contribution of the second head of those myosin molecules whose other head is attached to actin. The estimate of 30% attachment during isometric contraction suggests that the majority of heads are not stereospecifically bound to actin. However, the equatorial intensity distribution suggests that they are in the proximity of actin and may be weakly bound to actin (32). Squire and Harford (33) showed a possibility that weakly bound heads may contribute to the intensity of myosin layer lines. Thus, for interpretation of x-ray diffraction from a contracting muscle, it may not be sufficient to consider only the myosin heads that are stereospecifically bound to actin.
Acknowledgments
We thank Dr. T. Oka for software used for the data acquisition. The experiments were performed under approval of the SPring-8 Proposal Review Committee (No. 2000A0454-NL-np and No. 2002A0057-NL2-np).
This work was supported by the SPring-8 Joint Research Promotion Scheme of the Japan Science and Technology Corporation.
References
- 1.Elliott, G. F., J. Lowy, and B. M. Millman. 1967. Low-angle x-ray diffraction studies of living striated muscle during contraction. J. Mol. Biol. 25:31–45. [DOI] [PubMed] [Google Scholar]
- 2.Huxley, H. E., and W. Brown. 1967. The low-angle x-ray diagram of vertebrate striated muscle and its behavior during contraction and rigor. J. Mol. Biol. 30:383–434. [DOI] [PubMed] [Google Scholar]
- 3.Huxley, H. E., A. R. Faruqi, J. Bordas, M. H. J. Koch, and J. R. Milch. 1980. The use of synchrotron radiation in time-resolved x-ray diffraction studies of myosin layer-line reflections during muscle contraction. Nature. 284:140–143. [DOI] [PubMed] [Google Scholar]
- 4.Huxley, H. E., R. M. Simmons, A. R. Faruqi, M. Kress, J. Bordas, and M. H. J. Koch. 1983. Changes in the x-ray reflections from contracting muscle during rapid mechanical transients and their structural implications. J. Mol. Biol. 168:469–506. [DOI] [PubMed] [Google Scholar]
- 5.Irving, M., V. Lombardi, G. Piazzessi, and M. A. Ferenczi. 1992. Myosin head movements are synchronous with the elementary force-generating process in muscle. Nature. 357:156–158. [DOI] [PubMed] [Google Scholar]
- 6.Bordas, J., G. P. Diakun, F. G. Diaz, J. E. Harries, R. A. Lewis, J. Lowy, G. R. Mant, L. Martin-Fernandez, and E. Towns-Andrews. 1993. Two-dimensional time-resolved x-ray diffraction studies of live isometrically contracting frog sartorius muscle. J. Muscle Res. Cell Motil. 14:311–324. [DOI] [PubMed] [Google Scholar]
- 7.Bordas, J., A. Svensson, M. Rothery, J. Lowy, G. P. Diakun, and P. Boesecke. 1999. Extensibility and symmetry of actin filaments in contracting muscles. Biophys. J. 77:3197–3207. [DOI] [PMC free article] [PubMed] [Google Scholar]
- 8.Irving, M., G. Piazzessi, L. Lucii, Y.-U. Sun, J. J. Harford, I. M. Dobbie, M. A. Ferenczi, M. Reconditi, and V. Lombardi. 2000. Conformation of the myosin motor during force generation in skeletal muscle. Nat. Struct. Biol. 7:482–485. [DOI] [PMC free article] [PubMed] [Google Scholar]
- 9.Piazzesi, G., M. Reconditi, M. Linari, L. Lucii, Y.-B. Sun, T. Narayanan, P. Boesecke, V. Lombardi, and M. Irving. 2002. Mechanism of force generation by myosin heads in skeletal muscle. Nature. 415:659–662. [DOI] [PubMed] [Google Scholar]
- 10.Wakabayashi, K., Y. Ueno, Y. Amemiya, and H. Tanaka. 1988. Intensity changes of actin-based layer lines from frog skeletal muscles during an isometric contraction. In Molecular Mechanism of Muscle Contraction. H. Sugi and G.H. Pollack, editors. Plenum Press, New York, London. 353–367. [PubMed]
- 11.Yagi, N. 1996. Labelling of thin filaments by myosin heads in contracting and rigor vertebrate skeletal muscles. Acta Cryst. D. 52:1169–1173. [DOI] [PubMed] [Google Scholar]
- 12.Inoue, K., T. Oka, T. Suzuki, N. Yagi, K. Takeshita, S. Goto, and T. Ishikawa. 2001. Present status of high flux beamline (BL40XU) at SPring-8. Nucl. Instr. Method. A467–468:674–677. [Google Scholar]
- 13.Yagi, N. 2003. An x-ray diffraction study on early structural changes in skeletal muscle contraction. Biophys. J. 84:1093–1102. [DOI] [PMC free article] [PubMed] [Google Scholar]
- 14.Yagi, N., K. Inoue, and T. Oka. 2004. CCD-based x-ray area detectors for time-resolved experiments. J. Synchr. Rad. 11:456–461. [DOI] [PubMed] [Google Scholar]
- 15.Hara, T., T. Tanaka, T. Seike, T. Bizen, X. Maréchal, T. Kohda, K. Inoue, T. Oka, T. Suzuki, N. Yagi, and H. Kitamura. 2001. In-vacuum x-ray helical undulator for high flux beamline at SPring-8. Nucl. Instr. Method. A467–468:165–168. [Google Scholar]
- 16.Amemiya, Y., K. Ito, N. Yagi, Y. Asano, K. Wakabayashi, T. Ueki, and T. Endo. 1995. Large-aperture TV detector with a beryllium-windowed image intensifier for x-ray diffraction. Rev. Sci. Instr. 66:2290–2294. [Google Scholar]
- 17.Wakayama, J., T. Tamura, N. Yagi, and H. Iwamoto. 2004. Structural transients of contractile proteins upon sudden ATP liberation in skeletal muscle fibers. Biophys. J. 87:430–441. [DOI] [PMC free article] [PubMed] [Google Scholar]
- 18.Mendelson, R., and E. P. Morris. 1997. The structure of the acto-myosin subfragment 1 complex: results of searches using data from electron microscopy and x-ray crystallography. Proc. Natl. Acad. Sci. USA. 94:8533–8538. [DOI] [PMC free article] [PubMed] [Google Scholar]
- 19.Huxley, H. E., and M. Kress. 1985. Crossbridge behavior during muscle contraction. J. Muscle Res. Cell Motil. 6:153–161. [DOI] [PubMed] [Google Scholar]
- 20.Baker, J. E., I. Brust-Mascher, S. Ramachandran, L. E. W. LaConte, and D. D. Thomas. 1998. A large and distinct rotation of the myosin light chain domain occurs upon muscle contraction. Proc. Natl. Acad. Sci. USA. 95:2944–2949. [DOI] [PMC free article] [PubMed] [Google Scholar]
- 21.Luther, P. K., and J. M. Squire. 1980. Three-dimensional structure of the vertebrate muscle A-band. II. The myosin filament superlattice. J. Mol. Biol. 141:409–439. [DOI] [PubMed] [Google Scholar]
- 22.Yagi, N., Y. Amemiya, and K. Wakabayashi. 1995. A real-time observation of x-ray diffraction from frog skeletal muscle during and after slow length changes. Jpn. J. Physiol. 45:583–606. [DOI] [PubMed] [Google Scholar]
- 23.Lombardi, V., G. Piazzesi, M. A. Ferenczi, H. Thirlwell, I. Dobbie, and M. Irving. 1995. Elastic distortion of myosin heads and repriming of the working stroke in muscle. Nature. 374:553–555. [DOI] [PubMed] [Google Scholar]
- 24.Huxley, H. E., M. Reconditi, A. Stewart, and T. Irving. 2003. X-ray interference evidence concerning the range of crossbridge movement, and backbone contributions to the meridional pattern. Adv. Exp. Med. Biol. 538:233–241. [DOI] [PubMed] [Google Scholar]
- 25.Haselgrove, J. C. 1975. X-ray evidence for conformational changes in the myosin filaments of vertebrate striated muscle. J. Mol. Biol. 92:113–143. [DOI] [PubMed] [Google Scholar]
- 26.Ford, L., A. F. Huxley, and R. M. Simmons. 1977. Tension responses to sudden length change in stimulated frog muscle fibres near slack length. J. Physiol. 269:441–515. [DOI] [PMC free article] [PubMed] [Google Scholar]
- 27.Lombardi, V., G. Piazzesi, and M. Linari. 1992. Rapid regeneration of the actin-myosin power stroke in contracting muscle. Nature. 355:638–641. [DOI] [PubMed] [Google Scholar]
- 28.Koubassova, N. A., and A. K. Tsaturyan. 2002. Direct modeling of x-ray diffraction pattern from skeletal muscle in rigor. Biophys. J. 83:1082–1097. [DOI] [PMC free article] [PubMed] [Google Scholar]
- 29.Tamura, T., J. Wakayama, T. Fujisawa, N. Yagi, and H. Iwamoto. 2004. Intensity of x-ray reflections from skeletal muscle thin filaments partially occupied with myosin heads: effect of cooperative binding. J. Muscle Res. Cell Motil. 25:329–335. [DOI] [PubMed] [Google Scholar]
- 30.Linari, M., G. Piazzesi, I. Dobbie, N. Koubassova, M. Reconditi, T. Narayanan, O. Diat, M. Irving, and V. Lombardi. 2000. Interference fine structure and sarcomere length dependence of the axial x-ray pattern from active single muscle fibers. Proc. Natl. Acad. Sci. USA. 97:7226–7231. [DOI] [PMC free article] [PubMed] [Google Scholar]
- 31.Ferenczi, M. A., S. Y. Bershitsky, N. Koubassova, V. Siththanandan, W. I. Helsby, P. Panine, M. Roessle, T. Narayanan, and A. K. Tsaturyan. 2005. The “roll and lock” mechanism of force generation in muscle. Structure. 13:131–141. [DOI] [PubMed] [Google Scholar]
- 32.Matsubara, I., N. Yagi, and H. Hashizume. 1975. Use of an x-ray television for diffraction of the frog striated muscle. Nature. 255:728–729. [DOI] [PubMed] [Google Scholar]
- 33.Squire, J. M., and J. J. Harford. 1988. Actin filament organization and myosin head labelling patterns in vertebrate skeletal muscles in the rigor and weak binding states. J. Muscle Res. Cell Motil. 9:344–358. [DOI] [PubMed] [Google Scholar]