

Abstract
The mechanism of CD8 cooperation with the TCR in antigen recognition was studied on live T cells. Fluorescence correlation measurements yielded evidence of the presence of two TCR and CD8 subpopulations with different lateral diffusion rate constants. Independently, evidence for two subpopulations was derived from the experimentally observed two distinct association phases of cognate peptide bound to class I MHC (pMHC) tetramers and the T cells. The fast phase rate constant ((1.7 ± 0.2) × 105 M−1 s−1) was independent of examined cell type or MHC-bound peptides' structure. Its value was much faster than that of the association of soluble pMHC and TCR ((7.0 ± 0.3) × 103 M−1 s−1), and close to that of the association of soluble pMHC with CD8 ((1–2) × 105 M−1 s−1). The fast binding phase disappeared when CD8-pMHC interaction was blocked by a CD8-specific mAb. The latter rate constant was slowed down ∼10-fold after cells treatment with methyl-β-cyclodextrin. These results suggest that the most efficient pMHC-cell association route corresponds to a fast tetramer binding to a colocalized CD8-TCR subpopulation, which apparently resides within membrane rafts: the reaction starts by pMHC association with the CD8. This markedly faster step significantly increases the probability of pMHC-TCR encounters and thereby promotes pMHC association with CD8-proximal TCR. The slow binding phase is assigned to pMHC association with a noncolocalized CD8-TCR subpopulation. Taken together with results of cytotoxicity assays, our data suggest that the colocalized, raft-associated CD8-TCR subpopulation is the one capable of inducing T-cell activation.
INTRODUCTION
The interaction between the TCR expressed on the surface of CD8+ T-lymphocytes and its ligand, peptide-class I MHC complexes (pMHC) on APCs is central to the positive selection and activation of these cells. This interaction is endowed with a high specificity, usually paralleled by modest affinities (1–4). Already at this early stage of T-cell interactions with the APC, additional, non-antigen-specific interactions take place between the T-cell surface glycoprotein CD8 and the pMHC ligand (5). Due to its important role in TCR-ligand interaction and signal transduction, CD8 is considered to be a TCR coreceptor (6–9). Three-dimensional structure analysis of TCR-pMHC complexes revealed that the TCRαβ heterodimer binds to the α1 and α2 domains of the MHC heavy chain and to exposed side chains of the peptide bound in the “groove” (1,10,11). In contrast, CD8 binds to conserved areas, distal to the “groove” on the α2 and α3 domains of MHC heavy chain and on β2-microglobulin (12,13). Though a consensus exists about the final outcome of the CD8-pMHC interactions for tetramer binding and T-cell activation (7,14–16) the mechanism of CD8 function is still debated (17). Data obtained for the interactions between soluble pMHC, TCR, and CD8 molecules failed to detect an enhancement of TCR-pMHC affinity due to the latter interaction with CD8 (18). Therefore, CD8 and TCR interact independently with their pMHC ligand. It is known that the CD8-pMHC affinity is significantly lower than that of the TCR-pMHC. Nevertheless, CD8 was shown to dramatically increase association of pMHC tetramers with T cells (5,14,19). A recent study has provided evidence that optimal binding of pMHC multimers to live T cells requires “simultaneous engagement” of CD8 and TCR (5). However, the detailed mechanism by which CD8 promotes pMHC-cell association has not been resolved.
Resolution of the earliest events of T-cell-ligand interactions should take into account the following biophysical parameters: a), cell surface density and mobility of the TCR and CD8, b), their spatial relationship, and c), affinities and kinetic parameters of these interactions. Both the low expression levels of CD8 and TCR (in the range of 104 copies per cell (20)), as well as the relatively low affinities of the pMHC-TCR (0.1–100 μM) and pMHC-CD8 (10–100 μM) interactions (9,21,21,22) make their direct measurements on live cells in real time a considerable challenge.
Recent progress made in fluorescence correlation spectroscopy (FCS) offers an invaluable experimental possibility for investigating molecular events such as diffusion of cellular membrane components (23–26). The method is based on monitoring intensity fluctuations of a fluorescence probe carried by a molecule of interest in an extremely small volume selected by a sharply focused laser beam on the cell surface. We have now employed FCS for noninvasive measurements of the diffusion processes taking place on the T-cell plasma membrane. These were complemented by time-resolved measurements of the pMHC-TCR or CD8 interactions carried out using fluorescent pMHC tetramers (pMHC)4 (27). The use of tetramers circumvents, at least partly, problems caused by their intrinsic low affinity, as tetramers avidity yields higher binding than that of monomeric pMHC complexes and allows monitoring directly the time courses of their association and dissociation.
Two different T-cell systems were investigated: 1), a hybridoma cell line expressing the T1 TCR and CD8 (28) (the interaction of TCR T1 recombinant soluble form with cognate pMHC complex have earlier been studied (29)), and 2), two CTL clones (30). Studies of the latter allowed correlating the obtained biophysical parameters with cytotoxic function. A model where CD8 plays a major role in pMHC binding to T cells is proposed.
MATERIALS AND METHODS
Cell lines, antibodies, and chemicals
Unless otherwise stated, all chemicals were purchased from Sigma-Aldrich (Rehovot, Israel). The CD8αβ transfected T1.4 hybridoma cells have been described previously (28). The cells were cultured in DMEM (GibcoBRL, Paisley, Scotland) supplemented with 10% fetal calf serum (GibcoBRL), 2 mM l-glutamine, 1 mM sodium pyruvate, combined antibiotics (Bio-Lab, Jerusalem, Israel), and 50 μM β-mercaptoethanol in a humidified atmosphere with 7% CO2 at 37°C. CD8+ DBA/2 CTL clones (CAS1 and CAS20) were raised against syngeneic (H-2d) P815 tumor cells transfected with the HLA-Cw3 gene as target cells, as described earlier (30). The clones were cultured in RPMI-1640 (GibcoBRL) supplemented with 10% fetal calf serum, 2 mM l-glutamine, 1 mM sodium pyruvate, combined antibiotics, and 50 μM β-mercaptoethanol in a humidified atmosphere with 5% CO2 at 37°C. The cells were stimulated every one or two weeks with 1 × 10⁴ Rad irradiated 2 × 10⁶ target cells, 2 × 10³ Rad irradiated 20 × 106 DBA/2 splenocytes (per 15 ml medium), and 20 units/ml IL-2 (ProSpec-Tany TechnoGene, Rehovot, Israel). CD3-specific mAb labeled with CyChrome (clone 17A2) was purchased from PharMingen (San Diego, CA). CD8-specific mAb (clone 53-6.7) labeled with SPRD was purchased from Southern Biotechnologies (Birmingham, AL). Purified and allophycocyanin-labeled CD8-specific mAb (clone CT-CD8a) was purchased from CALTAG Laboratories (Burlingame, CA). TCRβ-chain specific mAb (clone H57 American hamster IgG) was purchased from American Type Culture Collection (Manassas, VA). Fab fragments preparation protocol (31) was as follows: 1 mg of the H57 mAbs were digested into Fab with papain (Sigma, St. Louis, MO) in digesting buffer (PBS, 0.01 M EDTA, 0.1 M cystein, papain, mAb/enzyme ratio 100:1). The reaction was stopped by adding iodoacetamide (0.03 M final concentration). The product was purified by the passage through a protein G column to remove possibly remaining intact IgG and Fc fragment. These Fab preparations were confirmed to form a single band with 50 kDa on SDS-PAGE. The digested samples were labeled with either Cy3 or Cy5 and purified on a GD10 gel filtration column (Amersham Pharmacia Biotech, Petach Tikva, Israel) and then by gel filtration on Superdex 200 column (1 × 30 cm, Amersham Pharmacia Biotech), in 20 mM TRIS, 150 mM NaCl, pH 8. The dye/protein ratio was 1–1.5 for both dyes. Fluorescein-5-isothiocyanate labeled cholera toxin B subunit (CTB-FITC) was purchased from Sigma.
Preparation of peptides and peptide-loaded H-2Kd tetramers
Peptides
The pCw3 derived from HLA-Cw3 (residues 170–179, RYLKNGKETL) was synthesized by automated solid-phase methodology on an Applied Biosystems (Foster City, CA) model 432A synthesizer, using the manufacturer's standard Fmoc protocol, and purified by high-performance liquid chromatography. Synthesis and purification of the peptide azido benzoic acid derivative SYIPSAEK(ABA)I, (pPbCSABA), from Plasmodium berghei circumsporozoite protein (residues 252–260), was described elsewhere (32).
H-2Kd tetramers
Peptide-loaded tetramers were produced by reacting biotinylated H-2Kd/pPbCSABA or H-2Kd/pCw3 complexes with PE-labeled streptavidin (Molecular Probes, Eugene, OR) as described elsewhere (19). The labeled tetramers were purified on a Superdex 200 column, which was eluted in Tris buffer (20 mM, pH 7.5, 150 mM NaCl, 0.1% NaN3).
Fluorescence correlation and confocal microscopy measurements
Fluorescence correlation measurements were performed with confocal illumination of a volume element of 0.2 fl on a ConfoCor2 instrument (Carl Zeiss, Jena, Germany) as described elsewhere (26). A 40× N.A. 1.2 C-Apochromat water immersion objective and 78-μm pinhole were used. To study TCR and CD8 diffusion properties, the T1.4 or CTL clones (106 cell/ml) were reacted with Cy3, SPRD, or CyChrome-labeled specific antibodies for 40 min on ice in PBS containing 3% fetal calf serum and 0.02% NaN3 then washed 3× with the same buffer. The cells were kept on ice before the measurements and 40 μl of the cell samples were loaded on a borosilicate coverslip (Marienfeld, Lauda-Königshofen, Germany) and measurements proceeded for 5 min at room temperature. The fluorescence intensity fluctuations were recorded for 30-s intervals and each measurement was repeated 5–10 times. Special care was taken to acquire fluorescence fluctuations without drift in the baseline. The two-dimensional (2D) autocorrelation function G(τ) was analyzed according to the following equations:
 |
(1) |
where N is the number of fluorescent particles in the illuminated spot on the cell-membrane surface, ai is a fraction of fluorescence molecules with τi diffusion time constants using GLSA optimization program (Alango, Haifa, Israel). The diffusion constants were calculated as
 |
(2) |
where the beam waist ω was 0.20 μm. The experimental errors are specified as two standard deviations from the mean values (mean ± SD 2σ). The apparatus was calibrated by measuring diffusion of rhodamine B in water (280 μm2/s). Confocal microscopy measurements were performed with Radiance2100 (Bio-Rad, Cambridge, MA) equipped with a 40× oil immersion objective and an Argon-ion laser using excitations of 488 nm for FITC and Cy3 and 543 nm for CyChrome and SPRD.
Time-resolved measurements of pMHC tetramers interaction with T cells
Reactions were initiated by adding 1–10 μl of tetramer solution (2 μM) to 200 μl cell suspension (107 cell/ml) at 24°C. At the indicated time points, 10 μl aliquots of the cell-tetramer mixtures were diluted to 1 ml in cold PBS (4°C) containing 3% fetal calf serum and 0.02% NaN3. These 100-fold dilutions reduced the unbound tetramer concentrations to the picomolar level so that its contribution to the background fluorescence signal was <5–10% of that due to the specifically bound fraction. The cell-associated fluorescence intensity was then analyzed for 15-s intervals by flow cytometry (FACSort, Becton-Dickinson, Franklin Lakes, NJ) using CellQuest software. The experimental time courses were produced by plotting fluorescence mean values versus time and analyzed by the GLSA optimization program using a two-exponential model:
 |
(3) |
where ai and ki are the amplitudes and corresponding apparent rate constants, respectively, and a0 is a constant.
To investigate the tetramer dissociation kinetics we used the following dilution protocol: 200 μl of CTLs or the hybridoma T-cell suspensions (107 cell/ml) were preincubated for 2 h with their specific pMHC tetramers (final concentration 20 nM) at the indicated temperatures, in PBS containing 3% fetal calf serum and 0.02% NaN3. Then, 80 μl cell samples were diluted into 1 ml of the same buffer containing CD8-specific antibodies (CT-CD8a, final concentration 0.15 μM) preventing tetramer rebinding to the cells. The time course of changes in cell-associated fluorescence was measured by flow cytometry for 15-s intervals.
Cells treatment with methyl-β-cyclodextrin
T1.4 CD8αβ+ cells were washed once with PBS, suspended at 2 × 10⁶ cell/ml, and incubated for 1 h in a humidified atmosphere with 5% CO2 at 37°C with serum-free DMEM in the absence (controls) or presence (treated cells) of 5 mM MβCD. The cells were then washed once in PBS and suspended at ∼107 cell/ml in PBS containing 3% fetal calf serum and 0.02% NaN3 and subjected to flow cytometry measurements as above.
Cytotoxicity assay
CAS1 and CAS20 CTL clones were tested in a 4-h [51Cr]-release assay. The experiments were carried out using 5000 target cells per well at 0.1–30 E/T ratios. The percentage of specific lysis was calculated as: (experimental-spontaneous release)/(total-spontaneous release) × 100%. All experiments were performed in triplicates and repeated two to three times.
RESULTS
Expression levels of TCR and CD8 do not correlate with cytotoxic activity
Interaction of CD8 with its pMHC ligand is known to significantly increase the cytotoxic response and decrease the threshold of CTL activation. However, no cooperativity has been revealed in the interactions among recombinant, soluble pMHC, CD8, and TCR (18). Hence, CD8 and TCR independently bind to the same pMHC molecule. Therefore, if both CD8 and TCR are independently and homogeneously distributed, T-cell responsiveness would be a function of the TCR and CD8 average surface densities on the cell's membrane and of their individual mobilities. The lack of such a straightforward dependence may therefore indicate heterogeneity and/or interdependence of the CD8 and TCR membrane localization. To investigate these possibilities we have measured TCR and CD8 expression levels and examined their relation to the CTL killing efficacy of the CAS1 and CAS20 clones. The surface expression level of CD8, monitored by flow cytometry, was found to be approximately fourfold higher than that of TCR (fluorescence efficiency of CyChome and SPRD tags of the CD3- and CD8-specific mAbs, which are different trademarks for the same PE-Cy5 conjugate, were found to be about equal by quantitative fluorimetric measurements). Both CD8 and TCR expression levels are found to depend on the time elapsed after cell stimulation (Fig. 1 A). Both CD8 and TCR levels exhibited a transient increase with maxima on the 3rd to 4th day after stimulation, followed by an eightfold decrease for CD8 and a 10-fold decrease for TCR on the 11th to 12th day. To ascertain that the observed changes result from an alteration of the protein's surface density and are not due to a change in the cell's size, we compared confocal images of these cells on different poststimulation (PS) days. Fig. 1 B shows that the changes are indeed caused primarily by a significant reduction in cell surface density of these proteins. As a reference, TCR and CD8 expression levels were measured on T1.4 hybridoma cells, which remained unchanged over time.
FIGURE 1.

CTL cytotoxicity does not correlate with TCR and CD8 expression levels. (A) Expression levels of TCR and CD8 (traces 1, 2 and 3, 4, respectively) on the surface of two CTL clones, CAS20 (traces 1, 3), and CAS1 (traces 2, 4) as a function of the time elapsed after cell stimulation. The cells were stimulated every 1 or 2 weeks with the P815 targets transfected with HLA-Cw3 and human β2-microglobulin in the presence of IL2 (20 units/ml). Harvested cells for flow cytometry were suspended at concentration 4 × 10⁶ cell/ml in PBS containing 3% fetal calf serum and 0.02% NaN3 and 100 μl aliquots were incubated with 2 μl (1 mg/ml) of the CD3-specific mAb (clone 17A2) labeled with CyChrome or CD8-specific mAb (clone 53-6.7) labeled with SPRD. After 40 min incubation on ice, the cells were washed 3× and analyzed immediately. (B) Fluorescence confocal images of CAS20 cells on the 4th and 9th day after stimulation. As before, the cells were reacted with SPRD-labeled CD8-specific mAb (clone 53-6.7) and washed 3×. (C) Cytotoxicity of the CTL clone CAS20 raised against P815 (H-2d) cells transfected with HLA-Cw3 and human β2-microglobulin. The lytic efficacy of the clone was tested at different E/T ratios in a 51Cr release assay against P815 (○) and RMA-S transfected with H-2Kd heavy chain, human β2-microglobulin and pulsed with different concentrations of the cognate peptide pCw3: 1 μM (□), 5 μM (*), and 25 μM (⋄). In all cases, spontaneous release was <10% of total labeling. The experiments were performed on the 5th day after the cell stimulation. (D) Comparison of CTLs cytotoxicity (clone CAS20) on the 4th (○) and 11th (□) days after stimulation for the P815 targets.
Next, CTL killing efficiency was determined by measurements of specific lysis of the (H-2d) P815 tumor cells transfected with the HLA-Cw3 gene and expressing H-2Kd/pCw3 complexes on the cell surface or H-2d transfected RMA-S cells using the 51Cr release assay. The latter cells, expressing peptide “empty” H-2Kd molecules on the cell surface, were loaded with different pCw3 concentrations. CAS20 cells exhibited the highest killing efficacy for the P815 targets. As expected, the higher surface densities of H-2Kd/pCw3 on the APCs correlated with higher chromium release (Fig. 1 C). Nevertheless, no such a relationship was observed with the surface densities of TCR and CD8; killing experiments were carried out on the days where the surface expressions of the latter molecules were significantly different (4th and 11th PS days). We did not resolve higher lytic efficacy on the 4th PS day when the CD8 and TCR expression levels were significantly higher. Moreover, the lytic efficacy was higher on the 11th day when the inflexion point in the cytotoxic titration curve was reached at ∼0.3 E/T ratio, whereas on the 4th day this was observed only at ∼1 E/T ratio (Fig. 1 D).
Lateral diffusion and cell-surface distributions of TCR and CD8 are heterogeneous
The above-described lack of correlation between the cellular cytotoxicity and the expression levels of TCR and CD8 led us to investigate the lateral mobility of these molecules on the cell's surface. FCS was employed as these measurements are noninvasive and yield detailed diffusion patterns. The required fluorescence labeling of the examined molecules was achieved by reacting the cells with fluorescently labeled specific mAbs. As these measurements were performed at 24°C on live cells, PBS containing 0.02% NaN3 was used to prevent cytoskeleton motion.
One of the potential pitfalls of using divalent antibodies is a possible clustering of the examined proteins induced by the bivalent antibodies. To examine whether this affected our experimental results, TCR diffusion was measured on the surface of the CD8+ T1.4 and CAS20 cells reacted with either one of the following reagents: monovalent Fab fragments of TCR β-chain specific mAb (clone H57) labeled with Cy3 and a CD3-specific 17A2 mAb labeled with CyChrome. For all FCS experiments, fluorescence photobleaching was observed at the initial stage of measurements. This caused a drift in the fluorescence baseline. The observed photobleaching led us to investigate mobility of rafts by monitoring diffusion of the raft-resident lipid ganglioside GM1. For that, the cells were reacted with FITC-CTB, which is known to specifically bind to GM1. The FITC-CTB fluorescence intensity exhibited photobleaching even at very low excitation levels of the argon 488-nm line (5–10 μW) and therefore the correlation function reflected the rate of the FITC photobleaching rather than the rate of GM1 mobility (not shown). Similar photobleaching was observed in FCS experiments on rat basophilic leukemia cells (RBL)-2H3 where GM1 was reacted with CTB labeled by Cy3, a fluorescence probe possessing a significantly higher photostability than fluorescein (33). Therefore, the observed photobleaching is due to a slow mobility of GM1 and not to the FITC-limited photostability. Thus, the raft diffusion constant as implied by our observation was estimated to be slower than 0.02 μm2/s, the rate that can be confidently detected in our experimental setup. In contrast to the CTB-FITC measurements, fluorescence photobleaching of the labeled antibodies was observed only during the first 20–40 s after beginning of the measurements and then the fluorescence intensity reached a steady-state level. This suggests that only a fraction of CD8 or TCR molecules possesses mobility too slow to be measured by FCS (<0.02 μm2/s) whereas practically all GM1 molecules were “immobile”. In addition to the photobleaching, we observed processes, which could also lead to baseline drifts, e.g., a slow movement of the entire cell leading to a change in the point of observation on the cell surface, or a cytoskeleton motion induced by the excitation light. Therefore, special care has always been taken to carry out the measurements at the lowest possible excitation level on immobile cells. In addition, the cells were maintained in the sodium azide-containing buffer to prevent cytoskeleton motion. We assume that taking all the above precautions, one can confidently study diffusion processes with rate constants faster than 0.02 μm2/s. Quantitative investigation of slower processes on live cells was not feasible on the available FCS instruments.
Diffusion measurements of TCR reacted with Fab fragments or intact mAb were performed when the initial photobleaching was finished. Representative fluorescence fluctuation profiles and corresponding autocorrelation functions are shown in Fig. 2, A–D (T1.4 CD8+ cells) and Fig. 2, G–J (CAS20). Very similar correlation functions were observed for both the Fab fragments and intact mAb. Diffusion parameters were derived by fitting the correlation functions to a three-component model (Eqs. 1 and 2). The first term accounts for diffusion of unbound antibodies or Fab fragments, which are always present in such measurements and the other two terms account for the lateral diffusion. However, this fitting is mathematically an ill-posed problem, i.e., about equally good fits could be obtained to an experimental correlation function with different sets of experimental parameters. To stabilize the convergence, the value of the fastest diffusion rate constant, corresponding to diffusion of free PE-labeled IgG-class mAbs (150 kD IgG + 240 kD PE) or the Fab fragments (∼50 kD) was kept constant at the expected values for this molecular mass, i.e., 24 μm2/s or 46 μm2/s, respectively. These values were experimentally determined in independent three-dimensional FCS experiments. The 2D model calculates these parameters with a relatively small systematic error (<20%). This, however, did not significantly affect parameters of the second and third terms due to a large difference between diffusion rates of the free and membrane-bound molecules. The two other rate constants were assigned to the lateral diffusion of two subpopulations of each of these membrane-resident proteins.
FIGURE 2.

Diffusion measurements of TCR and CD8 on the surface of T1.4 CD8αβ+ (A–F) and CAS20 (G–L) cells. The cells were reacted on ice for 30 min with the respective specific fluorescently labeled Fab or mAbs and washed 3×. Measurements were made at 24°C within 5 min after cells loading on the slides. Intensity fluctuations (A and G) and autocorrelation functions (B and H) of Cy3-labeled Fab (clone H-57) reacted with the cells. Intensity fluctuation (C and I) and correlation functions (D and J) CyChrome-labeled CD3-specific mAb (clone 17A2) reacted with the cells. Intensity fluctuations (E and K) and autocorrelation functions (F and L) of SPRD-labeled CD8-specific mAb (clone 53-6.7) reacted with the cells.
The following diffusion rate constants (μm2/s) and their respective amplitudes were calculated for the Fab fragment: kD1 = 46, a1 = (7 ± 5)%; kD2 = 0.8 ± 0.4, a2 = (13 ± 10)%; kD3 = 0.04 ± 0.03, a3 = (80 ± 20)% on CD8+ T1.4 cells and kD1 = 46, a1 = (9 ± 6)%; kD2 = 0.9 ± 0.4, a2 = (33 ± 20)%; kD3 = 0.04 ± 0.04, a3 = (58 ± 25)% (CAS20 cells). Similar parameters were calculated for TCR reacted with the intact mAb: kD1 = 24, a1 = (8 ± 6)%; kD2 = 0.7 ± 0.4, a2 = (16 ± 8)%; kD3 = 0.07 ± 0.04, a3 = (76 ± 25)% (CD8+ T1.4 cells), and kD1 = 24, a1 = (10 ± 2)%; kD2 = 0.7 ± 0.3, a2 = (39 ± 20)%; kD3 = 0.03 ± 0.02, a3 = (51 ± 20)% (CAS20). This implies that possible clustering did not significantly affect the results obtained under the employed experimental protocol when fluorescence fluctuations were measured within 5 min after loading the cells onto a slide at room temperature (24°C). Fluorescence fluctuations and respective correlation functions for CD8 reacted with specific mAb (clone 53-6.7) labeled with SPRD are shown in Fig. 2, E and F (CD8+ T1.4 cells) and K and L (CAS20 cells). CD8 diffusion rate constants (μm2/s) and their respective amplitudes were calculated: kD1 = 24, a1 = (5 ± 2)%; kD2 = 0.8 ± 0.3, a2 = (46 ± 20)%; kD3 = 0.03 ± 0.02, a3 = (48 ± 20)% for T1.4 CD8+ cells and kD1 = 24, a1 = (6 ± 3)%; kD2 = 1.1 ± 0.4, a2 = (39 ± 15)%; kD3 = 0.08 ± 0.05, a3 = (55 ± 20)% for CAS20 cells. Thus, these FCS measurements clearly resolved two subpopulations of the CD8 and TCR molecules with significantly different diffusion rate constants (kD2 and kD3) and one with the diffusion rate constant, which could not be measured in these FCS experiments (<0.02 μm2/s). However, the differences between values of kD2 and kD3 determined for the rates of TCR and CD8 diffusion were found to be nonsignificant statistically (In t-test; p = 0.60 for kD2 and p = 0.22 for kD3 on T1.4 CD8+ cells and p = 0.32 for kD2 and p = 0.17 for kD3 on CAS20 cells).
Surface distributions of TCR and CD8 molecules and their possible localization in membrane rafts were examined by fluorescence confocal microscopy. The cells were reacted with either FITC-CTB together with the CD3-specific, CyChrome-labeled mAb 17A2 or with the CD8-specific mAb 53-6.7 labeled with SPRD in PBS buffer containing 0.02% NaN3 to immobilize the cytoskeleton and exclude its possible involvement in raft aggregation. Nevertheless, GM1 patches labeled by CT-FITC were observed. This implies that optically detectable rafts were present on the surface of both CTL and the hybridoma cells. These patches exhibited partial overlap with those labeled by either the CD3- or CD8-specific labeled mAbs (Supplementary Materials, Fig. 1).
Real-time pMHC tetramer binding measurements: the fast pMHC-CD8 association accelerates tetramer binding to the cells
The observation by FCS measurements of three components in the diffusion of TCR and CD8 molecules led us to suggest that they correspond to their respective distinct subpopulations on the cell's membrane. To further investigate their interactions with the pMHC ligand, association and dissociation time courses of pMHC tetramers were carried out. pMHC tetramers were employed as their avidity yields higher binding than that of monomeric pMHC complexes and allows monitoring these time courses directly.
First, interactions between H-2Kd/pCw3 tetramers and the CTL clone CAS20 were studied. Maximal tetramer binding amplitudes and biphasic time course were observed when both TCR and CD8 molecules were available for the interaction (Fig. 3 A, trace 1). Then, CD8-pMHC interactions were blocked by preincubating the cells (30 min at 24°C) with the CD8-specific mAb (CT-CD8a). This antibody was found to bind to the immunoglobulin CDR-like loops of CD8 involved in binding to the negatively charged loop of the α3 domain of MHC class I and thereby blocks CD8-pMHC interaction (34,35). When the cells were reacted with CD8-specific mAb (CT-CD8a), the binding amplitude dropped to only ∼10% of the previous case and only a single binding phase was observed (Fig. 3 A, trace 2). The specificity of the interactions was examined by loading the tetramers with a noncognate peptide (pPbCSABA) and indeed no binding was observed (Fig. 3 A, trace 5). Interaction rate constants and amplitudes derived from analysis of the respective time curves are listed in Table 1. These show that when tetramers interacted only with the cell-surface TCRs (i.e., when the CD8 was blocked by a specific mAb), the observed single phase of association time course had a rate constant of (1.1 ± 0.4) × 10−3 s−1. When both CD8 and TCR were available for the reaction, two binding phases were resolved. The fast phase comprising ∼50% of the total binding amplitude had a rate constant of (3.3 ± 0.7) × 10−3 s−1, whereas that of the slow phase was about an order of magnitude slower (4.5 ± 2.0) × 10−4 s−1. Thus, in the latter case, a faster overall binding process is observed with markedly larger total amplitude. Similar results were observed for H-2Kd/pPbCSABA tetramers association with the T1.4 CD8αβ+ hybridoma cells (traces 1 and 2 in Fig. 3 B and Table 1). Finally, association rate constants of both fast and slow phases increased upon increasing the tetramer concentration from 8 to 25 nM (Table 2) implying that each of them involves a second-order step.
FIGURE 3.

Real-time measurements of pMHC tetramer interactions with T cells by flow cytometry. (A) Association (traces 1 and 2) and dissociation (traces 3 and 4) time courses of PE-labeled H-2Kd tetramers loaded with the cognate peptide, pCw3, or the noncognate one, pPbCSABA (trace 5) to the CTL clone CAS20 on the 2nd day after stimulation, studied by flow cytometry at 24°C. In the experiments illustrated by traces 2 and 4 the cells were preincubated for 30 min at 24°C with the CD8-specific mAb (clone CT-CD8a; final concentration 0.15 μM), which abrogates CD8-pMHC interactions. Tetramer concentration was 20 nM. (B) Association (traces 1, 2, and 5) and dissociation (traces 3 and 4) time courses of PE-labeled H-2Kd tetramers loaded with a cognate peptide, pPbCSABA, to the hybridoma cells transfected with T1 TCR and CD8αβ. In the experiments illustrated by traces 2 and 4, the cells were preincubated as above with the CD8-specific mAb. In the experiments illustrated by trace 5, the cells were preincubated with 5 μM MβCD for 1 h at 37°C. Tetramer concentration was 44 nM. (C) Binding time courses of PE-labeled H-2Kd/pCw3 tetramers to CTL clone CAS20 on different PS days: 3rd (trace 1), 5th (trace 2), 8th (trace 3) day at 24°C. The tetramer concentration was 11 nM. All traces were fitted by one- or two-exponential models and the evaluated parameters are listed in Table 1.
TABLE 1.
Parameters derived from analysis of the association/dissociation time courses of PE-labeled tetramers with/from T cells
| Figure (panel/trace) | Experimental condition | Reaction | a0 × 101 | a1 × 102 | k1, s−1 × 10⁻³ | a2 × 101 | k2, s−1 × 10⁻⁴ |
|---|---|---|---|---|---|---|---|
| 3 A/1 | −CT-CD8a* | Association | 42 ± 2 | −(2.2 ± 0.1) | 3.3 ± 0.7 | −(20 ± 1) | 4.5 ± 2.0 |
| 3 A/2 | +CT-CD8a* | Association | 3.9 ± 0.2 | – | – | −(3.9 ± 0.2) | 11 ± 4 |
| 3 A/3 | −CT-CD8a* | Dissociation | 3.8 ± 0.2 | 3.4 ± 0.2 | 2.7 ± 0.8 | 4 ± 2 | 8.0 ± 2.0 |
| 3 A/4 | +CT-CD8a* | Dissociation | 1.2 ± 0.1 | – | – | 2.7 ± 0.2 | 9.0 ± 2.0 |
| 3 B/1 | −CT-CD8a* | Association | 56 ± 3 | −(2.0 ± 0.1) | 7.5 ± 1.0 | −(36 ± 2) | 2.4 ± 0.6 |
| 3 B/2 | +CT-CD8a* | Association | 6.0 ± 0.3 | – | – | −(6.0 ± 0.3) | 1.0 ± 0.6 |
| 3 B/3 | −CT-CD8a* | Dissociation | 0.3 ± 0.1 | 3.6 ± 0.2 | 1.6 ± 0.4 | 16 ± 1 | 3.0 ± 0.4 |
| 3 B/4 | +CT-CD8a* | Dissociation | 0.4 ± 0.1 | – | – | 3.0 ± 0.3 | 4.0 ± 0.6 |
| 3 B/5 | +MβCD† | Association | 23 ± 1 | – | – | −(23 ± 1) | 6.5 ± 1.2 |
| 3 C/1 | −CT-CD8a* | Association | 44 ± 2 | −(2.2 ± 0.1) | 2.1 ± 0.5 | −(22 ± 1) | 2.5 ± 0.8 |
| 3 C/2 | −CT-CD8a* | Association | 26 ± 1 | −(2.1 ± 0.1) | 1.7 ± 0.4 | −(6.2 ± 0.3) | 4.8 ± 1.4 |
| 3 C/3 | −CT-CD8a* | Association | 18 ± 1 | −(1.7 ± 0.1) | 1.6 ± 0.4 | −(1.1 ± 0.1) | 3.5 ± 1.0 |
The parameters were derived by fitting the measured time courses shown in the following figures to a two-exponential model (Eq. 3) as described in Materials and Methods. Fig. 3 A (traces 1–4) correspond to H-2Kd/pCw3 tetramer association with CTL (clone CAS20). Fig. 3 B (traces 1–4) correspond to H-2Kd/pPbCSABA tetramer association with T1.4 CD8αβ+ hybridoma cells. Fig. 3 B (trace 5) corresponds to H-2Kd/pPbCSABA tetramer association with T1.4 CD8αβ+ hybridoma cells treated by MβCD. Fig. 3 C (traces 1–3) correspond to H-2Kd/pPbCSABA tetramer interaction with CTL (clone CAS20) on different PS days. Further experimental details are presented in the legend to Fig. 3.
The experiments were performed without (−) or with (+) the cells bound to the CD8-specific mAb (CT-CD8a) blocking CD8-pMHC interaction.
Cells treated by MβCD.
TABLE 2.
PE-labeled H-2Kd/pCw3 tetramers binding to the CTL (clone Cas20)
| [(pMHC)4], nM | a0 × 102 | a1 × 102 | k1, s−1 × 10⁻³ | a2 × 102 | k2, s−1 × 10⁻³ |
|---|---|---|---|---|---|
| 25 | 4.0 ± 0.2 | −(2.8 ± 0.2) | 3.9 ± 0.8 | −(1.2 ± 0.2) | 1.1 ± 0.4 |
| 8 | 3.8 ± 0.2 | −(2.8 ± 0.2) | 1.3 ± 0.5 | −(1.0 ± 0.2) | 0.22 ± 0.08 |
The time courses were measured at 24°C on the 6th day after stimulation at indicated tetramer concentrations.
Because FCS measurements resolved heterogeneous diffusion of both TCR and CD8 in the plasma membrane, we examined the possibility that the observed biphasic time course of tetramer binding is related to this heterogeneity. Specifically, the possible localization of CD8 and TCR in distinct plasma membrane domains, e.g., rafts, was tested by measurements of H-2Kd/pPbCSABA tetramer binding time course to the T1.4 CD8αβ+ hybridoma cells after their treatment with MβCD (Fig. 3 B, trace 5). Tetramer binding time course to the treated cells (trace 5, Fig. 3 B and Table 1) was found to be monophasic with a 10-fold slower rate constant than that of the fast binding phase observed in the experiments using untreated cells (trace 1, Fig. 3 B and Table 1). Because cells' treatment with MβCD depletes the membrane's cholesterol, and is assumed thereby to significantly affect the rafts (36), these results lend support to the above notion that the heterogeneity in the binding time courses may be due to CD8 and TCR subpopulations residing in distinct membrane domains.
To examine whether the observed differences in the CD8 and TCR expression levels on the CTL clones affect the ligand binding time courses, tetramer binding to CAS20 cells was measured on different PS days (Fig. 3 C). The total binding amplitude was found to be highest on the 3rd day. This association time course was evaluated as above by the two-exponential model. In this case, both amplitudes were found to be about equal (a1 ≈ a2) (Table 1). Amplitudes of the first step (a1) remained virtually unaltered during the 3–8 day PS period whereas those of the second (a2) decreased to 24% on the 5th day and to 6% on the 8th PS day. The observed changes in the total binding amplitudes (a1 + a2) were thus due to the decline of the second phase amplitude (a2). Therefore, we can conclude that concentration of the fast binding subpopulation of CD8 and TCR was virtually independent on the time elapsed after stimulation whereas that of the slow binding one was dependent.
Tetramer dissociation time courses from both CTL (clone CAS20) and T1.4 CD8αβ+ hybridoma cells were found to be biphasic (traces 3, in Fig. 3, A and B, respectively, and Table 1) when both CD8 and TCR were available for binding. The largest number of the complexes (90% for CTL and 80% for T1.4 CD8αβ+) dissociated with the faster rate constant (k1) and only a small fraction dissociated with the slower one (k2). Only the respective slow phases of dissociation were observed when the cells were preincubated with the CD8-specific mAb (clone CT-CD8a) so that the tetramers could only interact with the cell-surface TCRs (traces 4 in Fig. 3, A and B, and Table 1). Thus, availability of the CD8 coreceptor for tetramer binding increases significantly the total tetramer-cell association and hence also their dissociation amplitudes. However, only ∼10–20% of the tetramers dissociate from the cells with a rate constant similar to that observed when tetramers are exclusively associated through the TCR-pMHC interactions.
DISCUSSION
In this study, we combined measurements of interaction time courses and cell-surface diffusion to try and resolve the mechanism whereby the CD8 coreceptor is involved in the interactions between the pMHC and T cells. The FCS measurements of CD8 and TCR revealed three components in their lateral diffusion. The presence of a component with a very slow diffusion rate is due to the observed initial photobleaching in the FCS experiments. The presence of such an “immobile” fraction can be rationalized by assuming that the cell's membrane is not a continuum of 2D fluid where all molecules can diffuse without any constrains. A more recent model suggests that the membrane is separated into compartments (37), and therefore diffusion of membrane proteins can be restricted within the compartments' borders. If the domains are smaller than the size of the exciting laser beam's waist, diffusion of CD8 and TCR molecules does not produce fluctuations in the fluorescence intensity and therefore they are observed as “immobile” in the FCS experiments. Being continuously exposed to the laser excitation, these molecules exhibit fast irreversible photobleaching, which caused the “drift” of the fluorescence intensity at the beginning of FCS measurements. Similar ‘immobile’ fraction has been observed in fluorescence photobleaching recovery experiments and assigned to the presence of anomalously diffusing particles in small domains of the membrane (38,39). Boundaries of these small domains, restricting the protein mobility, could be formed by, e.g., the actin-based membrane skeleton mesh (40–42). Two “mobile” components were resolved. Their diffusion rate constants were found to be insignificantly different for both CD8 and TCR molecules (e.g., 0.8 ± 0.3 and 0.05 ± 0.03 μm2/s on the T1.4 CD8αβ+ cells). The rate constant of the slow diffusion component can be assigned to the lateral diffusion in the ordered membrane domains. This constant was slower that that reported for TCR diffusion on Jurkat cells (0.12–0.15 μm2/s) (43). The faster component has not been reported earlier and can be assigned to the diffusion in the disordered membrane domains. In both latter cases, CD8 and TCR mobility is apparently not limited by the small size of the membrane skeleton mesh, suggesting that it does not have a uniform structure and some of its domains are larger than the size of the illuminated spot, i.e., >0.2 μm. Results of the FCS measurements of CTB-FITC show that indeed GM1 diffusion in the membrane is very slow, i.e., raft's mobility is very limited. This could be due to their interactions with membrane cytoskeleton (33,44). Thus, we suggest that the “immobile” component corresponding to the diffusion of CD8 and TCR molecules within the “small” rafts and the resolved slower one, corresponding to diffusion of these molecules in rafts of larger size, constitute the same population because both of them are raft resident. Therefore, only two substantially different subpopulations of CD8 and TCR molecules associated with either rafts or disordered membrane are present on the cell surface.
The confocal microscopy data also suggest distribution of both CD8 and CD3 molecules between rafts and disordered membrane microdomains. A partial localization of these molecules within lipid raft domains is consistent with previously published results demonstrating an important role for rafts and cytoskeleton in T-cell response to antigen stimulation (44–50). Independent evidence for the existence of different CD8 and TCR subpopulations can also be derived from the time courses of tetramer association with their specific T cells. In the following, we shall elaborate on the notion that the fast phase of tetramer association is due to tetramer interactions with colocalized CD8 and TCR residing in rafts. The slow association phase, observed in the experiments where both CD8 and TCR were available for the interactions, is apparently due to tetramer binding to noncolocalized TCR and CD8. Our FCS experiments resolved three distinct components in diffusion of CD8 and TCR molecules. We interpret these as reflecting three subpopulations in plasma membrane. Two of these, we assume, correspond to CD8 and TCR molecules residing in rafts of different sizes. Therefore, we classified them as the same subpopulation suggesting similar spatial relationship of CD8 and TCR molecules for both of them. This, of course, does not mean that partitioning of CD8 and TCR molecules into rafts is the only mechanism responsible for their proximity. Recent findings have clearly demonstrated the important role of the cytoskeleton interactions with membrane components in the cell's function (44). Therefore, interactions of both the CD8 and TCR with cytoskeleton may also affect significantly their spatial relationship.
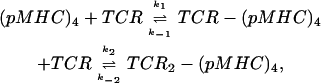
Though tetramer association with T cells is a complex multistep process involving multiple interactions between the tetramer subunits and the surface-resident CD8 and TCR molecules, two general points can be made. At the employed reagent concentrations, association of soluble tetramers with the cells is a sequential process starting with association of one of the tetramer's pMHC subunits with either CD8 or TCR. Moreover, this first step proceeds in three dimensions, whereas all those following it, take place in the two dimensions of the cell's surface. Therefore, unless the CD8 and TCR are colocalized, these following steps have to involve lateral diffusion of these molecules. Several routes of tetramer association with the cells considered below.
pMHC-tetramer association with the TCR
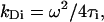
To analyze our data, we first assume that on a T cell with a 5-μm radius, the TCR is present with ∼1 × 10⁴ copies. We also assume that they are distributed randomly on the cell's surface and no CD8 molecules are available when the specific mAb is blocking their access. In this case, tetramer-cell interaction will start with the association of one of the tetramer's pMHC subunits with a TCR. The next step, association of the TCR-(pMHC)4 complex with a second TCR, will usually require lateral diffusion. The mean time τc between tetramer binding to the first TCR and encountering another TCR by diffusion in the membrane can be approximated by the following expression (51):
 |
(4) |
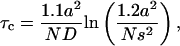
where a is the cell's radius, N is the number of TCR receptors expressed on the cell surface, D is the TCR lateral diffusion rate constant, and s is the distance between two TCRs at which both of them can interact with the same tetramer. Although this distance is an unknown parameter, a simple geometrical consideration suggests that two TCR molecules can simultaneously interact with the same tetramer when they are separated by 4 × 10⁻³–6 × 10⁻³ μm. Because τc dependence on s is less than linear, we have only 8% uncertainty in the calculation of τc by taking s = 5 × 10⁻³ μm. Inserting this value and N = 1 × 10⁴ molecules, a = 5 μm, and D = 1 μm2/s, corresponding to TCR diffusion in the bulk membrane, in Eq. 4, we calculate τc = 0.014 s. However, the production yield of the second interaction with any TCR molecule approaching the distance s is far from unity because of steric constraints; orientation of the reaction partners needs to be adjusted so that their encounter be productive. Therefore, we assume that τc will be longer, at least by a factor 6–10, i.e., 0.08–0.14 s. This means that a TCR, already bound to one tetramer subunit will be at the distance s from another, properly oriented TCR with a frequency of 7–13 s−1. This will then be the frequency of forming a (TCR)2-(pMHC)4. Because this reaction is not diffusion limited and involves significant structural changes in the TCR binding site, which require an activation energy (52), this value of the reaction rate constant is still reduced further by a factor of ∼10−2. Thus, the second association step rate constant k2′ will probably be reduced to ∼0.1 s−1. The first-step rate constant k1′ taken as the product of the pMHC-TCR association rate constant k1 determined in solution (7.0 × 10³ M−1s−1) (29), at the employed tetramer concentration (44 nM), is 3.1 × 10⁻⁴ s−1. The dissociation rate constant k−1 of the recombinant, water-soluble TCR-pMHC complex is ∼0.2 s−1 (29). The overall forward rate constant of the following reversible two-step reaction:
 |
(5) |
can be calculated as:
 |
(6) |
Inserting the values of k1′, k2′, and k−1 in Eq. 6 we calculate kon = 1 × 10⁻⁴ s−1, which agrees with the experimentally observed values (Table 1, experiment 3 B/2).
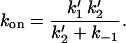
The role of CD8
As no binding of tetramers loaded with a noncognate peptide could be resolved in the flow cytometry binding experiments, at least one TCR interaction should take place upon association of a tetramer carrying a cognate peptide with the cell. When both CD8 and TCR are available for interactions, tetramers may react in the first step of cell association with either the TCR or CD8. However, the CD8-pMHC association rate constant has been determined in solution as ∼1.5 × 10⁵ M−1s−1 (18), i.e., ∼20-fold faster than that determined for the TCR T1–H-2Kd/pPbCSABA association in solution (7.0 × 10³ M−1s−1). Moreover, the CD8 cell-surface expression level is approximately fourfold higher than that of the TCR. Hence, the probability of tetramer's association first with the cells' CD8 is ∼80-fold higher than with the TCR. If ∼4 × 10⁴ copies of CD8 and ∼1 × 10⁴ of TCR molecules are randomly distributed on a T cell, one can calculate in a similar way to that done above, the rate constant of a surface bound tetramer association with an additional CD8 as ∼10 s−1 and with a TCR as ∼0.1 s−1. Thus, the tetramer association with an additional CD8 is by two orders of magnitude faster than with a TCR. Therefore, in the time window that one tetramer interaction with a TCR is formed, two or three interactions with CD8 molecules will take place. (We suggest that the maximal number of contacts of a tetramer with cell-surface expressed CD8 or TCR is three due to the tetramer's tetrahedral geometry). The association rate constant of the first step is a product of the CD8-(pMHC)4 association rate constant (∼1.5 × 10⁵ M−1 s−1) and the employed tetramer concentration (44 nM), namely ∼6.6 × 10⁻³ s−1. (We use the tetramer's concentration instead of the total concentration of the pMHC molecules because in the first step only one out of four tetramer's pMHC molecules can interact with cell-surface CD8). The dissociation rate constant of the pMHC-CD8 complex in solution was found to be ∼20 s−1 (18). Inserting these rate constants of the first and the second steps into the equation for calculating the on-rate constant of the two-step reversible reactions (Eq. 6), we obtain the rate of the (CD8)2-(pMHC)4 complex formation to be ∼2 × 10⁻³ s−1. The dissociation rate of this or (CD8)3-(pMHC)4 complex from the cell are not known, however, we may suggest that they are significantly slower than the dissociation of the CD8-pMHC complex. Our experimental results show that tetramer's interactions with several CD8, in addition to that with the TCR, increase significantly the lifetime of its cell-association. Indeed, the lifetime of the TCR T1-H-2Kd/pPbCSABA complex as measured by the surface plasmon resonance method was found to be 5 s (29), whereas the lifetime of the (CD8)3-TCR-(pMHC)4 (as calculated from the fast phase of tetramer dissociation from the cells) was more that two orders of magnitude longer (630 s). A similar dramatic increase in the lifetime has also been observed for multivalent antigen association with cell-surface antibodies (53). Thus, assuming that the dissociation rate of the (CD8)2-(pMHC)4 complex is twice slower than that of CD8-pMHC, i.e., 10 s−1, the rate of (CD8)3-(pMHC)4 complex formation will be ∼7 × 10⁻⁴ s−1. Further, let us assume that the dissociation rate of (CD8)3-(pMHC)4 is similar to the rate of tetramer association with the cell-surface TCR. Then, the rate of (CD8)n-TCR-(pMHC)4 complexes formation will be about equal to a product of the rates of (CD8)n-(pMHC)4 complexes formation (10−3–10−4 s−1) and the rate of the tetramer association with a TCR on the cell surface (0.1 s−1), i.e., 10−4–10−5 s−1. Thus, assuming a random distribution of CD8 and TCR, the rate for tetramer association with the cells is expected to be significantly slower than that of the experimentally observed fast phase (7.5 × 10⁻³ s−1, experiment 3 B/1, Table 1) and agrees with the rate of the slow phase (2.4 × 10⁻⁴ s−1, experiment 3 B/1, Table 1). These estimates show that if the TCR and CD8 are all randomly distributed on the cell surface, their diffusion limits the overall tetramer-cell association reaction rates. Thus, the observed fast phase can be rationalized by assuming that a subpopulation of proximal CD8 and TCR molecules is present in the cell-surface membrane. A relatively large body of published data (15,28,45,54–58) and this confocal microscopy data suggest that some of the CD8 and TCR molecules are localized in rafts, which explains at least their partial nonrandom distribution on the cell surface. Moreover, evidence for a constitutive association of CD8 and TCR, i.e., colocalization has also been published (59). Therefore, depending on the properties of CD8-TCR associates and/or the raft size, their separation distance may be significantly shorter than that calculated assuming their random distribution.
The above considerations allow the following interpretation of the results of the tetramer-cell interaction measurements. Tetramer-cell association can proceed in several different sequential routes with the first step proceeding in three dimensions, i.e., from solution to the cell surface. Taking this into account and assuming that the first step determines the rate of the overall reaction, its experimentally observed rate is a pseudo-first-order one, i.e., a product of the specific rate constant, k1, and tetramer concentration. Thus, we calculate the value of k1 as (1.7 ± 0.2) × 105 M−1 s−1 at 24°C. This value is found to be essentially the same for both the hybridoma and CTL cells. The close values of these rate constants for the interactions of different cell types expressing distinct TCRs with pMHC tetramers loaded with different peptides suggest that this interaction is not clone specific. Moreover, these rates are close to that reported for the association rate constant of soluble CD8 and pMHC molecules (1–2 × 10⁵ M−1 s−1) (18) yet are much faster than that of soluble H-2Kd/pPbCSABA binding to the T1 TCR (7.0 × 10³ M−1 s−1) at 25°C (29). In addition, the fast phase disappeared when CD8 access was blocked by a specific mAb. All these led us to conclude that the observed fast phase of tetramer association with the cells is primarily due to a binding process starting by (pMHC)4 association with the CD8. It is followed by association of the CD8-(pMHC)4 complex with additional one (or two) CD8 and at least one TCR. As the rate of this first step determines the overall rate of the tetramer binding to the cells, we conclude that the rates of the following steps on the cell surface are faster than the dissociation rate constant of the CD8-(pMHC)4 complex, which is possible only for colocalized CD8 and TCR. Thus, our kinetic data suggest that at least some of the CD8 and TCR molecules are colocalized.
Biphasic tetramer association was also observed with the CTLs. This is similarly interpreted by the presence of essentially two subpopulations of CD8 and TCR molecules on the CTL surface. The amplitudes of the fast tetramer association phase with the CTL were found to be practically independent of the time elapsed after cell stimulation, whereas those of the slow phase decrease significantly at the later PS days. The fast reacting subpopulation of the assumed colocalized CD8 and TCR molecules remains constant and the subpopulation reacting in the slow phase, decreased on the late PS days. As the significant reduction in the CD8 and TCR expression levels of the slow binding subpopulation did not decrease the cells' cytotoxicity, we suggest that only these molecules reacting in the fast phase lead to T-cell activation. Thus T cells with similar expression levels of TCR and CD8, may exhibit significantly different cytotoxic capacity, which depends on their spatial relationship on the cell's membrane.
The rate of tetramer association with the MβCD treated cells was found to be ∼10-fold slower than that of the fast binding phase when both CD8 and TCR are available for the interactions on untreated cells. This implies that MβCD treatment changes the CD8 and TCR spatial relationship. However, this rate is still faster than that of tetramer association with the cells when the CD8-pMHC interaction was blocked. This suggests that even on the MβCD treated cells, CD8 molecules are involved in the initial step of tetramer association and certain proximity between TCR and CD8 is maintained.
The fact that no binding of H-2Kd tetramers loaded with the noncognate peptide (pPbCSABA) was observed to the CTLs is contrasted by several examples of reported “nonspecific” multimer binding to T cells (60). Our model suggests that the CD8-pMHC interaction can significantly promote binding of low affinity ligands. Therefore, the CD8-TCR cooperation combined with the TCR binding site's remarkable plasticity is probably the cause for the cross-reactivity of T cells. We suppose that in this case, binding of H-2Kd/pPbCSABA tetramers to the CAS20 CTLs was not observed because of a rather low affinity of H-2Kd/pPbCSABA for the TCR of Cas20 cells.
Dissociation rate of the surface-associated (pMHC)4 depends on the number of pMHC-TCR and pMHC-CD8 interactions produced. Due to the avidity of this interaction, binding can reach the saturation level in the nanomolar tetramer concentration range. Indeed, at 107 cell/ml and 104 TCRs expressed on one cell, the total number of TCRs in 1 ml reaches 1011, which corresponds to a concentration of ∼0.2 nM. Thus, one can expect that all TCRs will be bound at tetramer concentration as high as ∼10 nM. When saturating tetramer concentrations are employed, one can expect a competition for the TCR binding sites. As a result, a distribution of the number of pMHC-TCR contacts per tetramer is expected, which should manifest itself as a multiphasic dissociation time course. This conclusion is consistent with the biphasic tetramer dissociation observed in the experiments where both CD8 and TCR were available for the interactions. These phases are therefore assigned to dissociation of tetramer-cell complexes having several CD8 interactions and differing in the number of pMHC-TCR interactions: one for the faster dissociation phase and two or three for the slower ones. In experiments, where CD8 were blocked and only the TCRs interacted with the tetramers, only a single dissociation phase has been observed with a rate close to that of the slow phase in the experiments where both CD8 and TCR were available for interaction. In this case, only tetramers interacting with at least two TCRs were probably monitored due to the limited temporal resolution of the employed experimental protocol.
In summary, we propose that the most efficient route of the ligand binding starts with CD8-pMHC interaction. This is followed by association of the CD8-pMHC complex with the TCR. Thus, the role of CD8 in this process is accelerating the pMHC-cell association by increasing the probability of this ligand's encounters with the TCR. This mechanism would universally operate in the binding irrespective of the TCR affinity for a given pMHC. However, it would be of special importance for low affinity interactions because the TCR-ligand binding has been shown to be a relatively slow process because of the significant conformational transitions induced in the TCR binding site.
SUPPLEMENTARY MATERIAL
An online supplement to this article can be found by visiting BJ Online at http://www.bipophysj.org.
Supplementary Material
Acknowledgments
We thank S. Milon for her devoted help with the FCS measurements and A. Licht for the excellent technical assistance. The support and advice extended by K. Kärre and M. Elbaum are deeply appreciated. We also thank Carl Zeiss, Jena for putting a ConfoCor2/LSM system at our disposal. The authors express their deep gratitude to R. Zidovetzki and S. Wherland for many helpful discussions.
These studies were supported by grants from the Minerva Foundation, Munich, Germany and from the European Community (project EPI-PEP-VAC QLK2-2002-00620) to I.P. and by a Federation of European Biochemical Societies short-term fellowship (D.M.G.).
Abbreviations used: TCR, T-cell receptor; APC, antigen presenting cells; MHC, major histocompatibility complex; pMHC, peptide-MHC complex; PbCS(ABA), an azido-benzoic acid (ABA) derivative of the peptide SYIPSAEK(ABA)I; pCw3, peptide derived from HLA-Cw3; FCS, fluorescence correlation spectroscopy; MβCD, methyl-β-cyclodextrin; PS days, poststimulation days; MFI, mean fluorescence intensity; FITC, fluorescein isothiocyanate; FITC-CTB, FITC-labeled cholera toxin B subunit.
References
- 1.Davis, M. M., J. J. Boniface, Z. Reich, D. Lyons, J. Hampl, B. Arden, and Y. Chien. 1998. Ligand recognition by alpha beta T cell receptors. Annu. Rev. Immunol. 16:523–544. [DOI] [PubMed] [Google Scholar]
- 2.Germain, R. N., and I. Stefanova. 1999. The dynamics of T cell receptor signaling: complex orchestration and the key roles of tempo and cooperation. Annu. Rev. Immunol. 17:467–522. [DOI] [PubMed] [Google Scholar]
- 3.van der Merwe, P. A., and S. J. Davis. 2003. Molecular interactions mediating T cell antigen recognition. Annu. Rev. Immunol. 21:659–684. [DOI] [PubMed] [Google Scholar]
- 4.Sykulev, Y., A. Brunmark, M. Jackson, R. J. Cohen, P. A. Peterson, and H. N. Eisen. 1994. Kinetics and affinity of reactions between an antigen-specific T cell receptor and peptide-MHC complexes. Immunity. 1:15–22. [DOI] [PubMed] [Google Scholar]
- 5.Dutoit, V., P. Guillaume, M. Ayyoub, C. S. Hesdorffer, I. F. Luescher, and D. Valmori. 2003. Decreased binding of peptides-MHC class I (pMHC) multimeric complexes to CD8 affects their binding avidity for the TCR but does not significantly impact on pMHC/TCR dissociation rate. J. Immunol. 170:5110–5117. [DOI] [PubMed] [Google Scholar]
- 6.Zamoyska, R. 1998. CD4 and CD8: modulators of T-cell receptor recognition of antigen and of immune responses? Curr. Opin. Immunol. 10:82–87. [DOI] [PubMed] [Google Scholar]
- 7.Potter, T. A., K. Grebe, B. Freiberg, and A. Kupfer. 2001. Formation of supramolecular activation clusters on fresh ex vivo CD8+ T cells after engagement of the T cell antigen receptor and CD8 by antigen-presenting cells. Proc. Natl. Acad. Sci. USA. 98:12624–12629. [DOI] [PMC free article] [PubMed] [Google Scholar]
- 8.Konig, R. 2002. Interactions between MHC molecules and co-receptors of the TCR. Curr. Opin. Immunol. 14:75–83. [DOI] [PubMed] [Google Scholar]
- 9.Gao, G. F., Z. Rao, and J. I. Bell. 2002. Molecular coordination of alphabeta T-cell receptors and coreceptors CD8 and CD4 in their recognition of peptide-MHC ligands. Trends Immunol. 23:408–413. [DOI] [PubMed] [Google Scholar]
- 10.Rudolph, M. G., and I. A. Wilson. 2002. The specificity of TCR/pMHC interaction. Curr. Opin. Immunol. 14:52–65. [DOI] [PubMed] [Google Scholar]
- 11.Garcia, K. C., L. Teyton, and I. A. Wilson. 1999. Structural basis of T cell recognition. Annu. Rev. Immunol. 17:369–397. [DOI] [PubMed] [Google Scholar]
- 12.Gao, G. F., J. Tormo, U. C. Gerth, J. R. Wyer, A. J. McMichael, D. I. Stuart, J. I. Bell, E. Y. Jones, and B. K. Jakobsen. 1997. Crystal structure of the complex between human CD8alpha(alpha) and HLA-A2. Nature. 387:630–634. [DOI] [PubMed] [Google Scholar]
- 13.Jones, E. Y., J. Tormo, S. W. Reid, and D. I. Stuart. 1998. Recognition surfaces of MHC class I. Immunol. Rev. 163:121–128. [DOI] [PubMed] [Google Scholar]
- 14.Denkberg, G., C. J. Cohen, and Y. Reiter. 2001. Critical role for CD8 in binding of MHC tetramers to TCR: CD8 antibodies block specific binding of human tumor-specific MHC-peptide tetramers to TCR. J. Immunol. 167:270–276. [DOI] [PubMed] [Google Scholar]
- 15.Doucey, M. A., D. F. Legler, N. Boucheron, J. C. Cerottini, C. Bron, and I. F. Luescher. 2001. CTL activation is induced by cross-linking of TCR/MHC-peptide-CD8/p56lck adducts in rafts. Eur. J. Immunol. 31:1561–1570. [DOI] [PubMed] [Google Scholar]
- 16.Luescher, I. F., E. Vivier, A. Layer, J. Mahiou, F. Godeau, B. Malissen, and P. Romero. 1995. CD8 modulation of T-cell antigen receptor-ligand interactions on living cytotoxic T lymphocytes. Nature. 373:353–356. [DOI] [PubMed] [Google Scholar]
- 17.Campanelli, R., B. Palermo, S. Garbelli, S. Mantovani, P. Lucchi, A. Necker, E. Lantelme, and C. Giachino. 2002. Human CD8 co-receptor is strictly involved in MHC-peptide tetramer-TCR binding and T cell activation. Int. Immunol. 14:39–44. [DOI] [PubMed] [Google Scholar]
- 18.Wyer, J. R., B. E. Willcox, G. F. Gao, U. C. Gerth, S. J. Davis, J. I. Bell, P. A. van der Merwe, and B. K. Jakobsen. 1999. T cell receptor and coreceptor CD8 alphaalpha bind peptide-MHC independently and with distinct kinetics. Immunity. 10:219–225. [DOI] [PubMed] [Google Scholar]
- 19.Guillaume, P., D. F. Legler, N. Boucheron, M. A. Doucey, J. C. Cerottini, and I. F. Luescher. 2003. Soluble major histocompatibility complex-peptide octamers with impaired CD8 binding selectively induce Fas-dependent apoptosis. J. Biol. Chem. 278:4500–4509. [DOI] [PubMed] [Google Scholar]
- 20.Cochran, J. R., T. O. Cameron, and L. J. Stern. 2000. The relationship of MHC-peptide binding and T cell activation probed using chemically defined MHC class II oligomers. Immunity. 12:241–250. [DOI] [PubMed] [Google Scholar]
- 21.Fremont, D. H., W. A. Rees, and H. Kozono. 1996. Biophysical studies of T-cell receptors and their ligands. Curr. Opin. Immunol. 8:93–100. [DOI] [PubMed] [Google Scholar]
- 22.Gao, G. F., and B. K. Jakobsen. 2000. Molecular interactions of coreceptor CD8 and MHC class I: the molecular basis for functional coordination with the T-cell receptor. Immunol. Today. 21:630–636. [DOI] [PubMed] [Google Scholar]
- 23.Rigler, R., A. Pramanik, P. Jonasson, G. Kratz, O. T. Jansson, P. Nygren, S. Stahl, K. Ekberg, B. Johansson, S. Uhlen, M. Uhlen, H. Jornvall, and J. Wahren. 1999. Specific binding of proinsulin C-peptide to human cell membranes. Proc. Natl. Acad. Sci. USA. 96:13318–13323. [DOI] [PMC free article] [PubMed] [Google Scholar]
- 24.Brock, R., M. A. Hink, and T. M. Jovin. 1998. Fluorescence correlation microscopy of cells in the presence of autofluorescence. Biophys. J. 75:2547–2557. [DOI] [PMC free article] [PubMed] [Google Scholar]
- 25.Brock, R., and T. M. Jovin. 1998. Fluorescence correlation microscopy (FCM)-fluorescence correlation spectroscopy (FCS) taken into the cell. Cell Mol. Biol. (Noisy. -le-grand) 44:847–856. [PubMed] [Google Scholar]
- 26.Rigler, R., and E. S. Elson. 2001. Fluorescence Correlation Spectroscopy: Theory and Applications. Springer-Verlag, New York, NY.
- 27.Altman, J. D., P. A. Moss, P. J. Goulder, D. H. Barouch, M. G. McHeyzer-Williams, J. I. Bell, A. J. McMichael, and M. M. Davis. 1996. Phenotypic analysis of antigen-specific T lymphocytes. Science. 274:94–96. [DOI] [PubMed] [Google Scholar]
- 28.Arcaro, A., C. Gregoire, T. R. Bakker, L. Baldi, M. Jordan, L. Goffin, N. Boucheron, F. Wurm, P. A. van der Merwe, B. Malissen, and I. F. Luescher. 2001. CD8beta endows CD8 with efficient coreceptor function by coupling T cell receptor/CD3 to raft-associated CD8/p56(lck) complexes. J. Exp. Med. 194:1485–1495. [DOI] [PMC free article] [PubMed] [Google Scholar]
- 29.Gakamsky, D. M., I. F. Luescher, and I. Pecht. 2004. T cell receptor-ligand interactions: a conformational preequilibrium or an induced fit. Proc. Natl. Acad. Sci. USA. 101:9063–9066. [DOI] [PMC free article] [PubMed] [Google Scholar]
- 30.Casanova, J. L., J. C. Cerottini, M. Matthes, A. Necker, H. Gournier, C. Barra, C. Widmann, H. R. MacDonald, F. Lemonnier, and B. Malissen. 1992. H-2-restricted cytolytic T lymphocytes specific for HLA display T cell receptors of limited diversity. J. Exp. Med. 176:439–447. [DOI] [PMC free article] [PubMed] [Google Scholar]
- 31.Rousseaux, J., R. Rousseaux-Prevost, and H. Bazin. 1983. Optimal conditions for the preparation of Fab and F(ab′)2 fragments from monoclonal IgG of different rat IgG subclasses. J. Immunol. Methods. 64:141–146. [DOI] [PubMed] [Google Scholar]
- 32.Romero, P., J. L. Maryanski, and I. F. Luescher. 1993. Photoaffinity labeling of the T cell receptor on living cytotoxic T lymphocytes. J. Immunol. 150:3825–3831. [PubMed] [Google Scholar]
- 33.Bacia, K., D. Scherfeld, N. Kahya, and P. Schwille. 2004. Fluorescence correlation spectroscopy relates rafts in model and native membranes. Biophys. J. 87:1034–1043. [DOI] [PMC free article] [PubMed] [Google Scholar]
- 34.Skinner, P. J., M. A. Daniels, C. S. Schmidt, S. C. Jameson, and A. T. Haase. 2000. Cutting edge: in situ tetramer staining of antigen-specific T cells in tissues. J. Immunol. 165:613–617. [DOI] [PubMed] [Google Scholar]
- 35.Devine, L., M. E. Hodsdon, M. A. Daniels, S. C. Jameson, and P. B. Kavathas. 2004. Location of the epitope for an anti-CD8[alpha] antibody 53.6.7 which enhances CD8[alpha]-MHC class I interaction indicates antibody stabilization of a higher affinity CD8 conformation. Immunol. Lett. 93:123–130. [DOI] [PubMed] [Google Scholar]
- 36.Kabouridis, P. S., J. Janzen, A. L. Magee, and S. C. Ley. 2000. Cholesterol depletion disrupts lipid rafts and modulates the activity of multiple signaling pathways in T lymphocytes. Eur. J. Immunol. 30:954–963. [DOI] [PubMed] [Google Scholar]
- 37.Kusumi, A., H. Ike, C. Nakada, K. Murase, and T. Fujiwara. 2005. Single-molecule tracking of membrane molecules: plasma membrane compartmentalization and dynamic assembly of raft-philic signaling molecules. Semin. Immunol. 17:3–21. [DOI] [PubMed] [Google Scholar]
- 38.Feder, T. J., I. Brust-Mascher, J. P. Slattery, B. Baird, and W. W. Webb. 1996. Constrained diffusion or immobile fraction on cell surfaces: a new interpretation. Biophys. J. 70:2767–2773. [DOI] [PMC free article] [PubMed] [Google Scholar]
- 39.Edidin, M. 1997. Lipid microdomains in cell surface membranes. Curr. Opin. Struct. Biol. 7:528–532. [DOI] [PubMed] [Google Scholar]
- 40.Edidin, M. 2001. Shrinking patches and slippery rafts: scales of domains in the plasma membrane. Trends Cell Biol. 11:492–496. [DOI] [PubMed] [Google Scholar]
- 41.Capps, G. G., S. Pine, M. Edidin, and M. C. Zuniga. 2004. Short class I major histocompatibility complex cytoplasmic tails differing in charge detect arbiters of lateral diffusion in the plasma membrane. Biophys. J. 86:2896–2909. [DOI] [PMC free article] [PubMed] [Google Scholar]
- 42.Murase, K., T. Fujiwara, Y. Umemura, K. Suzuki, R. Iino, H. Yamashita, M. Saito, H. Murakoshi, K. Ritchie, and A. Kusumi. 2004. Ultrafine membrane compartments for molecular diffusion as revealed by single molecule techniques. Biophys. J. 86:4075–4093. [DOI] [PMC free article] [PubMed] [Google Scholar]
- 43.Favier, B., N. J. Burroughs, L. Wedderburn, and S. Valitutti. 2001. TCR dynamics on the surface of living T cells. Int. Immunol. 13:1525–1532. [DOI] [PubMed] [Google Scholar]
- 44.Kwik, J., S. Boyle, D. Fooksman, L. Margolis, M. P. Sheetz, and M. Edidin. 2003. Membrane cholesterol, lateral mobility, and the phosphatidylinositol 4,5-bisphosphate-dependent organization of cell actin. Proc. Natl. Acad. Sci. USA. 100:13964–13969. [DOI] [PMC free article] [PubMed] [Google Scholar]
- 45.Drevot, P., C. Langlet, X. J. Guo, A. M. Bernard, O. Colard, J. P. Chauvin, R. Lasserre, and H. T. He. 2002. TCR signal initiation machinery is pre-assembled and activated in a subset of membrane rafts. EMBO J. 21:1899–1908. [DOI] [PMC free article] [PubMed] [Google Scholar]
- 46.Bi, K., and A. Altman. 2001. Membrane lipid microdomains and the role of PKCtheta in T cell activation. Semin. Immunol. 13:139–146. [DOI] [PubMed] [Google Scholar]
- 47.Arcaro, A., C. Gregoire, N. Boucheron, S. Stotz, E. Palmer, B. Malissen, and I. F. Luescher. 2000. Essential role of CD8 palmitoylation in CD8 coreceptor function. J. Immunol. 165:2068–2076. [DOI] [PubMed] [Google Scholar]
- 48.Janes, P. W., S. C. Ley, A. I. Magee, and P. S. Kabouridis. 2000. The role of lipid rafts in T cell antigen receptor (TCR) signalling. Semin. Immunol. 12:23–34. [DOI] [PubMed] [Google Scholar]
- 49.Xavier, R., T. Brennan, Q. Li, C. McCormack, and B. Seed. 1998. Membrane compartmentation is required for efficient T cell activation. Immunity. 8:723–732. [DOI] [PubMed] [Google Scholar]
- 50.Thomas, S., R. S. Kumar, S. Casares, and T.-D. Brumeanu. 2003. Sensitive detection of GM1 lipid rafts and TCR partitioning in the T cell membrane. J. Immunol. Methods. 275:161–168. [DOI] [PubMed] [Google Scholar]
- 51.Berg, H. C., and E. M. Purcell. 1977. Physics of chemoreception. Biophys. J. 20:193–219. [DOI] [PMC free article] [PubMed] [Google Scholar]
- 52.Reiser, J. B., C. Darnault, C. Gregoire, T. Mosser, G. Mazza, A. Kearney, P. A. van der Merwe, J. C. Fontecilla-Camps, D. Housset, and B. Malissen. 2003. CDR3 loop flexibility contributes to the degeneracy of TCR recognition. Nat. Immunol. 4:241–247. [DOI] [PubMed] [Google Scholar]
- 53.Goldstein, B., and C. Wofsy. 1996. Why is it so hard to dissociate multivalent antigens from cell-surface antibodies? Immunol. Today. 17:77–80. [DOI] [PubMed] [Google Scholar]
- 54.Drake III, D. R., and T. J. Braciale. 2001. Cutting edge: lipid raft integrity affects the efficiency of MHC class I tetramer binding and cell surface TCR arrangement on CD8+ T cells. J. Immunol. 166:7009–7013. [DOI] [PubMed] [Google Scholar]
- 55.Wooldridge, L., S. L. Hutchinson, E. M. Choi, A. Lissina, E. Jones, F. Mirza, P. R. Dunbar, D. A. Price, V. Cerundolo, and A. K. Sewell. 2003. Anti-CD8 antibodies can inhibit or enhance peptide-MHC Class I (pMHCI) multimer binding: this is paralleled by their effects on CTL activation and occurs in the absence of an interaction between pMHCI and CD8 on the cell surface. J. Immunol. 171:6650–6660. [DOI] [PubMed] [Google Scholar]
- 56.Magee, T., N. Pirinen, J. Adler, S. N. Pagakis, and I. Parmryd. 2002. Lipid rafts: cell surface platforms for T cell signaling. Biol. Res. 35:127–131. [DOI] [PubMed] [Google Scholar]
- 57.Giurisato, E., D. P. McIntosh, M. Tassi, A. Gamberucci, and A. Benedetti. 2003. T cell receptor can be recruited to a subset of plasma membrane rafts, independently of cell signaling and attendantly to raft clustering. J. Biol. Chem. 278:6771–6778. [DOI] [PubMed] [Google Scholar]
- 58.Kersh, E. N., S. M. Kaech, T. M. Onami, M. Moran, E. J. Wherry, M. C. Miceli, and R. Ahmed. 2003. TCR signal transduction in antigen-specific memory CD8 T cells. J. Immunol. 170:5455–5463. [DOI] [PubMed] [Google Scholar]
- 59.Doucey, M. A., L. Goffin, D. Naeher, O. Michielin, P. Baumgartner, P. Guillaume, E. Palmer, and I. F. Luescher. 2002. CD3delta establishes a functional link between the T cell receptor and CD8. J. Biol. Chem. 278:3257–3264. [DOI] [PubMed] [Google Scholar]
- 60.Bodinier, M., M. A. Peyrat, C. Tournay, F. Davodeau, F. Romagne, M. Bonneville, and F. Lang. 2000. Efficient detection and immunomagnetic sorting of specific T cells using multimers of MHC class I and peptide with reduced CD8 binding. Nat. Med. 6:707–710. [DOI] [PubMed] [Google Scholar]
Associated Data
This section collects any data citations, data availability statements, or supplementary materials included in this article.