Abstract
We study the electronic properties of DNA by way of a tight-binding model applied to four particular DNA sequences. The charge transfer properties are presented in terms of localization lengths (crudely speaking, the length over which electrons travel). Various types of disorder, including random potentials, are employed to account for different real environments. We have performed calculations on poly(dG)-poly(dC), telomeric-DNA, random-ATGC DNA, and λ-DNA. We find that random and λ-DNA have localization lengths allowing for electron motion among a few dozen basepairs only. A novel enhancement of localization lengths is observed at particular energies for an increasing binary backbone disorder. We comment on the possible biological relevance of sequence-dependent charge transfer in DNA.
INTRODUCTION
The question of whether DNA conducts electric charges is intriguing to physicists and biologists alike. The suggestion that electron transfer/transport in DNA might be biologically important has triggered a series of experimental and theoretical investigations (1–6). Processes that possibly use electron transfer include the function of DNA damage response enzymes, transcription factors, or polymerase co-factors, all of which play important roles in the cell (7). Indeed, there is direct evidence (8) that MutY—a DNA base excision repair enzyme with an (4Fe4S)+ cluster of undetermined function—takes part in some kind of electron transfer as part of the DNA repair process (9,10). This seems consistent with studies in which an electric current is passed through DNA, revealing that damaged regions have significantly different electronic behavior than healthy regions (8).
For physicists, the continuing progress of nanotechnologies and the consequent need for further size miniaturization makes the DNA molecule an excellent candidate for molecular electronics (11–14). DNA might serve as a wire, transistor, switch, or rectifier, depending on its electronic properties (3,15,16).
In its natural environment, DNA is always in liquid solution, and therefore, experimentally, one can study the molecule either in solution or in artificially imposed dry environments. In solution experiments, DNA is chemically processed to host a donor and an acceptor molecule at different sites along its long axis. Photo-induced charge transfer rates can then be measured while the donor/acceptor molecules, the distance and the sequence of DNA that lies between them, are varied. The reactions are observed to depend on the type of DNA used, the intercalation, the integrity of the intervening basepair stack, and, albeit weakly, on the molecular distance (1,2,5,8,17).
Direct conductivity measurements on dry DNA have also been preformed in the past few years. The remarkable diversity that characterizes the results seems to arise from the fact that many factors need to be experimentally controlled. These include methods for DNA alignment and drying, the nature of the devices used to measure the conductivity, the type of metallic contacts, and the sequence and length of the DNA. DNA has been reported to be an insulator (18,19), an Ohmic conductor (14,20–23), and a semiconductor (24). Theoretically, single-step super exchange (4) and multi-step hopping (25) models have provided interpretations of solution experiments. For experiments in dry DNA, several additional approaches such as variable range hopping (26), one-dimensional quantum mechanical tight-binding models (12,27–31), and nonlinear methods (32,33) have also been proposed.
Despite the lack of a consistent picture for the electronic properties of DNA, one conclusion has been established: the environment of the DNA impacts upon its structural, chemical, and thus, probably also electronic properties. Both theoretical and experimental studies show that the temperature and the type of solution surrounding DNA have a significant effect on its structure and shape (26,34,35). The effect of the environment is a key one to this report, where the environmental fluctuations are explicitly modeled as providing different types of disorder.
In this work, we focus on whether DNA, when treated as a quantum wire in the fully coherent low-temperature regime, is conducting or not. To this end, we study and generalize a tight-binding model of DNA, which has been shown to reproduce experimental (12) as well as ab initio results (36). A main feature of the model is the presence of sites which represent the sugar-phosphate backbone of DNA but along which no electron transport is permissible. We measure the strength of the electronic transport by the localization length ξ, which, roughly speaking, parameterizes whether an electron is confined to a certain region ξ of the DNA (insulating behavior) or can proceed across the full length L (≤ ξ) of the DNA molecule (metallic behavior).
The next two sections (Tight-Binding Models for DNA with a Gap in the Spectrum, and The Numerical Approach and Localization) introduce our models and the numerical approach. In DNA Sequences, we show that DNA sequences with different arrangements of nucleotide bases Adenine (A), Cytosine (C), Guanine (G), and Thymine (T), exhibit different ξ values when measured, e.g., as a function of the Fermi energy E. We next turn our attention to the spatially-varying localization properties of these sequences by a “sliding window” analysis in Results for clean DNA. Results for Disordered DNA show the influence of external disorder, i.e., modeling variants in the solution, bending of the DNA molecule, finite-temperature effects, etc., where we show that, surprisingly, the models support an increase of ξ when disorder is increased. We explain that this effect is linked to the existence of the backbone sites.
TIGHT-BINDING MODELS FOR DNA WITH A GAP IN THE SPECTRUM
The fishbone model
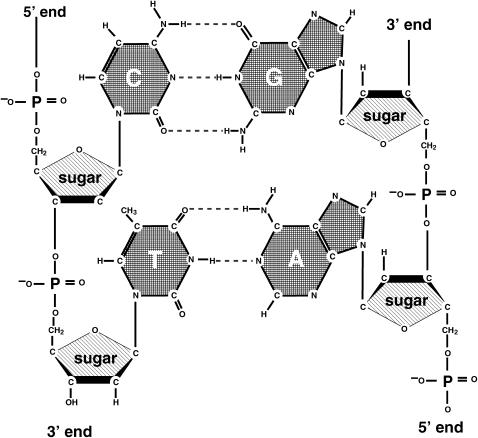
DNA is a macro-molecule consisting of repeated stacks of bases formed by either AT (TA) or GC (CG) pairs coupled via hydrogen bonds and held in the double-helix structure by a sugar-phosphate backbone. In Fig. 1, we show a schematic drawing. In most models of electronic transport (12,37), it has been assumed—following the pioneering work reported in Bakshi et al. (38) and Ladik et al. (39)—that the transmission channels are along the long axis of the DNA molecule (we note that Walet and Zakrzewski (40) assume transport is via the sugar-phosphate backbone), and that the conduction path is due to π-orbital overlap between consecutive bases (17); density-functional calculations (41) have shown that the bases, especially Guanine, are rich in π-orbitals. Quantum mechanical approaches to the problem mostly use strictly one-dimensional tight-binding models (27–31).
FIGURE 1.
The chemical composition of DNA with the four bases Adenine, Thymine, Cytosine, Guanine and the backbone. The backbone is made of phosphorylated sugars.
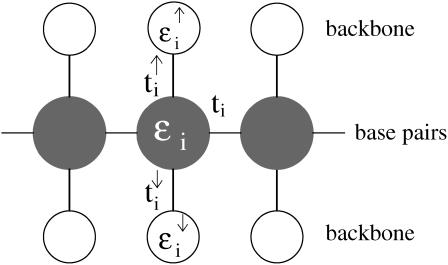
Of particular interest to us is a quasi-one-dimensional model (12) that includes the backbone structure of DNA explicitly and exhibits a semiconducting gap. This fishbone model, shown in Fig. 2, has one central conduction channel in which individual sites represent a basepair; these are interconnected and further linked to upper and lower sites, representing the backbone, but are not interconnected along the backbone. Every link between sites implies the presence of a hopping amplitude. The Hamiltonian for the fishbone model (HF) is given by
 |
(1) |
where ti is the hopping between nearest-neighbor sites i, i + 1 along the central branch, and  with q = ↑, ↓ gives the hopping from each site on the central branch to the upper and lower backbone, respectively. Additionally, we denote the on-site energy at each site along the central branch by ɛi and the on-site energy at the sites of the upper and lower backbone is given by
  , with q = ↑ ↓. L is the number of sites/bases in the sequence. The model (Eq. 1) clearly represents a dramatic simplification of DNA. Nevertheless, in Cuniberti et al. (12) it had been shown that this model, when applied to an artificial sequence of repeated GC basepairs, poly(dG)-poly(dC) DNA, reproduces experimental data current-voltage measurements when ti = 0.37eV and
  are being used. Therefore, we will assume
  and set the energy scale by ti ≡ 1 for hopping between GC pairs. Furthermore, since the energetic differences in the adiabatic electron affinities of the bases are small (42), we choose ɛi = 0 for all i.
FIGURE 2.
The fishbone model for electronic transport along DNA corresponding to the Hamiltonian given in Eq. 1. Lines denote hopping amplitudes and circles give the central (shaded) and backbone (open) sites.
For natural DNA sequences, we need to know how the hopping amplitudes vary as the electron moves between like pairs, i.e., from GC to GC or from AT to AT, and unlike pairs, i.e., from GC to AT and vice versa. We choose ti = 1 between identical and matching bases (e.g., AT/TA, GC/CG). Assuming that the wavefunction overlap between consecutive bases along the DNA strand is weaker between unlike and nonmatching bases (AT/GC, TA/GC, etc.), we thus choose 1/2.
The ladder model
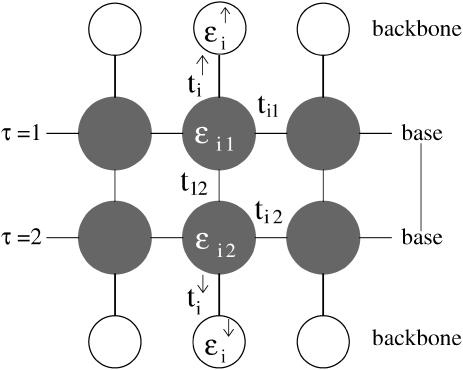
We performed semi-empirical calculations on DNA basepairs and stacks using the SPARTAN quantum chemistry software package (43). The results have shown that the relevant electronic states of DNA (highest-occupied and lowest-unoccupied molecular orbitals with and without an additional electron) are localized on one of the bases of a pair only. The reduction of the DNA basepair architecture into a single site per pair, as in the fishbone model (Eq. 1), is obviously a highly simplified approach. As an improvement on this, we model each base as a distinct site where the basepair is then weakly coupled by the hydrogen bonds. The resulting two-channel model is shown in Fig. 3. This ladder model is a planar projection of the structure of the DNA with its double-helix unwound. We note that results for electron transfer also suggest that the transfer proceeds preferentially down one strand (44). There are two central branches, linked with one another, with interconnected sites where each represents a complete base and which are additionally linked to the upper and lower backbone sites. The backbone sites as in the fishbone model are not interconnected. The Hamiltonian for the ladder model is given by
 |
(2) |
where ti,τ is the hopping amplitude between sites along each branch τ = 1, 2, and ɛi, τ is the corresponding on-site potential energy. The values  and
and  , as before, give hopping amplitudes and on-site energies at the backbone sites. Also, q(τ) = ↑, ↓ for τ = 1, 2, respectively. The new parameter t12 represents the hopping between the two central branches, i.e., perpendicular to the direction of conduction. SPARTAN results suggest that this value—dominated by the wave function and overlapping across the hydrogen bonds—is weak, and so we choose t12 = 1/10. As before, we also set ɛi,τ = 0 for all i and τ.
FIGURE 3.
The ladder model for electronic transport along DNA. The model corresponds to the Hamiltonian given in Eq. 2.
Including disorder
To study the transport properties of DNA, we could now use artificial DNA (poly(dG)-poly(dC) (24), or random sequences of A,T,G,C (45,46), etc.), or natural DNA (bacteriophage λ-DNA (41), etc.). The biological content of the sequence would then simply be encoded in a specific sequence of hopping amplitudes 1 and 1/2 between like and unlike basepair sequences. However, for in vivo and most experimental situations, DNA is exposed to diverse environments, and its properties, particularly those related to its conformation, can change drastically depending on the specific choice. The solution, thermal effects, presence of binding, packaging proteins, and the available space are factors that alter the structure, and are, therefore, the properties that one is measuring (26,34,47). Clearly, such dramatic changes should also be reflected in the electronic transport characteristics. Since it is precisely the backbone that will be most susceptible to such influences, we model environmental fluctuations by including variations in the on-site potentials ɛi,q.
Different experimental situations will result in a different modification of the backbone electronic structure, and we model this by choosing different distribution functions for the on-site potentials, ranging from uniform disorder ɛi,q ∈ (−W/2, W/2), to Gaussian disorder and on to binary disorder ɛi,q = ±W/2. W is a measure for the strength of the disorder in all cases. Particularly the binary disorder model can be justified by the localization of ions or other solutes at random positions along the DNA strand (34).
Effective models and the energy gap
Due to the nonconnectedness of the backbone sites along the DNA strands, the models from Eqs. 1 and 2 can be further simplified to yield models in which the backbone sites are incorporated into the electronic structure of the DNA. The effective fishbone model is then given by
 |
(3) |
Similarly, the effective ladder model reads as
 |
(4) |
In these two models, the backbone has been incorporated into an energy-dependent on-site potential on the main DNA sites. This reemphasizes that the presence of the backbone influences the local electronic structure on the DNA bases and similarly, any variation in the backbone disorder potentials  will result in a variation of effective on-site potentials, as given in the brackets of Eqs. 3 and 4.
Both models allow us to quickly calculate the gap of the completely ordered system (all on-site potentials zero) by assuming that the lowest-energy state  in each band corresponds to constant ψi (ψi, τ), whereas for the highest-energy states, a checkerboard pattern is obtained with ψi = ψi+1 (ψi, τ = − ψi+1, τ, ψi, 1 = − ψi, 2). For the fishbone model, this shows that, e.g.,
  and
and  For the chosen set of hopping parameters for Eqs. 3 and 4, this gives
  and
and  for the fishbone model and
  and
and  for the ladder model.
THE NUMERICAL APPROACH AND LOCALIZATION
There are several approaches suitable for studying the transport properties of the models from Eqs. 1 and 2, and these can be found in the literature on transport in solid-state devices, or, perhaps more appropriately, quantum wires. Since the variation in the sequence of basepairs precludes a general solution, we will use two methods well known from the theory of disordered systems (48).
The first method is the iterative transfer-matrix method (TMM) (49–53), which allows us, in principle, to determine the localization length ξ of electronic states in systems with cross sections M = 1 (fishbone) and 2 (ladder) and length L ≫ M, where typically a few million sites are needed for L to achieve reasonable accuracy for ξ. However, in this situation we are interested in finding ξ also for viral DNA strands of typically only a few ten thousand basepair long sequences. Thus, to restore the required precision, we have modified the conventional TMM and now perform the TMM on a system of fixed length L0. This modification has been previously used (54–56) and may be summarized as follows: After the usual forward calculation with a global transfer matrix  we add a backward calculation with transfer matrix
  This forward-backward-multiplication procedure is repeated K times. The effective total number of TMM multiplications is L = 2KL0 and the global transfer-matrix is
  It can be diagonalized as for the standard TMM with K → ∞ to give
  with τ = 1 or τ = 1, 2 for fishbone and ladder models, respectively. The largest ξτ∀τ then corresponds to the localization lengths of the electron on the DNA strand and will be measured in units of the DNA basepair spacing (0.34 nm).
The second method that we will use is the recursive Green function approach pioneered by MacKinnon (57,58). It can be used to calculate the DC and AC conductivity tensors and the density of states (DOS) of a d-dimensional disordered system and has been adopted to calculate all kinetic linear-transport coefficients such as thermoelectric power, thermal conductivity, Peltier coefficient, and Lorenz number (59).
The main advantage of both methods is that they work reliably 1), for short DNA strands ranging from 13 basepairs up to 30-basepairs-length (DFT studies; Pablo et al. (41)), which are being used in the nanoscopic transport measurements (36); 2), for somewhat longer DNA sequences as modeled in the electron transfer results; and 3), even for complete DNA sequences which contain, e.g., for human chromosomes, up to 245 million basepairs (7).
DNA SEQUENCES
The exact arrangement of the four bases A, T, G, and C determines the nature and function of its associated DNA strand, such as the chemical composition of the proteins that are encoded. Although previous studies have aimed to elucidate whether DNA conducts at all, we shall also focus our attention to investigate how different DNA sequences, be they artificial or naturally occurring, conduct charge differently. Thus, we study a set of different DNA.
A convenient starting point for most electronic transport studies (16) is the aforementioned poly(dG)-poly(dC) sequence, which corresponds to a simple repetition of a GC (or CG) pair. Note that within our models, there is no difference between GC and CG pairs. Although not occurring naturally, such sequences can be synthesized easily. Another convenient choice of artificial DNA strand is a simple random sequence of the four bases, which we construct with equal probability for all four bases. However, they are not normally used in experiments.
As DNA samples existing in living organisms, we shall use λ-DNA of the bacteriophage virus (60), which has a sequence of 48,502 basepairs. It corresponds to a bacterial virus and is biologically very well characterized. We also investigate the 29,728 bases of the SARS virus (61). Telomeric DNA is a particular buffer part at the beginning and ends of DNA strands for eukaryote cells (7). In mammals, it is a Guanine-rich sequence in which the pattern TTAGGG is repeated over thousands of bases. Its length is known to vary widely between species and individuals but we assume a length of 6000 basepairs. Last, we have also studied centromeric DNA for chromosome 2 of yeast with 813,138 basepairs (CEN2, Chromosome II centromere, http://www.yeastgenome.org/). This DNA is also reportedly rich in G bases and has a high rate of repetitions, which should be favorable for electronic transport. Results will be presented elsewhere.
Initially, we will compute transport properties for complete DNA sequences, i.e., including and not differentiating between coding and noncoding sequences (this distinction applies to the naturally occurring DNA strands only). However, we will later also study the difference between those two different parts of a given DNA. We emphasize that although noncoding DNA suffers from the label of “junk”, it is now known to play several important roles in the functioning of DNA (7).
Before leaving the description of our DNA sequences, we note that, occasionally, we show results for scrambled DNA. This is DNA with the same number of A, T, C, G bases, but with their order randomized. Clearly, such sequences contain the same set of electronic potentials and hopping variations, but would perform quite differently if released into the wild. A comparison of their transport properties with those from the original sequence thus allows us to measure how important the exact fidelity of a sequence is.
RESULTS FOR CLEAN DNA
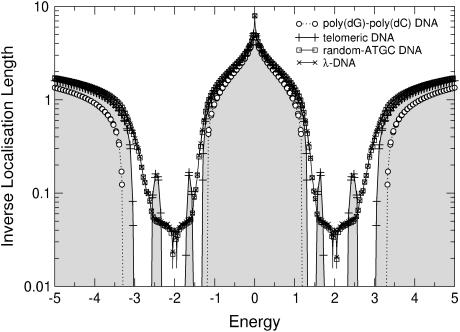
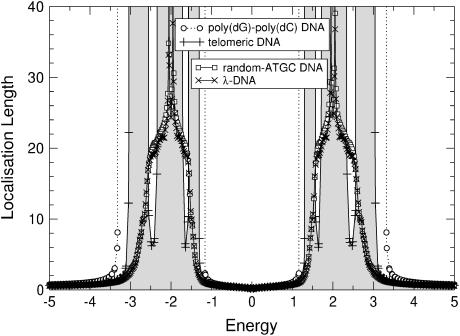
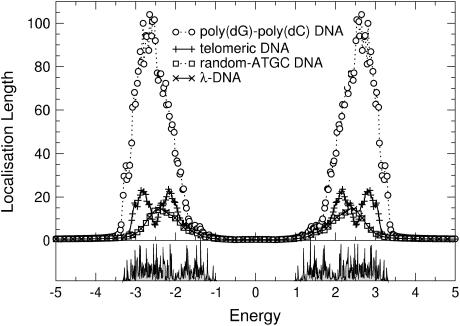
Let us start by studying the localization properties of DNA without any on-site disorder either at ɛi,τ or at ɛi,q. For a poly(dG)-poly(dC) sequence, both the fishbone and ladder models produce two separate energy bands between the extremal values, which were computed at the end of Effective Models and the Energy Gap (see above; and note that the results for the fishbone and ladder models are qualitatively the same. Quantitatively, the ladder model results have a nearly twice-larger localization length. This factor approaches 2, if t1,2 → 0. Therefore, we will focus our discussion on the two-channel ladder model.) Within these energy bands, the electronic states are extended with infinite localization length ξ, as expected. Outside the bands, transport is exponentially damped due to an absence of states and the ξ values are very close to zero. In Fig. 4, the resulting inverse localization lengths are shown. These are zero for the extended states in the two bands, but finite outside, showing the quick decrease of the localization lengths outside the bands. In Fig. 5, we show the same data but now plot the localization length itself. We see that the energy gap observed previously (12) for the poly(dG)-poly(dC) sequence in the fishbone model remains. The difference with respect to the ladder model is a slight renormalization of the gap width. The localization lengths of poly(dG)-poly(dC) DNA tend to infinity, meaning that the sequence is perfectly conducting. This is expected due to its periodic electronic structure.
FIGURE 4.
Plot of the inverse localization lengths ξ as a function of Fermi energy for the ladder model (Eq. 4) and four DNA sequences as well as for the fishbone model with a poly(dG)-poly(dC) sequence. The data for telomeric DNA has been shaded for clarity. Only every 20th symbol is shown for λ- and random-ATGC DNA. Lines are guides to the eye only.
FIGURE 5.
Localization lengths as a function of energy for poly(dG)-poly(dC), telomeric, random-ATGC, and λ-DNA as described in the text. The spectrum is symmetric in energy. The data for telomeric DNA has been shaded for clarity. Only every 20th symbol is shown for λ- and random-ATGC DNA. Lines are guides to the eye only.
Turning our attention to the other three DNA sequences, we find that telomeric DNA also gives rise to perfect conductivity like poly(dG)-poly(dC) DNA. However, due to its structure of just six repeating basepairs, there is a further split of each band into three separate sub-bands. They may be calculated as in Effective Models and the Energy Gap (see above). We would like to point out that it may therefore be advantageous to use the naturally occurring telomeric parts of DNA sequences as prime, in vivo candidates when looking for good conductivity in a DNA strand.
The structure of the energy dependence for the random-ATGC and the λ-DNA is very different from the preceding two sequences, but it is quite similar between just these two. The biological content of the DNA sequences is—within the description by our quantum models—just a sequence of binary hopping elements between like and unlike basepairs. Thus, the models are related to the physics of random hopping models (62,63), and in agreement with these, we see a Dyson peak (64) in the center of each sub-band. For the ladder model, the Dyson peak has been split by t1,2 into two subpeaks, as shown in Figs. 4 and 5. Furthermore, we see that the range of energies for which we observe non-zero localization lengths is increased into the gap and for large absolute values of the energy. This is similar to the broadening of the single energy band for the Anderson model of localization (48). The localization lengths, which roughly equal the average distance an electron would be able to travel (conduct), are close to the distance of 20 bases within the band, with a maximum of ∼30 bases at the center of each band. Note that this result is surprisingly good—given the level of abstraction used in these models—when compared to the typical distances over which electron transfer processes have been shown to be relevant (2,4–6,8,17,44).
RESULTS FOR DISORDERED DNA
DNA randomly bent or at finite temperatures
As argued before, environmental influences on the transport properties of DNA are likely to influence predominantly the electronic structure of the backbone. Within our models, this can be captured by adding a suitable randomness onto the backbone on-site potentials  . In this fashion, we can, for example, model the influence of a finite-temperature (35), and thus, a coupling to phonons (65). We emphasize, however, that for our localization results—which rely on quantum mechanical interference effects—to remain valid, the phase-breaking lengths should stay much larger than the sequence lengths. Thus, the permissible temperature range is a few K only. The bending of DNA is another possibility, which can be modeled by a local, perhaps regular, change in
  along the strand. Another important aspect is the change in
  due to the presence of a solution in which DNA is normally immersed.
All these effects can be modeled in a first attempt by choosing an appropriate distribution function  ). Let us first choose uniform disorder with
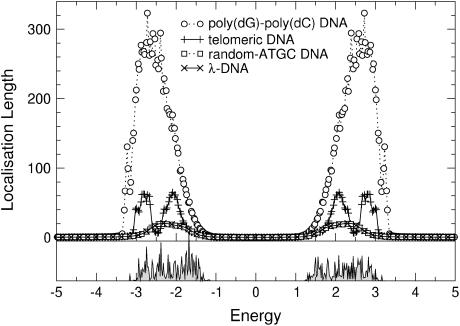
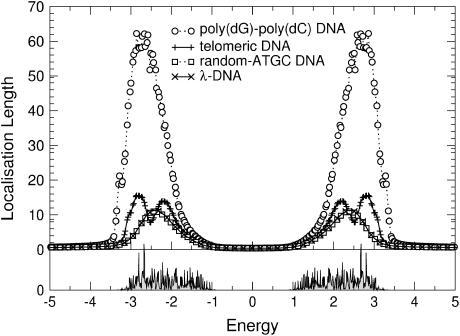
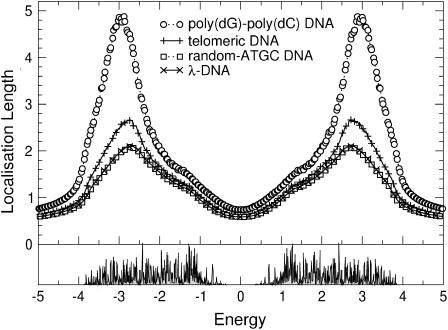
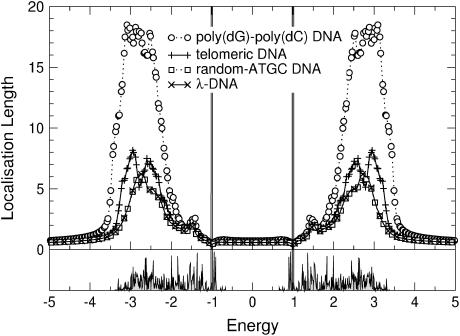
  In Fig. 6 we show the results for all four DNA sequences as a function of energy for W = 1. Comparing this to Fig. 5, we see that now all localization lengths are finite, with poly(dG)-poly(dC) and telomeric DNA having localization lengths of a few hundreds and a few tens of bases, respectively. The localization lengths for random-ATGC and λ-DNA are only slightly reduced. In all cases, the structure of two energy bands remains. Furthermore, W = 1 already represents a sizable broadening of ∼1/2 the width of each band. Thus, although the localization lengths are finite compared to those in Results for Clean DNA (see above), they are still larger than the lengths of the DNA strands used in the nano-electric experiments, implying finite conductances. We remark that the Dyson peaks have vanished as expected (63). We also plot the DOS for λ-DNA in Fig. 6, which clearly indicates the two bands. Upon further increasing the disorder to W = 2, as shown in Fig. 7, the localization lengths continue to decrease. Note that we observe a slight broadening of the bands, and states begin to shift into the gap. We also see that the behavior of random-ATGC and λ-DNA is quite similar and at these disorder strengths, even telomeric DNA follows the same trends. At W = 5, the localization lengths have been reduced to a few basepair separation distances and the differences between all four sequences are very small. The gap has been nearly completely filled as shown by the DOS in Fig. 8, albeit with states that have a very small localization length. This will become important later.
FIGURE 6.
(Top) Energy dependence of the localization lengths, ξ(E), for poly(dG)-poly(dC), telomeric, random-ATGC, and λ-DNA in the presence of uniform backbone disorder with W = 1. Only every second and fifth symbol is shown for random-ATGC and λ-DNA, respectively. (Bottom) DOS for λ-DNA using the same parameters as in the top panel.
FIGURE 7.
(Top) ξ(E) as in Fig. 6 but with W = 2. Only every second and fifth symbol is shown for random-ATGC and λ-DNA, respectively. (Bottom) DOS for λ-DNA using the same parameters as in the top panel.
FIGURE 8.
(Top) ξ(E) as in Fig. 6 but with W = 5. Only every second and fifth symbol is shown for random-ATGC and λ-DNA, respectively. (Bottom) DOS for λ-DNA using the same parameters as in the top panel.
Thus, in summary, we have seen that adding uniform disorder onto the backbone leads to a reduction of the localization lengths and consequently a reduction of the electron conductance. Strictly speaking, all four strands are insulators. However, their localization lengths can remain quite large, larger than in many of the experiments. Thus, even the localized electron can contribute toward a finite conductivity for these short sequences. In agreement with experiments, poly(dG)-poly(dC) DNA is the most prominent candidate.
DNA in an ionic solution
When in solution, the negatively charged oxygen on the backbone will attract cations such as Na+. This will give rise to a dramatic change in local electronic properties at the oxygen-carrying backbone site, but not necessarily influence the neighboring sites. The effects at each such site will be the same, and thus, in contrast to a uniform disorder used in DNA Randomly Bent or at Finite Temperatures (see above), a binary distribution such as ɛi,q = ±W/2 is more appropriate. For simplicity, we choose 50% of all backbone sites to be occupied ɛi,q = −W/2, whereas the other half remains empty with ɛi,q = +W/2. We note that a mixture of concentrations has been studied in the context of the Anderson model (66).
In Fig. 9, we show the results for moderate binary disorder. In comparison with the uniformly disordered case of Fig. 6, we see that the localization lengths have decreased further. This is expected because binary disorder is known to be very strong (66). Also, the gap has already started to fill.
FIGURE 9.
(Top) Energy dependence of the localization lengths, ξ(E), for poly(dG)-poly(dC), telomeric, random-ATGC, and λ-DNA in the presence of binary backbone disorder with W = 1. Only every second and fifth symbol is shown for random-ATGC and λ-DNA, respectively. (Bottom) DOS for λ-DNA using the same parameters as in the top panel.
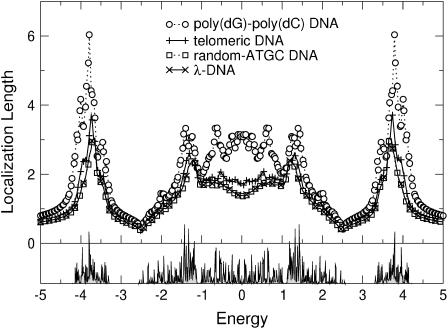
Increasing the disorder leads again to a decrease of ξ in the energy regions corresponding to the bands. Directly at E = ±W/2, we observe two strong peaks in the DOS which is accompanied by reduced localization lengths. This peak corresponds to the infinite potential barrier or well at E = −W/2 or +W/2, respectively, as indicated by Eq. 4. In Fig. 9, these peaks were not yet visible. We also see in Fig. 10 that the localization lengths for states in the band center start to increase to values ≳1. This trend continues for larger W as shown in Fig. 11. We see a crossover into a regime where the two original, weak-disorder bands have nearly vanished and states in the center at E = 0 are starting to show an increasing localization length upon increasing the binary disorder. A further increase in W eventually leads to the complete destruction of the original bands and the formation of a single band symmetric around E = 0 at ∼W ∼2.5.
FIGURE 10.
(Top) ξ(E) as in Fig. 9 but with W = 2. Only every second and fifth symbol is shown for random-ATGC and λ-DNA, respectively. (Bottom) DOS for λ-DNA using the same parameters as in the top panel.
FIGURE 11.
(Top) ξ(E) as in Fig. 9 but with W = 5. Only every second and fifth symbol is shown for random-ATGC and λ-DNA, respectively. (Bottom) DOS for λ-DNA using the same parameters as in the top panel.
Delocalization due to disorder
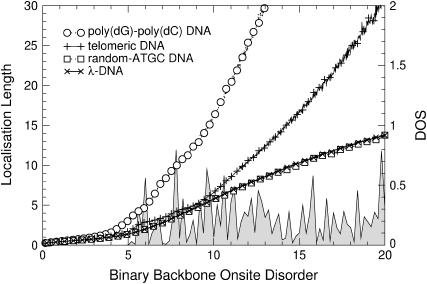
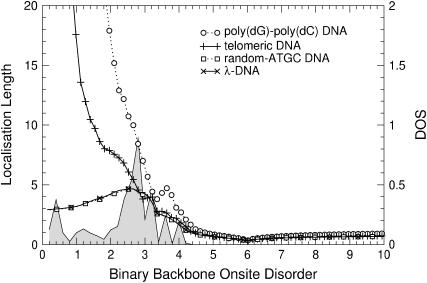
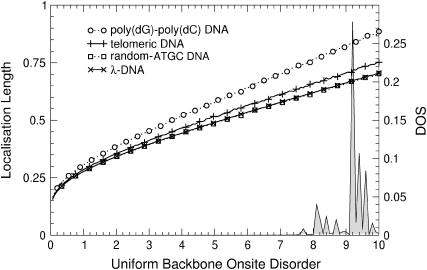
The results of the previous section suggest that increasing the disorder in different regions of the energy will lead to different transport behavior. Of particular interest is the region at E = 0. In Fig. 12, the variation of ξ as a function of binary disorder strength for all different sequences is shown. Although ξ < 1 for small disorder, we see that upon increasing the disorder, states begin to appear and their localization lengths increase for all DNA sequences. Thus, we indeed observe a counterintuitive delocalization by disorder at E = 0. As before, poly(dG)-poly(dC) and telomeric disorder show the largest localization lengths, whereas random-ATGC and λ-DNA give rise to a smaller and nearly identical effect. In Fig. 13 we show that this effect does not exist at E = 3, i.e., for energies corresponding to the formerly largest localization lengths. Rather, at E = 3, the localization lengths for all DNA sequences quickly drop to ξ ∼1. The delocalization effect is also observed for uniform disorder, but is much smaller. As shown in Fig. 14, the enhancement is up to ξ = 1 for the fishbone model (Eq. 1). Results for the ladder model (Eq. 2) are ∼1.7 times larger.
FIGURE 12.
Disorder-dependence of ξ for poly(dG)-poly(dC), telomeric, random-ATGC, and λ-DNA at E = 0. Only every 10th symbol is shown for all sequences. The shaded curve is the corresponding unnormalized DOS for λ-DNA.
FIGURE 13.
ξ(W) as in Fig. 12 but with E = 3. Only every 10th symbol is shown for all DNA sequences. The shaded curve is the corresponding unnormalized DOS for λ-DNA.
FIGURE 14.
ξ(W) as in Fig. 12 but with uniform disorder at E = 0 and for the fishbone model. Only every 10th symbol is shown for all DNA sequences. The shaded curve is the corresponding unnormalized DOS for λ-DNA.
This surprising delocalization-by-disorder behavior can be understood by considering the effects of disorder at the backbone for the effective Hamiltonians (Eqs. 3 and 4). At E = 0, the on-site potential correction term  will decrease upon increasing the
  values. For binary disorders
  , this holds for
  as shown in Fig. 13. However, for large |E|, the localization lengths decrease quickly due to the much smaller density of states. Thus, the net effect is an eventual decrease (or only a very small increase) of ξ for large E. Note the dip at
  in the figure, which corresponds to the effective ɛi = ∞, i.e., an infinitely strong trap yielding extremely strong localization. For uniform disorder
  —and generally any disorder with compact support around E = 0—the above inequality is never fulfilled, and even for E = 0, we will find small
  such that we have strong trapping and localization.
INVESTIGATING THE LOCAL PROPERTIES OF THE SEQUENCES
Variation of ξ along the DNA strand
In the preceding sections, we had computed estimates of the localization length ξ for complete DNA strands, i.e., the ξ values are averages. However, the biological function of DNA clearly depends on the local structure of the sequence in a paramount way. After all, only certain parts of DNA code for proteins, while others do not. In addition, the exact sequence of the bases specifies the protein that is to be assembled. Thus, to gain access to the local properties, we have performed computations of ξ on subsequences of complete DNA strands. We start by artificially restricting ourselves to finite windows of length K = 10, 30, 50, 100, 200, 500, and 1000, and compute the localization lengths ξK(r) where r = 1, 2, …, L – K denotes the starting position of the window of length K.
To see how the exact sequence determines our results, we have also randomly permuted (scrambled) the λ-DNA sequence so that the content of A, T, G, and C bases is the same, but their order is randomized. Differences in the localization properties should then indicate the importance of the exact order. From the biological information available on bacteriophage λ-DNA, we compute the localization length for the coding regions (67) and then for window lengths K that correspond exactly to the length of each coding region. Again, if the electronic properties—as measured by the localization length—are linked to biological content, we would expect to see characteristic differences.
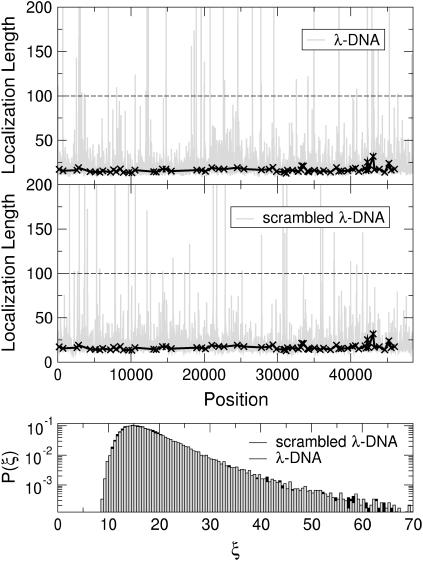
In Figs. 15 and 16, we show results for K = 100 and 1000, respectively. From Fig. 15, we see from P(ξ) that the localization lengths for λ-DNA are mostly distributed around 15–20, but P(ξ) has a rather long tail for large ξ. However, there are some windows where the localization lengths exceed even the size of the window K = 100. Thus, at specific positions in the DNA sequence, the system appears essentially extended with ξ > K. On the other hand, the distribution P(ξ) is identical when, instead of λ-DNA, we consider scrambled DNA. Therefore, the presence of such regions is not unique to λ-DNA. The results from windows positioned at the coding part of λ-DNA appear statistically similar to the complete sequence, i.e., including also the noncoding regions. This suggests that, with respect to the localization properties, there is no obvious difference between λ-DNA and scrambled λ-DNA as well as coding and noncoding regions. We emphasize that similar results have been obtained for a DNA sequence constructed from the SARS corona-viral data.
FIGURE 15.
(Top) Variation of the localization lengths for a sliding window of length K = 100 as a function of window starting position for λ-DNA at E = 3. The solid crosses (×) denote results for windows corresponding to the coding sequences of λ-DNA only. The dashed horizontal line denotes K. (Middle) Same as in the top panel but with randomly scrambled λ-DNA. (Bottom) Normalized distribution functions P(ξ) for the localization lengths ξ of λ- (solid) and scrambled-λ-DNA (shaded).
FIGURE 16.
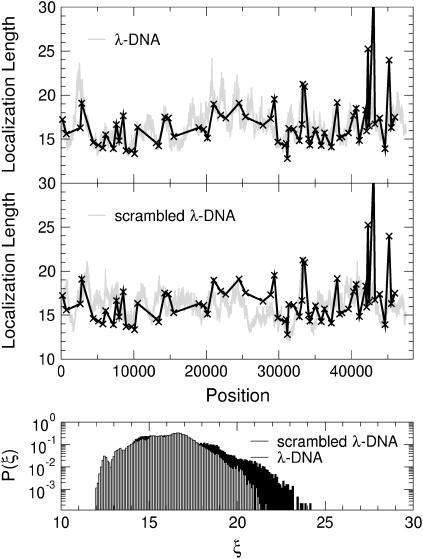
(Top) Variation of the localization lengths for a sliding window of length K = 1000 at E = 3 as in Fig. 15. (Middle) Same as in the top panel but with randomly scrambled λ-DNA. (Bottom) Normalized distribution functions P(ξ) for the localization lengths ξ of λ- (solid) and scrambled-λ-DNA (shaded).
In Fig. 15, we repeat these calculations but with K = 1000. Clearly, P(ξ) is peaked again around 15–20 and this time has no tail. In all cases, K > ξ. Again, the results for scrambled DNA are different in each window, and now even P(ξ) is somewhat shifted with respect to λ-DNA.
Thus, in conclusion, we do not see significant differences between λ-DNA and its scrambled counterpart. Moreover, there appears to be no large difference between the localization lengths measured in the coding and the noncoding sequences of bacteriophage λ-DNA. This indicates that the average ξ values computed in the previous sections is sufficient when considering the electronic localization properties of the four complete DNA sequences.
Computing correlation functions
As shown in the last section, the spatial variation of ξ for a fixed window size is characteristic of the order of bases in the DNA sequence. Thus, we can now study how this biological information is retained at the level of localization lengths. To do so, we define the correlation function
 |
(5) |
where  is ξ averaged over all n = L − (K − 1) windows for each of which the individual localization lengths are ξ(ri).
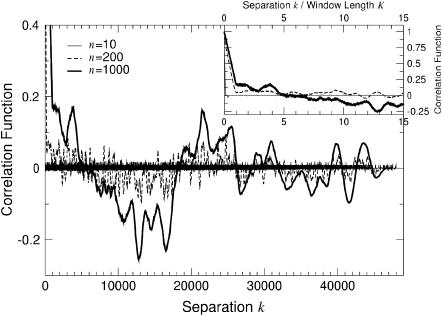
In Fig. 17 we show the results obtained for λ-DNA with windows of length 10, 200, and 1000. We first note that Cor(k) drops rapidly until the distance k exceeds the window width K (see inset of Fig. 17). For k > K, Cor(k) fluctuates typically between ±0.2 and there is a larger anticorrelation for basepair separations of ∼k ≈ 12,000. We note that such large-scale features are not present when considering scrambled λ-DNA instead.
FIGURE 17.
Cor(k) as defined in Eq. 5 for λ-DNA and K = 10, 200, and 1000 at E = 3. The inset shows the same data but plotted as a function of normalized separation k/K.
DISCUSSION
The fishbone and ladder models studied in this article give qualitatively similar results, i.e., a gap in the DOS on the order of the hopping energies to the backbone, extended states for periodic DNA sequences, and localized states for any non-zero disorder strength. Thus, at T = 0, our results suggest that DNA is an insulator unless perfectly ordered. Quantitatively, the localization lengths ξ computed for the ladder model are larger than for the fishbone model. Since we are interested in these nonuniversal lengths, the ladder model is clearly the more appropriate model.
The localization lengths measure the spatial extent of a conducting electron. Our results suggest—in agreement with all previous considerations—that poly(dG)-poly(dC) DNA allows the largest values of ξ. Even after adding a substantial amount of disorder, poly(dG)-poly(dC) DNA can still support localization lengths of a-few-hundred-basepair separation lengths. With nanoscopic experiments currently probing at the most a few dozen bases, this suggests that poly(dG)-poly(dC) DNA will appear to be conducting in these experiments.
Furthermore, telomeric DNA is a very encouraging and interesting naturally occurring sequence because it gives very large localization lengths in the weakly disordered regime. Nevertheless, we find that all investigated, nonperiodic DNA sequences such as, e.g., random-ATGC and λ-DNA, give localized behavior even in the clean state. This indicates that they are insulating at T = 0.
When the effects of the environment modeled by their potential changes on the backbone are included, we find that the localization lengths in the two bands decrease quickly upon increasing the disorder. Nevertheless, depending on the value of the Fermi energy, the resulting ξ values can still be 10–20 basepairs long. Although this may not give metallic behavior, it can still result in a finite current for small sequences. We also note that these distances are quite close to those obtained from electron-transfer studies.
The backbone disorder also leads to states moving into the gap. Therefore, the environment prepared in the experiments determines the gap being measured. Furthermore, the localization properties of the states in the former gap are drastically different from those in the two bands. Increasing the disorder leads to an increase in the localization lengths and thus, potentially larger currents. This is most pronounced for binary disorder, taken to model the adhesion of cations in solution. Thus, within the two models studied, we find that their transport properties are, in a very crucial way, determined by the environment. Differences in experimental setup such as measurements in two-dimensional surfaces or between elevated contacts are likely to lead to quite different results.
As far as the correlations within biological λ-DNA are concerned, we see only a negligible difference between the localization properties of the coding and noncoding parts. However, this is clearly dependent on the chosen energy and the particular window lengths used. Investigations on other DNA sequences are in progress.
Acknowledgments
It is a pleasure to thank H. Burgert, D. Hodgson, M. Pfeiffer, D. Porath, and A. Rodriguez for stimulating discussions.
References
- 1.Berlin, Y. A., A. L. Burin, and M. A. Ratner. 2000. On the long-range charge transfer in DNA. J. Phys. Chem. 104:443–445. [Google Scholar]
- 2.Delaney, S., and J. K. Barton. 2003. Long-range DNA charge transport. J. Org. Chem. 68:6475–6483. [DOI] [PubMed] [Google Scholar]
- 3.Endres, R. G., D. L. Cox, and R. P. Singh. 2004. The quest for high-conductance DNA. Rev. Mod. Phys. 76:195–214. [Google Scholar]
- 4.Murphy, C. J., M. A. Arkin, Y. Jenkins, N. D. Ghatlia, S. Bossman, N. J. Turro, and J. K. Barton. 1993. Long-range photoinduced electron transfer through a DNA helix. Science. 262:1025–1029. [DOI] [PubMed] [Google Scholar]
- 5.O'Neil, M. A., C. Dohno, and J. K. Barton. 2004. Direct chemical evidence for charge transfer between photoexcited 2-aminopurine and guanine in duplex DNA. J. Am. Chem. Soc. 126:1316–1317. [DOI] [PubMed] [Google Scholar]
- 6.Wan, C., T. Fiebig, O. Schiemann, J. K. Barton, and A. H. Zewail. 2000. Femtosecond direct observation of charge transfer between bases in DNA. Proc. Natl. Acad. Sci. USA. 97:14052–14055. [DOI] [PMC free article] [PubMed] [Google Scholar]
- 7.Alberts, B., D. Bray, J. Lewis, M. Raff, K. Roberts, and J. Watson. 1994. Molecular Biology of the Cell. Garland, New York.
- 8.Boon, E., A. Livingston, N. Chmiel, S. David, and J. Barton. 2003. DNA-mediated charge transport for DNA repair. Proc. Natl. Acad. Sci. USA. 100:12543–12547. [DOI] [PMC free article] [PubMed] [Google Scholar]
- 9.O'Neil, P., and E. M. Fielden. 1993. Primary free radical processes in DNA. Adv. Radiat. Biol. 17:53–120. [Google Scholar]
- 10.Retel, J., B. Hoebee, J. E. F. Braun, J. T. Lutgerink, E. Van der Akker, H. Wanamarta, H. Joenjie, and M. V. M. Lafleur. 1993. Mutational specificity of oxidative DNA damage. Mutat. Res. 299:165. [DOI] [PubMed] [Google Scholar]
- 11.Bhalla, V., R. P. Bajpai, and L. M. Bharadwaj. 2003. DNA electronics. EMBO Rep. 4:442–445. [DOI] [PMC free article] [PubMed] [Google Scholar]
- 12.Cuniberti, G., L. Craco, D. Porath, and C. Dekker. 2002. Backbone-induced semiconducting behavior in short DNA wires. Phys. Rev. B. 65:241314. [Google Scholar]
- 13.Garzon, I. L., E. Artacho, M. R. Beltran, A. Garcia, J. Junquera, K. Michaelian, P. Ordejon, C. Rovira, D. Sanchez-Portal, and J. M. Soler. 2001. Hybrid DNA-gold nanostructured materials: an ab-initio approach. Nanotechnology. 12:126–131. [Google Scholar]
- 14.Rakitin, A., P. Aich, C. Papadopoulos, Y. Kobzar, A. Vendeneev, J. Lee, and J. Xu. 2001. Metallic conduction through engineered DNA: DNA nanoelectric building blocks. Phys. Rev. Lett. 86:3670–3673. [DOI] [PubMed] [Google Scholar]
- 15.Dekker, C., and M. A. Ratner. 2001. Electronic properties of DNA. Phys. World. 14:29–33. [Google Scholar]
- 16.Porath, D., G. Cuniberti, and R. Di Felice. 2004. Charge transport in DNA-based devices. In Topics in Current Chemistry, Vol. 237. Springer-Verlag, Berlin. 183–228.
- 17.Treadway, C. R., M. G. Hill, and J. K. Barton. 2002. Charge transport through a π-molecular stack: double-helical DNA. Chem. Phys. 281:409–428. [Google Scholar]
- 18.Braun, E., Y. Eichen, U. Sivan, and G. Ben-Yoseph. 1998. DNA-templated assembly and electrode attachment of a conducting silver wire. Nature. 391:775–778. [DOI] [PubMed] [Google Scholar]
- 19.Lewis, J. P., T. E. Cheatham, E. B. Starikov, H. Wang, and O. F. Sankey. 2003. Dynamically amorphous character of electronic states in poly(dA)-poly(dT) DNA. J. Phys. Chem. B. 107:2581–2587. [Google Scholar]
- 20.Asabaeva, A., and M. Tang. 2000. Electrical conductivity in oriented DNA. National Nanofabrication Users Network Newsletter. 56–57.
- 21.Fink, H.-W., and C. Schonenberger. 1999. Electrical conduction through DNA molecules. Nature. 398:407–410. [DOI] [PubMed] [Google Scholar]
- 22.Nakao, H., M. Gad, S. Sugiyama, K. Otobe, and T. Ohtani. 2003. Transfer-printing of highly aligned DNA nanowires. J. Am. Chem. Soc. 125:7162–7163. [DOI] [PubMed] [Google Scholar]
- 23.Okahata, Y., T. Kobayashi, K. Tanaka, and M. Shimomura. 1998. Anisotropic electric conductivity in an aligned DNA cast film. J. Am. Chem. Soc. 120:6165–6166. [Google Scholar]
- 24.Porath, D., A. Bezryadin, S. Vries, and C. Dekker. 2000. Direct measurement of electrical transport through DNA molecules. Nature. 403:635–638. [DOI] [PubMed] [Google Scholar]
- 25.Bixon, M., B. Giese, S. Wessely, T. Langenbacher, M. E. Michel-Beyerle, and J. Jortner. 1999. Long-range charge hopping in DNA. Proc. Natl. Acad. Sci. USA. 96:11713–11716. [DOI] [PMC free article] [PubMed] [Google Scholar]
- 26.Yu, Z., and X. Song. 2001. Variable range hopping and electrical conductivity along the DNA double helix. Phys. Rev. Lett. 86:6018–6021. [DOI] [PubMed] [Google Scholar]
- 27.Roche, S. 2003. Sequence-dependent DNA-mediated conduction. Phys. Rev. Lett. 91:108101–108104. [DOI] [PubMed] [Google Scholar]
- 28.Roche, S., D. Bicout, E. Maciá, and E. Kats. 2003. Long-range correlation in DNA: scaling properties and charge transfer efficiency. Phys. Rev. Lett. 91:228101–228104. [DOI] [PubMed] [Google Scholar]
- 29.Wang, H., J. P. Lewis, and O. F. Sankey. 2004. Band-gap tunneling states in DNA. Phys. Rev. Lett. 93:016401. [DOI] [PubMed] [Google Scholar]
- 30.Zhang, W., and S. E. Ulloa. 2004. Extended states in disordered systems: role of off-diagonal correlations. Phys. Rev. B. 69:153203-1–153203-4. [Google Scholar]
- 31.Zhang, W., and S. E. Ulloa. 2004. Structural and dynamical disorder and charge transport in DNA. Microelectron. J. 35:23–26. [Google Scholar]
- 32.Cuenda, S., and A. Sanchez. 2004. Disorder and fluctuations in nonlinear excitations in DNA. ArXiv: q-bio.BM/0403003v1.
- 33.Peyrard, M. 2004. Nonlinear dynamics and statistical physics of DNA. Nonlinearity. 17:R1–R40. [Google Scholar]
- 34.Barnett, R. N., C. L. Cleveland, A. Joy, U. Landman, and G. B. Schuster. 2001. Charge migration in DNA: ion-gated transport. Science. 294:567–571. [DOI] [PubMed] [Google Scholar]
- 35.Bruinsma, R., G. Gruner, M. R. D'Orsogna, and J. Rudnick. 2000. Fluctuation-facilitated charge migration along DNA. Phys. Rev. Lett. 85:4393–4396. [DOI] [PubMed] [Google Scholar]
- 36.Davies, O. R., and J. E. Inglesfield. 2004. Embedding methods for conductance in DNA. Phys. Rev. B. 69:195110–195113. [Google Scholar]
- 37.Zhong, J. 2003. Effects of backbone disorder on electronic transport in DNA molecules. In Proceedings of the 2003 Nanotechnology Conference, Vol. 2. M. Laudon and B. Romamowicz, editors. Computational Publications, CAMBRIDGE, MA. 105–108.
- 38.Bakhshi, A., and P. Otto. 1986. On the electronic structure and conduction properties of aperiodic DNA and proteins. II. Electronic structure of aperiodic DNA. Chem. Phys. 108:215–222. [Google Scholar]
- 39.Ladik, J., M. Seel, P. Otto, and A. Bakhshi. 1986. On the electronic structure and conduction properties of aperiodic DNA and proteins. I. Strategy and methods of investigations. Chem. Phys. 108:203–214. [Google Scholar]
- 40.Walet, N. R., and W. J. Zakrzewski. 2004. A simple model of the charge transfer in DNA-like substances. ArXiv: cond-mat/0402059v1.
- 41.Pablo, P. J., F. Moreno-Herrero, J. Colchero, J. G. Herrero, P. Hererro, P. Baro, A. M. Ordejon, J. M. Soler, and E. Artacho. 2000. Absence of deconductivity in λ-DNA. Phys. Rev. Lett. 85:4992–4995. [DOI] [PubMed] [Google Scholar]
- 42.Wesolowski, S. S., M. L. Leininger, P. N. Pentchev, and H. F. Schaefer III. 2001. Electron affinities of the DNA and RNA bases. J. Am. Chem. Soc. 123:4023–4028 [DOI] [PubMed] [Google Scholar]
- 43.SPARTAN version 5.0, User's Guide. 1998. Wavefunction, Irvine, CA.
- 44.Kelley, S. O., and J. K. Barton. 1999. Electron transfer between bases in double-helical DNA. Science. 283:375–381. [DOI] [PubMed] [Google Scholar]
- 45.Peng, C. K., S. Buldyrev, A. Goldberger, S. Havlin, F. Sciortino, M. Simons, and H. E. Stanley. 1992. Long-range correlations in nucleotide sequences. Nature. 356:168–171. [DOI] [PubMed] [Google Scholar]
- 46.Yamada, H., E. B. Starikov, D. Hennig, and J. F. R. Archilla. 2004. Localization properties of electronic states in polaron model for poly(dG)-poly(dD) and poly(dA)-poly(dT). ArXiv: cond-mat/0407148v1. [DOI] [PubMed]
- 47.Ye, Y.-J., R. S. Chen, F. Chen, J. Sun, and J. Ladik. 2001. The effect of water environment on the hopping conductivity of an aperiodic nucleotide base stack. Sol. State Comm. 119:175–180. [Google Scholar]
- 48.Römer, R. A., and M. Schreiber. 2003. Numerical investigations of scaling at the Anderson transition. In The Anderson Transition and its Ramifications—Localisation, Quantum Interference, and Interactions. T. Brandes and S. Kettemann, editors. Springer, Berlin. 3–19.
- 49.Kramer, B., and A. MacKinnon. 1993. Localization: theory and experiment. Rep. Prog. Phys. 56:1469–1564. [Google Scholar]
- 50.MacKinnon, A. 1994. Critical exponents for the metal-insulator transition. J. Phys. Condens. Matter. 6:2511–2518. [Google Scholar]
- 51.MacKinnon, A., and B. Kramer. 1983. The scaling theory of electrons in disordered solids: additional numerical results. Z. Phys. B. 53:1–13. [Google Scholar]
- 52.Pichard, J.-L., and G. Sarma. 1981. Finite-size scaling approach to Anderson localisation. J. Phys. C. 14:L127–L132. [Google Scholar]
- 53.Pichard, J.-L., and G. Sarma. 1981. Finite-size scaling approach to Anderson localisation. II. Quantitative analysis and new results. J. Phys. C. 14:L617–L625. [Google Scholar]
- 54.Frahm, K., A. Müller-Groeling, J. L. Pichard, and D. Weinmann. 1995. Scaling in interaction-assisted coherent transport. Europhys. Lett. 31:169. [Google Scholar]
- 55.Ndawana, M. L., R. A. Römer, and M. Schreiber. 2004. Effects of scale-free disorder on the Anderson metal-insulator transition. Europhys. Lett. 68:678–684. [Google Scholar]
- 56.Römer, R. A., and M. Schreiber. 1997. The enhancement of the localization length for two interacting particles is vanishingly small in transfer-matrix calculations. Phys. Rev. Lett. 78:4890. [Google Scholar]
- 57.MacKinnon, A. 1980. The conductivity of the one-dimensional disordered Anderson model: a new numerical method. J. Phys. Condens. Matter. 13:L1031–L1034. [Google Scholar]
- 58.MacKinnon, A. 1985. The calculation of transport properties and density of states of disordered solids. Z. Phys. B. 59:385–390. [Google Scholar]
- 59.Römer, R. A., C. Villagonzalo, and A. MacKinnon. 2002. Thermoelectric properties of disordered systems. J. Phys. Soc. Jpn. 72:167–168 (Suppl. A.). [Google Scholar]
- 60.Bacteriophage lambda. Complete genome (gi|9626243|ref|NC_001416.1|(9626243)), Genbank Accession number NC_001416, http://www.ncbi.nlm.nih.gov/entrez/
- 61.SARS coronavirus. Complete genome (gi|30271926|ref|NC_004718.3|(30271926)), Genbank Accession number NC_004718, http://www.ncbi.nlm.nih.gov/entrez/
- 62.Biswas, P., P. Cain, R. A. Römer, and M. Schreiber. 2000. Off-diagonal disorder in the Anderson model of localization. Phys. Stat. Sol. 218:205. ArXiv: cond-mat/0001315. [Google Scholar]
- 63.Eilmes, A., R. A. Römer, and M. Schreiber. 1998. The two-dimensional Anderson model of localization in random hopping. Eur. Phys. J. B. 1:29–38. [Google Scholar]
- 64.Dyson, F. J. 1953. The dynamics of a disordered linear chain. Phys. Rev. 92:1331–1338. [Google Scholar]
- 65.Gutierrez, R., S. Mandal, and G. Cuniberti. 2004. Quantum transport in DNA wires: influence of a strong dissipative environment. ArXiv: cond-mat/0410660. [DOI] [PubMed]
- 66.Plyushchay, I., R. A. Römer, and M. Schreiber. 2003. The three-dimensional Anderson model of localization with binary random potential. Phys. Rev. B. 68:064201–064208. [Google Scholar]
- 67.Daniels, D. L., J. L. Schroeder, W. Szybalski, F. Sanger, and F. R. Blattner. 1983. Appendix I: a molecular map of colphase lambda. In LAMBDA II. R. Hendrix, J. Roberts, F. Stahl, and R. Weisberg, editors. Cold Spring Harbor Laboratory, Cold Spring Harbor, NY. 469–517.


