Abstract
Purple membranes (PM) from halobacteria were hydrated to ∼0.4 and ∼0.2 g H2O/g of PM and studied by dielectric spectroscopy and differential scanning calorimetry between 120 and 300 K. The dielectric process, attributed to a local (β) relaxation of the confined supercooled water, shows an Arrhenius temperature behavior at low temperatures. In the case of the most hydrated PM a small deviation from the Arrhenius behavior occurs at 190–200 K together with a pronounced endothermic process and an increased activation energy. The observed crossover is accompanied by a reduction of the interlayer spacing due to the partial loss of the intermembrane water. All these effects at ∼200 K are consistent with a scenario where the local relaxation process merges with a nonobservable α-relaxation of the interlayer water, giving rise to a more liquid-like behavior of the interfacial water. For the less hydrated sample the effects are less pronounced and shift to a slightly higher temperature.
INTRODUCTION
Water is essential for the stability and function of biological molecules and its importance in physics and chemistry cannot be underestimated. The properties of glassy water, the most abundant form of water in the Universe (1), is far from completely understood. Clarifying the glass transition behavior of bulk water is a difficult task, and its calorimetric behavior is much debated (2,3). The glass transition temperature of water at ambient pressure has commonly been accepted to be Tg = 136 K (3). However, recently a value of 165 K was proposed, based on incompatible thermal data of hyperquenched glassy water compared to known glass formers (4) and on consideration of entropy behavior in the supercooled region (5). This reassignment is controversial, and has spurred a healthy debate (6).
Near the glass transition temperature the viscosity of glass formers increases rapidly with cooling. The molecular relaxation time increases with a non-Arrhenius temperature dependence, the degree of which depends on the chemical interaction between the molecules. Supercooled liquids exhibiting small deviations from Arrhenius behavior are classified as “strong” liquids, whereas liquids with a pronounced non-Arrhenius behavior are labeled “fragile” (7,8). Water may be a notable exception to this classification (9). Near its melting point it is the most fragile of all liquids studied, whereas near the glass transition it seems to behave like a very strong liquid (9).
Hydration water, in particular water on the surface and in cavities of biomolecules, can provide important information on quenched glassy water, because in these cases, the geometrical confinement or the binding of the water molecules to a substrate can prevent crystallization. Despite the fact that water is present in most biological assemblies, the coupling between biomolecules and water is poorly understood.
Experimental and theoretical work has shown that proteins exhibit a broad dynamical transition at ∼170–230 K (10,11), marking the onset of a drastic increase in the average atomic mean-square displacement 〈μ2〉 on a nanosecond-picosecond timescale, observed by neutron scattering (12,13).
The transition in protein has been described as a “glass-like transition” to emphasize certain similarities with changes in viscosity and other properties of liquids when they form a glass. The general view of this low-temperature transition of proteins and other biomolecules at ∼200 K seems to be that this transition is directly coupled to the diffusive motion of their solvent (14,15). Recently, a survey of the temperature dependence of the fast dynamics of methyl-bearing side chains in a calmodulin-peptide complex was carried out using site-specific deuterium NMR relaxation methods. It was found that the amplitude of motion has a heterogeneous spectrum that is split into three distinct bands, and that the presence of these three bands of motion in proteins is generic. All three bands correspond to motions on a subnanosecond timescale (16). The apparent dynamical transition at ∼200 K was attributed to the freezing out of the middle band of motions; thus, no global glass transition model was used.
Here we study quenched, hydrated purple membrane (PM) using dielectric spectroscopy and differential scanning calorimetry (DSC). The purple membrane from Halobacterium salinarum is a two-dimensional crystalline lattice formed by the membrane protein bacteriorhodopsin (bR) (75% w/w) and lipid molecules (25% w/w). The structure and hydration dependent dynamics of PM has been extensively studied, and recent reviews exist (13,17). The macroscopic sample of PM is made from fragments or patches having a diameter in the order of 0.5–1.0μm (18). These patches pile up, with membrane planes parallel to each other when drying an aqueous suspension of PM. Layers of water up to tenths of Ångströms thick can be found between the parallel planes of the PM fragments, depending on the relative humidity (RH) of the atmosphere (13,19,20).
The water is confined between adjacent membrane layers as intermembrane water, with layers of surface-bound and nonsurface-bound water. Within the membrane layers, additional water is situated in the protein-lipid molecule complex as intramembrane bound water.
The ice formation and dehydration, melting, and rehydration of slowly cooled and rehydrated PM is well documented (19) in the temperature region 220–300 K. It was found that below 240 K water remaining bound to the membrane is nonfreezing. The dehydration of the PM occurred in the temperature range 245–268 K depending on initial hydration level. A similar dehydration was observed for PM at lower temperatures (21) when the sample was rapidly quenched i.e., very fast cooling rate. Heating after quenching leads to a decrease in lamellar spacing at ∼200 K from a value corresponding to 3–4 molecular water layers to a value corresponding to only two molecular water layers. Thus, the water beyond the first hydration layer is leaving the confined geometry of the interbilayer space to less confined areas where it can crystallize. When the ice starts to melt, the water returns to the confined layers.
We show here that dielectric and calorimetric response of hydrated purple membrane in the temperature region 120–300 K demonstrates a coupling between fast water motions and slower lipid/protein motions. Our results reveal a fast local β-like relaxation process of the water, which deviates from a low-temperature Arrhenius behavior at 190–200 K. This dynamic crossover coincides with the temperature where some of the intermembrane water in the most hydrated PM is leaving the interlayer spacing. We analyze the dielectric data by using a fine structure analysis of the whole energy landscape (22,23). Furthermore to achieve a more complete analysis of the kinetics of multiple relaxation processes, derivatives of the real part of the dielectric constant ɛ′ were calculated (24). The calorimetric measurements support our interpretations of the dielectric results and show a strong endothermic effect in the most hydrated system at the same temperature, as the interlayer spacing is reduced due to the partial loss of intermembrane water.
EXPERIMENTAL METHODS
A suspension of PM fragments prepared by Prof. D. Oesterhelt at the Max Planck Institute for Biochemistry in Martinsried, Germany, was used. Small amounts of the prepared H2O solution with PM fragments (PM concentration 6.7 mg/ml) were deposited directly onto the dielectric electrode plate. The solution was left to dry between consecutive deposits. When ∼15.4 mg PM had been deposited, it was left to dry for ∼12 h in ambient RH. The sample was alternated between a desiccator (for 3–10 h) with saturated KCl (86% RH) and ambient RH (∼30%). After 3 days of this alternated slow drying, the sample was a dry flat film.
To rehydrate, the sample was put into a desiccator at 100% RH. Equilibration proceeded for 5–7 days until the weight of the sample and sample holder did not vary by >0.5 mg. The gained water weight was ∼6.5 ± 0.2 mg, corresponding to h ≈ 0.4 (h = mass H2O/mass of PM). After measurement, the membrane was put into a desiccator at equilibrium with a saturated KCl solution for 6–10 days, giving 86% RH The membrane lost ∼3.3 ± 0.2 mg compared to the 100%-RH-equilibrated PM, corresponding to h ≈ 0.2.
The same PM fragments used for the dielectric low-frequency measurements (10−2–107 Hz) were also used for the dielectric high-frequency measurements (106–109 Hz) and the DSC measurements. Samples lost <10 wt % of the hydrated water content during the course of all measurements. Dry membrane was achieved by drying the membrane fragments in a vacuum oven for 9 days at 73°C. After this drying procedure the fragments had lost 30–35% of the 100%-RH weight.
To achieve a fast cooling rate, the samples in the sample cell were quenched, i.e., plunged directly into liquid nitrogen. Thereafter, the dielectric measurements started at 120 K. With this fast cooling, ∼3–4 layers of amorphous, “nonfreezing” metastable water (for the h ≈ 0.4 sample) and one to two layers (for the h ≈ 0.2 sample) is trapped between adjacent membrane layers (19). (The notation used in the text to distinguish between samples is h = 0.4 for the sample hydrated at 100% RH and h = 0.2 for the sample hydrated at 86% RH.)
Dielectric measurements were performed using a high-resolution Novocontrol (Hundsangen, Germany) Alpha system covering a broad frequency range (10−2–109 Hz) over the temperature range 120–300 K. In performing dielectric spectroscopy, the interaction of electromagnetic field with matter is investigated. For further reading about theory and applications, see Kremer and Schönhals (25). Isothermal (within ±0.02 K) frequency (f) scans of the complex dielectric function ɛ*(f) = ɛ′(f) – iɛ″(f) were performed at 5 K intervals. The measurements took ∼20 min for each temperature step. Electrodes with diameter 20 mm and 8 mm were used for the dielectric low-frequency and high-frequency measurements, respectively. In the high-frequency measurements, 3–4.2 mg of PM fragments were used.
DSC (Q 1000, TA Instruments, New Castle, DE) was performed on the PM sample hydrated at 100% RH using scan rates of 20 K/min and 30 K/min. A PM sample with a weight of 2.5 mg was enclosed in a DSC pan (Alumina (Brisbane, Queensland) plates, diameter ∼5 mm) and plunged directly into liquid nitrogen. The sample was held for 5 min at 93 K, after which the measurements were performed during the heating upscan. After the measurements the pan with PM was put in a vacuum oven at 50–60°C to dehydrate to a lower water content. When the sample had lost 13–14% of weight (i.e., when h had been reduced to ∼0.2) it was quenched as above, and measurements were run at 20 K/min and 30 K/min heating rates. Also, dry membrane was measured as described above. An empty pan was measured as reference, as described above, and with two additional heating rates of 10 and 40 K/min, to specifically study hydration effects on the pan surface.
RESULTS
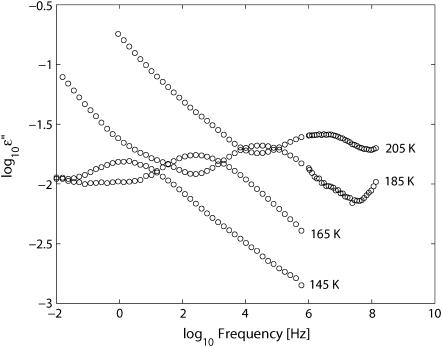
Fig. 1 shows the frequency dependence of the measured dielectric loss, i.e., the imaginary part (ɛ″) of the permittivity at the indicated temperatures for the h = 0.4 sample. The dielectric response features one clear dielectric loss peak, which moves to higher frequencies with increasing temperature. Above ∼165 K, direct-current conductivity and polarization effects show up and dominate the spectra at low frequencies. At low frequencies, partially obscured loss peaks are also seen for the higher temperatures.
FIGURE 1.
The imaginary part ɛ″(f) of the dielectric function ɛ*(f) of the quenched purple membrane with the hydration level h = 0.4. Selected temperatures show the temperature and frequency dependences. One clear relaxation process is seen over a wide temperature range.
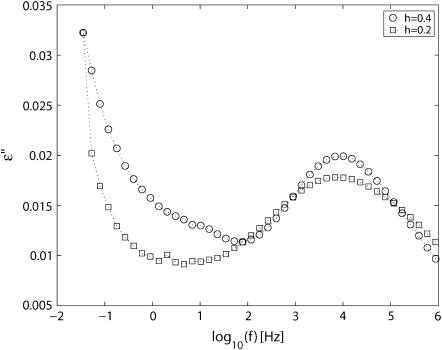
A comparison of the dielectric loss at 180 K is shown in Fig. 2 for the two hydration levels. The loss peak is at a similar position for the two hydration levels, although it is weaker and wider for the h = 0.2 sample. The peaks shown in Fig. 2 are both broad and essentially symmetric and were therefore curve-fitted using a Cole-Cole function. To account for conductivity and polarization effects, as well as other relaxation processes, at lower frequencies the data were described by one power law and at least two Cole-Cole functions.
 |
(1) |
In this equation, ω = 2πf, Δɛ = ɛs – ɛ∞, where ɛs and ɛ∞ stand for the static and high-frequency limiting values, respectively, of the dielectric constant, α is the shape parameter of the relaxation function, and τ is the relaxation time. The first term in Eq. 1 is due to conduction and polarization effects.
FIGURE 2.
Frequency dependence of ɛ″(f) at 180 K for PM at the two hydration levels h = 0.4 and h = 0.2.
Derivative technique reveals relaxation processes
To reveal more details from the frequency dispersion at low frequencies and high temperatures, where conductivity and polarization dominate, we used a one-dimensional derivative technique (24),
 |
(2) |
which approximately equals the Ohmic-conduction-free dielectric loss 
Fig. 3 shows the result of this technique for the sampling temperature 235 K. The derivative reveals additional processes that were hidden by the conductivity at this high temperature. Note that the contribution from polarization effects is dominant, since only a small difference in ɛ″ and  is observed for low frequencies.
FIGURE 3.
Frequency dependence of  compared with ɛ″ of the PM at 235 K and hydration level h = 0.4. After the one-dimensional derivative technique was used, additional processes that were hidden by the conductivity were revealed at higher temperatures and/or lower frequencies.
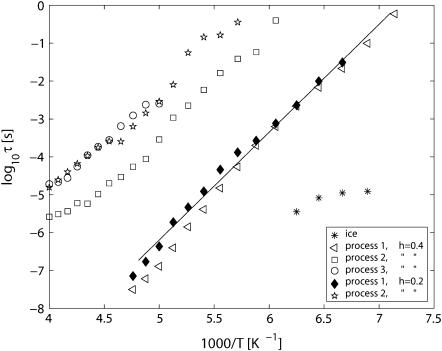
In Fig. 4, we show the relaxation times obtained from fits of the dielectric ɛ″ and  spectra. The very weak and fast process at low temperatures and high frequencies coincides, within experimental accuracy, with relaxation times obtained for ice (26). This ice process is only observed in a limited temperature range, and only for the h = 0.4 sample.
FIGURE 4.
Relaxation times obtained from fits of the dielectric ɛ″ spectra, and from the  spectra. Process 1 for both hydration levels shows a small deviation from Arrhenius temperature dependence close to 200 K and at a relaxation time of ∼10−6 s.
Process 1, the most pronounced relaxation process for both hydration levels, follows an Arrhenius temperature dependence until there seems to be a slight deviation from this behavior at T > 190 K and a relaxation time of ∼10−6s.
Process 2 for h = 0.4 shows a nearly Arrhenius behavior for temperatures up to ∼200 K and a relaxation time of ∼10−4s, after which its activation energy decreases with increasing temperature. Process 3, for h = 0.4, appears around 200 K and is present with an Arrhenius behavior up to 250 K, where it disappears. The data points for process 2 for h = 0.2 are scattered at low temperatures, but above 215 K this relaxation process is more clearly observed, and its temperature dependence is accurately described by the Arrhenius law up to 250 K, where this peak disappears.
Dielectric fitting parameters
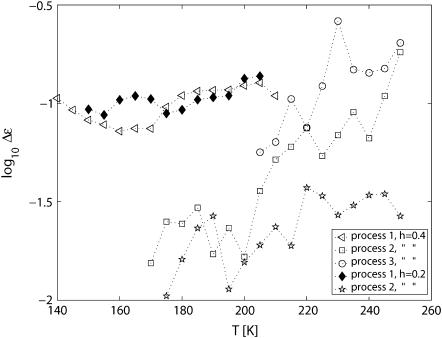
The dielectric relaxation strengths, Δɛ, of the processes obtained from the fits are shown in Fig. 5. The strong main process 1 has an almost temperature-independent relaxation strength for both hydration levels; only a weak increase above 190 K is observed. The other processes increase more strongly in relaxation strength above 190 K.
FIGURE 5.
Temperature dependence of the dielectric strength of the different processes observed in h = 0.4 and h = 0.2 PM.
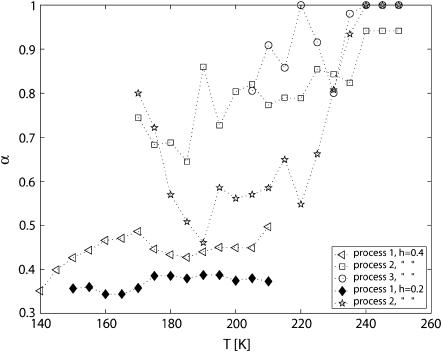
The shapes of the loss peaks, as parameterized by α in Eq. 1 are shown in Fig. 6. The main process (process 1) for h = 0.4 is very broad (α ≈ 0.4) and shows a slight increase (i.e., reduced peak width) with increasing temperature (at least up to 190 K). Possibly, compensation effects in the fitting procedure may explain the small drop of the α parameter at ∼190 K. The peak width of process 1 for h = 0.2 is even broader with α ≈ 0.35. Processes 2 and 3 are less broad and increase more rapidly with increasing temperature. At the highest temperatures the two slow processes are almost Debye-like (α = 1).
FIGURE 6.
Temperature dependence of the shape parameter α (see Eq. 1) on the processes in PM with h = 0.4 and h = 0.2.
Activation energy fine structure analysis
To gain more information about the dynamical processes in the hydrated PM, the dielectric measurements were subject to an activation energy fine-structure analysis (22,23), which invokes the ratio of the derivatives of the real part ɛ′(ω, T), with respect to temperature and the logarithm of the frequency:
 |
(3) |
Ea represents the apparent activation energy of the relaxation process that is most dominant at ω and T (ω is the applied frequency and T is the temperature). Thus, in the activation energy landscape, loss peaks from mechanisms with a high activation energy will be enhanced with respect to loss peaks from low activation energy, i.e., peaks due to main relaxations are accentuated compared to those of local relaxations (22).
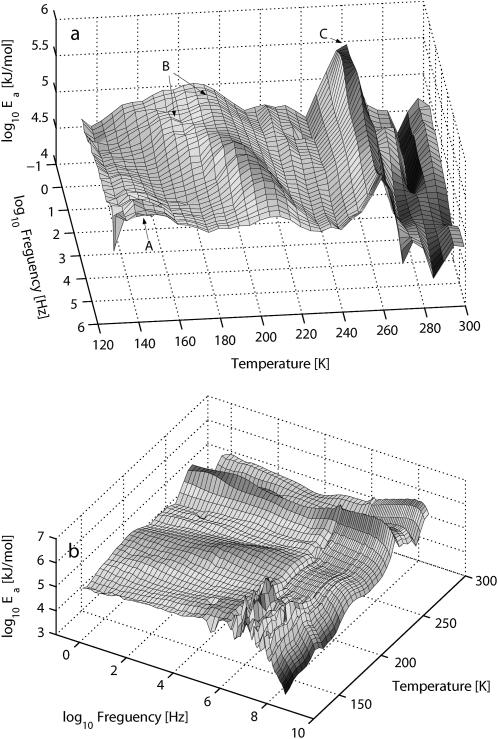
The calculated activation energy landscape Ea (ω, T) for h = 0.4 is shown in Fig. 7. From the figure it can be seen that there are three regions—A, B, and C—with increased activation energy. Region A is at low temperatures and high frequencies, with the peak situated above the MHz region, although the scattered data points make this low-temperature region of the energy surface uncertain. Region B, which is composed of two processes at lower frequencies, merges to one process at ∼200 K and 103 Hz. Region C, in the high-temperature region, depends on the frequency but is activated at a constant temperature close to 260 K. The process in region C continues into the GHz region, where region B is very weak.
FIGURE 7.
Activation energy landscape for h = 0.4 PM obtained from the fine-structure analysis given by Eq. 3. The data are shown in two different orientations in a and b. In b the high-frequency measurement up to 109 Hz is included.
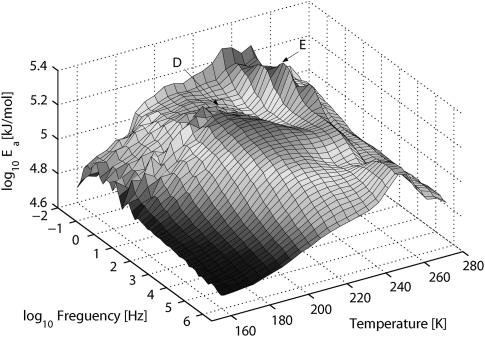
The energy surface for h = 0.2 in Fig. 8 reveals two regions, D and E. Region D is temperature- and frequency-dependent, and region E is frequency-dependent, activated at a high and constant temperature.
FIGURE 8.
Activation energy landscape for h = 0.2 PM obtained from the fine-structure analysis given by Eq. 3.
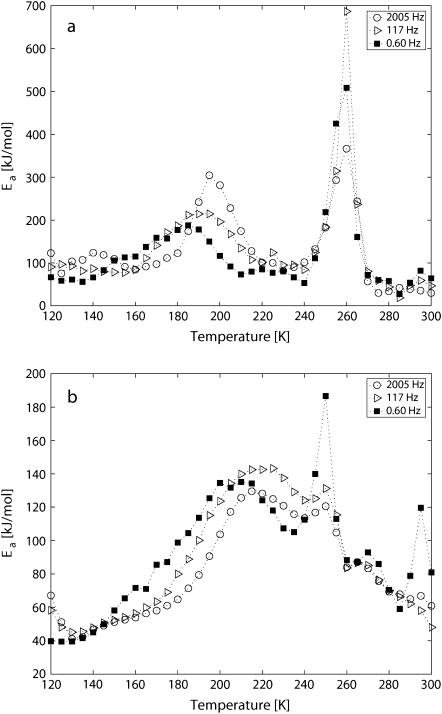
The temperature dependency is clearly seen in Fig. 9, which shows the local activation energy Ea at 0.60, 117, and 2005 Hz for the two hydration levels. We first look at h = 0.4, and the peak that is related to the slower process in region B of the energy landscape. For the lowest measured frequencies (e.g., 0.60 Hz), the onset of this process is at 185 K, but the highest intensity is ∼2000 Hz at a temperature of 195 K, when it merges with the other process in region B. Process C is at 260 K for all frequencies but the apparent activation energy is varying. The highest value is achieved for the lower frequencies, and when process B has its highest value around 2000 Hz, process C has decreased, but returns to higher apparent energy values at higher frequencies. Process A has an onset in the low-kHz frequency region at T = ∼140 K, but the maximum is situated in the MHz region, not shown.
FIGURE 9.
Local activation energies for (a) h = 0.4 from Fig. 7 and (b) h = 0.2 from Fig. 8 as a function of temperature for the frequencies 0.60, 117, and 2005 Hz.
With h = 0.2 (see Fig. 9 b), process D has a maximum for the lowest measured frequencies at 204 K. Process E is located at 250 K for all frequencies, but the value of Ea is highest at ∼0.6 Hz. A third process at the lowest temperatures is hardly noticeable in this less-hydrated sample.
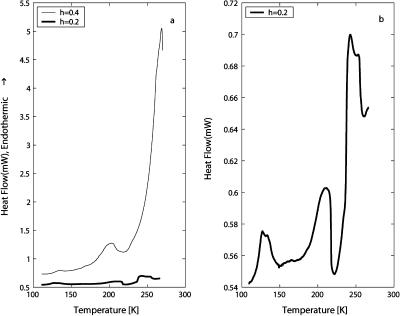
DSC heating scans for h = 0.4 and h = 0.2 are shown in Fig. 10. Note the difference in scale on the y axis for the two figures. An endothermic process is observed at ∼185–190 K for h = 0.4 and ∼200 K for the h = 0.2 sample, each followed by an exothermic heat release shortly afterward. Endothermic melting is seen at ∼260 K for h = 0.4 and just below 250 K for h = 0.2.
FIGURE 10.
(a) Comparison of DSC heating scans of quenched purple membrane with hydration levels of h = 0.4 and h = 0.2. The heating rate is 30 K/min for h = 0.4 and 20 K/min for h = 0.2. (b) Expanded scale for the h = 0.2 sample.
DISCUSSION
Biological membranes are not rigid, but instead behave more like liquid crystals. They exhibit a high flexibility, which enables thermally excited undulatory and peristaltic (thickness fluctuation) motions (27). In addition to these global three-dimensional deformations of the membrane surface, there are lipid motions on almost all timescales and membrane components that reorient and move around laterally in the system (28).
Here we discuss the temperature dependences of the dielectrically observed relaxation processes. In Fig. 4, we can distinguish four separate relaxation processes for h = 0.4 and two separate processes for h = 0.2. In Table 1 we show the major characteristics of the temperature dependences of these relaxation processes. The fast process for h = 0.4 was compared with relaxation times obtained for ice (26), and coincide within the experimental accuracy. We therefore attribute this process to crystalline water that left the interlayer space during the quenching. Process 1, the most pronounced relaxation process for both hydration levels, coincides well with previously obtained relaxation times for supercooled water in several hydrated systems (29). We therefore attribute process 1 in the system described here to a local relaxation of “nonfreezing” metastable water, most of it situated in the confined interlayer space. Less water in the system makes process 1 slightly slower and the small deviation from Arrhenius behavior occurs closer to 200 K. Process 2 appears to be more hydration-dependent than process 1, suggesting that process 2 may be due to motions from the regions that strongly attract water molecules, such as the polar lipid region (30,31). If the relaxation time of this process for the h = 0.4 sample is extrapolated to room temperature (295 K) a value around 10 ns is reached, in good agreement with the findings of Ermolina et al. (32). With less water present the kinetics of the lipids is reduced, resulting in a slower and weaker process 2 for the lower hydration level (see Figs. 4 and 5). Process 3 is activated above 200 K, that is, above the temperature where process 1 deviates from Arrhenius behavior. It is possible that the hydration water undergoes some change in character at this temperature, from viscous flow to a liquid-like dynamics, which increases the diffusion constant due to more frequent breaking and recombination of hydrogen bonds. This increased diffusion of the hydration water may cause the activation of process 3. The physical origin of process 3 is not clear, but assuming that the relaxation time increases with the size of the moving structural unit, it is reasonable to assume that this process is due to global motions in either the bR protein or the lipid part of the PM. The reason a similar third process is not observed for h = 0.2 may be that the total water content is too low to promote such a motion, at least on a similar timescale.
TABLE 1.
Relaxation characteristics from Fig. 4
| h = 0.4 | Process | Relaxation interpretation | Trange | τ100s | Tc |
|---|---|---|---|---|---|
| Ice | 130–165 K | ||||
| 1 | Water/strong local | 135–220 K | ∼127 K | ∼192 K | |
| 2 | Lipids/bound water | 155–260 K | ∼143 K | ||
| 3 | bR molecule/global motions | 200–260 K | |||
| h = 0.2 | |||||
| 1 | Water/strong local | 145–215 K | ∼127 K | ∼198 K | |
| 2 | Lipids/bound water | 170–255 K | ∼153 K |
Trange is the temperature range for which the relaxation process could be observed, τ100s is the temperature where the relaxation time has reached 100 s, and Tc is the Arrhenius to non-Arrhenius crossover temperature where τ = ∼10−6 s.
Considering the variety of scenarios for understanding the anomalous properties of supercooled water (9,33–35) in the difficult-to-probe region below 235 K, the temperature region between 200 and 230 K (27,36) may be physically the most interesting to study. In this study, it is possible that the changed dynamics occurs when the local β-relaxation is merged with a weak or invisible α-relaxation of the confined water (37), together with the change in character mentioned above. This interpretation is consistent with the fact that at 190–200 K the main water process is within the reported relaxation time τ, which marks a dynamic crossover in glass-forming liquids at 10−7 ± 1 s (38), where α and β relaxations commonly merge. Due to the confinement-prevented extension of a 3D hydrogen-bonded network that is necessary for the low temperature α-relaxation to be clearly observed (29,39) the β relaxation is dominant in this confined system (see Table 1).
The activation energy fine-structure analysis (22) of the data in Fig. 7 shows a merging of two processes in region B at ∼190–200 K. In Fig. 9 a, we see that the smaller process in region B becomes visible around 150 K at the lowest frequencies and shifts to a higher temperature with increasing thermal energy. It is likely that this process is strongly promoted by the intramembrane water, since with less water present in the h = 0.2 system, it is not clearly visible (see Fig. 8). Thus, the process is directly or indirectly related to the motion of the hydration water and probably caused by motions of either the lipids or the bacteriorhodopsin molecule. At ∼195 K and ∼2 kHz the small process merges with a slower broad process in region B (see Fig. 7). This slower process becomes visible around 185 K at the lowest frequencies and may be due to more global membrane and/or protein motions. The merging produces an enhanced activation energy peak in Fig. 9.
The peaks at 250 K for h = 0.2 and 260 K for h = 0.4 in the energy plots and calorimetric measurements show the melting of ice, which is formed during both the quenching and heating (at ∼200 K) procedures when some of the water leaves the intermembrane space and crystallizes outside the confinement. This melting increases the speed and amplitude of the dynamics even more. Thus, a thermodynamic transition occurs when some of the water leaves the intermembrane space, which is most likely responsible for the large endotherm in the DSC data (see Fig. 10) at ∼200 K for the most hydrated system. The extra amount of crystallized water is, furthermore, clearly seen in the DSC data at 260 K, where the sample with the higher hydration level produces a considerably more pronounced endotherm due to the melting of this ice. The system with h = 0.2 contains mainly tightly bound water, which is located in a first hydration layer or bound in intramembrane sites, leading to very small amounts of water leaving the intermembrane spacing and crystallizing during the quenching and heating processes. This stiffer system with less water also needs more thermal energy for the transition, raising the crossover temperature slightly to ∼205 K.
However, more pronounced surface effects make the melting appear at a lower temperature for the lower hydration level. It is also clear from the calorimetric measurements that the thermal effects are more pronounced in the more hydrated system and that the endothermic peaks are in close agreement to those seen in the activation energy fine-structure analysis (see Table 2).
TABLE 2.
A comparison of DSC and dielectric results from activation energy analysis
| Dielectric
|
DSC
|
||||
|---|---|---|---|---|---|
| h = 0.4 | Temperature (K) | Process | Frequency (Hz) | Remarks | Endotherm |
| 140 | A | low kHz | Peak position | ||
| 150 | Bsmall | ∼0.60 Hz | Peak position | ||
| 185 | Bbroad | ∼0.60 Hz | Peak position | 185–190 K | |
| 195 | B = Bbroad + Bsmall | ∼2000 Hz | Merging position | ||
| 260 | C | All measured frequencies | Peak position | ∼260 K | |
| h = 0.2 | |||||
| 204 | D | ∼117 Hz | Peak position | ∼200 K | |
| 250 | E | All measured frequencies | Peak position | ∼250 K | |
Several neutron spectroscopy studies have shown various dynamical onsets of motions on an experimental timescale of 10−12–10−10 s for PM hydrated in D2O. Onsets of anharmonic motions have been observed at temperatures from 150 to 270 K (13,19,20,31,40–42). In the case of an observed low-temperature onset at ∼150 K, a further increase in diffusive motions at 200–220 K was also observed (42) and above 250 K (19,20). However, a comparison to neutron spectroscopy data is not straight forward since the temperature dependence of the lipid/protein dynamics has not been determined in these studies. This would be necessary to fully investigate the coupling between the hydration water and the lipid/protein motions by comparing dielectric and neutron spectroscopy data. The only comparison that can be made is between the temperature at which the fastest motions of our observed water process reach relaxation times similar to the experimental timescale in neutron spectroscopy studies and the temperature at which significant quasielastic neutron scattering is observed. However, this is also difficult since the neutron spectroscopy studies have given onset values in the range 150–250 K, depending on the experimental energy resolution and momentum transfer (Q) range. Most likely, only very local motions are observed below ∼200 K and the more biologically important motions are observed at higher temperatures (on an experimental timescale of 1–100 ps). Due to the width of the water process (which means that some water molecules move on a timescale >1000 times faster than the average relaxation time at a given temperature), it is clear from our study that we also have water dynamics on a similar timescale in the same temperature range (200–250 K). Thus, the only conclusion we can draw from such a comparison is that some lipid/protein motions occur on a timescale similar to that of our water process (at least in the temperature range 200–250 K). It is furthermore evident from this study that considerably slower lipid/protein motions also occur (processes 2 and 3).
Finally, it should be noted that in the calorimetric measurements an endotherm was observed in the 125–129 K temperature region that could be reproduced in cyclic heating scans if the scan was stopped at ∼125 K before being recooled. If the scan was stopped at a higher temperature it was not reproducible. A higher heating rate gave a slightly higher onset temperature of the endotherm, and the same result was achieved with an empty DSC pan. It is therefore possible that this endotherm around 125–130 K is related to a glass transition (or some sort of β-relaxation) of amorphous solid water (43) that was built up on the surface of the quenched DSC pan when it was removed from the liquid nitrogen to the DSC. This glass transition would then be followed by an immediate crystallization at T ≥ 125 K, which explains why the endotherm cannot be reproduced once the temperature has exceeded this value. Further investigations are needed to clarify this issue.
CONCLUSION
The dielectric and calorimetric response of quenched hydrated purple membrane in the temperature region 120–300 K indicates a coupling between water dynamics and lipid/protein motions, although the motions are generally occurring on different timescales (i.e., considerably faster in water than in lipids and proteins). Processes related to lipid/protein motions are, however, strongly enhanced by increased water content. In fact, these processes are affected more by the water content than the relaxation process of the water itself, at least on the timescales studied here.
There is no indication that the observed water process corresponds to a cooperative α-relaxation of the confined water, despite the fact that the water is confined in only one dimension. Rather, the most pronounced dielectric process is probably due to a local (β) relaxation of the interlayer water, since the behavior of this process is almost identical to what has been found for a wide range of other water-containing systems (29). It appears that this β relaxation is essentially independent of the environment and seems to be a universal local process.
In the case of the fully hydrated membrane some kind of dynamic transition appears at a crossover temperature of ∼195 K. A possible merging of the β-relaxation with a nonobservable α-relaxation may occur for the interlayer water at 190–200 K. Furthermore, at this temperature a thermodynamic transition occurs, which generates a pronounced endothermic effect when some of the interlayer water leaves the membrane and crystallizes outside it, as has been reported previously (21). With less water, these effects are less pronounced and the crossover temperature is slightly increased to ∼205 K. The melting of the ice appears at 250–260 K, and further increases the dynamics.
The findings presented are likely to be of importance for a better understanding of biological systems, since water confined in a membrane is a key system in biology. The results contribute to the understanding of the dynamical coupling between hydration water and PM motions and their possible relation to bR function.
Acknowledgments
We thank D. Oesterhelt for supplying the membrane suspension. We also acknowledge L. Sjögren for valuable discussions.
Financial support from the Swedish Foundation for Strategic Research and the Swedish Research Council is gratefully acknowledged. J.S. is a royal Swedish Academy of Sciences Research Fellow supported by a grant from the Knut and Alice Wallenberg Foundation.
References
- 1.Jenniskens, P., S. F. Banham, D. F. Blake, and M. R. S. McCoustra. 1997. Liquid water in the domain of cubic crystalline ice Ic. J. Chem. Phys. 107:1232–1241. [DOI] [PubMed] [Google Scholar]
- 2.Yue, Y., and C. A. Angell. 2004. Clarifying the glass-transition behavior of water by comparison with hyperquenched inorganic glasses. Nature. 427:717–720. [DOI] [PubMed] [Google Scholar]
- 3.Johari, G. P. 2003. Calorimetric features of high-enthalpy amorphous solids and glass-softening temperature of water. J. Phys. Chem. B. 107:9063–9070. [Google Scholar]
- 4.Velikov, V., S. Borick, and C. A. Angell. 2001. The glass transition of water based on hyperquenching experiments. Science. 294:2335–2338. [DOI] [PubMed] [Google Scholar]
- 5.Starr, F. W., C. A. Angell, and H. E. Stanley. 2003. Prediction of entropy and dynamic properties of water below the homogeneous nucleation temperature. Physica A. 323:51–66. [Google Scholar]
- 6.Johari, G. P. 2002. Does water need a new Tg? J. Chem. Phys. 116:8067–8073. [Google Scholar]
- 7.Angell, C. A. 1991. Relaxation in liquids, polymers and plastic crystals–strong/fragile patterns and problems. J. Non-Cryst. Solids. 131:13–31. [Google Scholar]
- 8.Angell, C. A. 1995. Formation of glasses from liquids and biopolymers. Science. 267:1924–1935. [DOI] [PubMed] [Google Scholar]
- 9.Ito, K., C. T. Moynihan, and C. A. Angell. 1999. Thermodynamic determination of fragility in liquids and fragile-to-strong liquid transition in water. Nature. 398:492–495. [Google Scholar]
- 10.Green, J. L., and C. A. Angell. 1994. The protein-glass analogy: some insights from homopeptide comparisons. J. Phys. Chem. 98:13780–13790. [Google Scholar]
- 11.Parak, F. G. 2003. Proteins in action: the physics of structural fluctuations and conformational changes. Curr. Opin. Struct. Biol. 13:552–557. [DOI] [PubMed] [Google Scholar]
- 12.Zaccai, G. 2000. Moist and soft, dry and stiff: a review of neutron experiments on hydration-dynamics-activity relations in the purple membrane of Halobacterium salinarum. Biophys. Chem. 86:249–257. [DOI] [PubMed] [Google Scholar]
- 13.Fitter, J., R. E. Lechner, and N. A. Dencher. 1999. Interactions of hydration water and biological membranes studied by neutron scattering. J. Phys. Chem. B. 103:8036–8050. [Google Scholar]
- 14.Reat, V., R. Dunn, M. Ferrand, J. L. Finney, P. M. Daniel, and J. C. Smith. 2000. Solvent dependence of dynamic transitions in protein solutions. Proc. Natl. Acad. Sci. USA. 97:9961–9966. [DOI] [PMC free article] [PubMed] [Google Scholar]
- 15.Vitkup, D., D. Ringe, G. A. Petsko, and M. Karplus. 2000. Solvent mobility and the protein ‘glass’ transition. Nat. Struct. Biol. 7:34–38. [DOI] [PubMed] [Google Scholar]
- 16.Lee, A. L., and A. J. Wand. 2001. Microscopic origins of entropy, heat capacity and the glass transition in proteins. Nature. 411:501–504. [DOI] [PubMed] [Google Scholar]
- 17.Zaccai, G. 2000. How soft is a protein? A protein dynamics force constant measured by neutron scattering. Science. 288:1604–1607. [DOI] [PubMed] [Google Scholar]
- 18.Blaurock, A. E., and W. Stoeckenius. 1971. Structure of the purple membrane. Nat. New Biol. 233:152–155. [DOI] [PubMed] [Google Scholar]
- 19.Lechner, R. E., J. Fitter, N. A. Dencher, and T. Hauss. 1998. Dehydration of biological membranes by cooling: an investigation on the purple membrane. J. Mol. Biol. 277:593–603. [DOI] [PubMed] [Google Scholar]
- 20.Lehnert, U., V. Reat, M. Weik, G. Zaccai, and C. Pfister. 1998. Thermal motions in bacteriohodopsin at different hydration levels studied by neutron scattering: correlation with kinetics and light-induced conformational changes. Biophys. J. 75:1945–1952. [DOI] [PMC free article] [PubMed] [Google Scholar]
- 21.Weik, M., U. Lehnert, and G. Zaccai. 2005. Liquid-like water confined in stacks of biological membranes at 200 K and its relation to protein dynamics. Biophys. J. 89:3639–3646. [DOI] [PMC free article] [PubMed] [Google Scholar]
- 22.Steeman, P. A. M., and J. van Turnhout. 1994. Fine structure in the parameters of dielectric and viscoelastic relaxation. Macromolecules. 27:5421–5427. [Google Scholar]
- 23.van Turnhout, J., and M. Wübbenhorst. 2002. Analysis of the complex dielectric spectra. II. Evaluation of the activation energy landscape by differential sampling. J. Non-Cryst. Solids. 305:50–58. [Google Scholar]
- 24.Wübbenhorst, M., and J. van Turnhout. 2002. Analysis of the complex dielectric spectra. I. One-dimensional derivative techniques and three-dimensional modelling. J. Non-Cryst. Solids. 305:40–49. [Google Scholar]
- 25.Kremer, F., and A. Schönhals. 2002. Broadband Dielectric Spectroscopy. Springer, Berlin.
- 26.Bergman, R., J. Swenson, P. Jacobsson, and L. Börjesson. 2000. Dielectric study of supercooled 2D water in vermiculite clay. J. Chem. Phys. 113:357–363. [Google Scholar]
- 27.Safran, S. A. 2003. Statistical Thermodynamics of Surfaces, Interfaces and Membranes. Addison-Wesley, Reading, MA.
- 28.Lindahl, E., and O. Edholm. 2001. Molecular dynamics simulation of NMR relaxation rates and slow dynamics in lipid bilayers. J. Chem. Phys. 115:4938–4950. [Google Scholar]
- 29.Cerveny, S., G. A. Schwartz, R. Bergman, and J. Swenson. 2004. Glass transition and relaxation processes in supercooled water. Phys. Rev. Lett. 93:245702. [DOI] [PubMed] [Google Scholar]
- 30.Milhaud, J. 2004. New insight into water-phospholipid model membrane interactions. Biochim. Biophys. Acta. 1663:19–51. [DOI] [PubMed] [Google Scholar]
- 31.Fitter, J., and S. A. Verclas, R. E. Lechner, H. Seelert, and N. A. Dencher. 1998. Function and picosecond dynamics of bacteriorhodopsin in purple membrane at different lipidation and hydration. FEBS Lett. 433:321–325. [DOI] [PubMed] [Google Scholar]
- 32.Ermolina, I., G. Smith, Y. Ryabov, A. Puzenko, Y. Polevaya, R. Nigmatullin, and Y. Feldman. 2000. Effect of penetration enhancers on the dynamic behavior of phosphatidylcholine. J. Phys. Chem. B. 104:1373–1381. [Google Scholar]
- 33.Speedy, R. J. 1976. Isothermal compressibility of supercooled water and evidence for a thermodynamic singularity at −45°C. J. Chem. Phys. 65:851–858. [Google Scholar]
- 34.Tanaka, H. 2004. A new scenario of the apparent fragile-to-strong transition in tetrahedral liquids: water as an example. J. Phys. Condens. Matter. 15:L703–L711. [Google Scholar]
- 35.Sokolov, A. P., J. Hurst, and D. Quitmann. 1995. Dynamics of supercooled water: mode-coupling theory approach. Phys. Rev. B. 51:12865–12868. [DOI] [PubMed] [Google Scholar]
- 36.Fleissner, G., A. Hallbrucker, and E. Mayer. 1998. Increasing contact-ion paring as a supercooled water anomaly. Estimation of the fictive temperature of hyperquenched glassy water. J. Phys. Chem. 102:6239–6247. [Google Scholar]
- 37.Bergman, R., F. Alvarez, A. Alegria, and Colmenero. The merging of the dielectric α- and β-relaxations in poly(methyl methacrylate). J. Chem. Phys. 67:7546–7555, 1998. [Google Scholar]
- 38.Novikov, V. N., and A. P. Sokolov. 2003. Universality of the dynamic crossover in the glass-forming liquids: a ‘magic’ relaxation time. Phys. Rev. E. 67:031507. [DOI] [PubMed] [Google Scholar]
- 39.Swenson, J. 2004. The glass transition and fragility of supercooled confined water. J. Phys. Condens. Matter. 16:S5317. [Google Scholar]
- 40.Ferrand, M., W. Petry, A. J. Dianoux, and G. Zaccai. 1993. Dynamical transition of bacteriohodopsin in purple membranes revealed by neutron scattering: a relation between structure, dynamics and function. Physica A. 201:425–429. [Google Scholar]
- 41.Ferrand, M., A. J. Dianoux, W. Petry, and G. Zaccai. 1993. Thermal motions and function of bacteriohodopsin in purple membranes: effects of temperature and hydration studied by neutron scattering. Proc. Natl. Acad. Sci. USA. 90:9668–9672. [DOI] [PMC free article] [PubMed] [Google Scholar]
- 42.Fitter, J., R. E. Lechner, G. Bueldt, and N. A. Dencher. 1996. Temperature dependence of molecular motions in the membrane protein bacteriohodopsin from QINS. Physica B (Amsterdam). 226: 61–65.
- 43.Johari, G. P., A. Hallbrucker, and E. Mayer. 1991. The dielectric behavior of vapor-deposited amorphous solid water and of its crystalline forms. J. Chem. Phys. 95:2955–2964. [Google Scholar]


