Abstract
Modeling and simulation of the calcium signaling events that precede long-term depression of synaptic activity in cerebellar Purkinje cells are performed using the Virtual Cell biological modeling framework. It is found that the unusually high density and low sensitivity of inositol-1,4,5-trisphosphate receptors (IP3R) are critical to the ability of the cell to generate and localize a calcium spike in a single dendritic spine. The results also demonstrate the model's capability to simulate the supralinear calcium spike observed experimentally during coincident activation of the parallel and climbing fibers. The sensitivity of the calcium spikes to certain biological and geometrical effects is investigated as well as the mechanisms that underlie the cell's ability to generate the supralinear spike. The sensitivity of calcium release rates from the IP3R to calcium concentrations, as well as IP3 concentrations, allows the calcium spike to form. The diffusion barrier caused by the small radius of the spine neck is shown to be important, as a threshold radius is observed above which a spike cannot be formed. Additionally, the calcium buffer capacity and diffusion rates from the spine are found to be important parameters in shaping the calcium spike.
INTRODUCTION
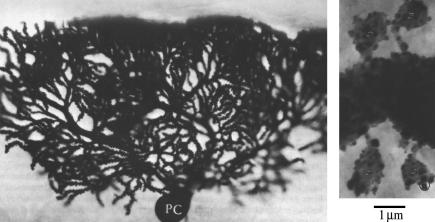
One cellular basis for learning is the phenomenon of synaptic plasticity that has been observed experimentally in neurons. Synaptic plasticity refers to a temporary or sustained depression or potentiation of the activity level of a synapse. An important form of synaptic plasticity related to motor-learning tasks such as the vestibular-ocular reflex, eye-blink conditioning, posture and locomotion adaptation, motor coordination, and hand/arm movement adaptation (1) is observed in cerebellar Purkinje cells (see Fig. 1 for a micrograph of a Purkinje cell). This particular form of synaptic plasticity, known as long-term depression (LTD), is a lasting decrease in the activity of the synapses between spines on the Purkinje cell dendrites and axons of neighboring granule cells, often referred to as parallel fibers (PF).
FIGURE 1.
Micrograph of a Purkinje neuron (left) and, at high magnification, a dendritic branchlet with four spines (right). (These images were taken from Palay and Chan-Palay, 1974 (59), with kind permission of Springer Science and Business Media.) The complex structure of the dendritic arbor is visible in the figure on the left. The figure on the right shows the attachment of the spines to the dendritic branchlet via the thin spine necks.
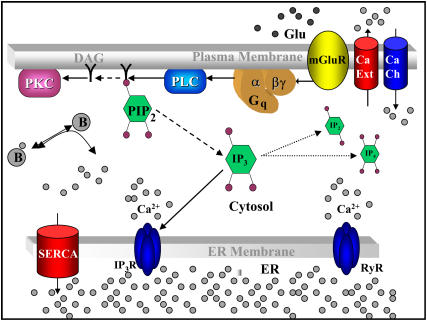
It has been shown experimentally that LTD is induced by the repeated association of the PF and climbing fiber (CF) inputs (2). A Purkinje cell is normally in contact with a single CF. Even though a single Purkinje cell may have as many as 175,000 PF synapses (3), a single dendritic spine, generally, has a synapse with only a single PF. Although activation of a lone PF, therefore, normally results in events occurring in a single spine of a Purkinje dendrite, activation of the CF produces a delocalized depolarization of the Purkinje cell membrane. Activation of either a PF or CF results in signaling events involving ionic calcium (Ca2+). In the case of the CF, the resulting depolarization of the Purkinje cell opens voltage-sensitive calcium channels, allowing for Ca2+ entry into the cytosol from the extracellular space. Activation of the PF results in release of glutamate across the synapse that is then detected by metabotropic glutamate receptors (mGluR) on the neighboring Purkinje spine. The signaling pathway depicted in Fig. 2 is then activated resulting in the release of Ca2+ from the endoplasmic reticulum (ER) mediated by the inositol-1,4,5-trisphosphate receptors (IP3R). Alpha-amino-3-hydroxy-5-methyl-4-isoxazolepropionate receptors on the membrane also detect glutamate and respond by opening channels that allow for entry of Ca2+ into the cytosol from the extracellular space.
FIGURE 2.
Cytosolic calcium handling after IP3-dependent release from the endoplasmic reticulum. The cascade of events is triggered when an agonist (glutamate (Glu)) binds to its receptor (mGluR) in the plasma membrane. This sets off a G-protein cascade (the G-protein complex is shown as αGq,βγ) that activates phospholipase C (PLC) that, in turn, hydrolyzes the glycerolphosphate bond in phosphatidylinositol-4,5-bisphosphate (PIP2). One product of this hydrolysis goes on to activate protein kinase C (PKC), whereas the other, IP3, is released from the membrane. The IP3 is free to diffuse through the cytosol, be degraded by phosphatases and kinases, and bind to its receptor (IP3R) in the endoplasmic reticulum (ER) membrane. The IP3R is a calcium channel that is triggered to open when IP3 is bound and when calcium itself binds to an activation site; a slower inactivation process also pertains to this channel. The calcium that is thus released binds to calcium buffers (B) in the cytosol including any fluorescent calcium indicators. Calcium influx through plasma membrane channels (CaCh) and release from the ER through the ryanodine receptor calcium channels (RyR) may also contribute to the cytosolic calcium changes. Note that RyR are not present in the spines of Purkinje cells but can be found in the dendrites. Finally, calcium is pumped back into the ER via a calcium ATPase (SERCA) and can also be extruded from the cell by a number of exchange and pump mechanisms (Ca ext).
Ca2+ elevation has been shown to be required for LTD induction in Purkinje cells. For example, experiments using Ca2+ chelators, such as EGTA (4,5) or BAPTA (2) resulted in blockage of LTD. Additionally, activation of Ca2+ channels by current step-elicited membrane depolarization induced LTD when combined with PF stimulation (2,6). Experiments in which the IP3R Ca2+ channels were inactivated (7) or otherwise not present (8) resulted in a lack of LTD, indicating that Ca2+ release from these internal stores is necessary for induction of LTD.
It has been found experimentally that coincident activation of the PF and CF inputs results in a supralinear increase in [Ca2+]. In other words, the change in [Ca2+] that is observed is significantly more than the sum of the Ca2+ responses obtained by exciting the PF and CF separately (3). It is hypothesized that this supralinear calcium response is the mechanism by which the cell detects the coincident activation of the PF and CF and is the first step in the mechanism leading to LTD. Under normal coincident activation conditions, these supralinear spikes may be confined to single spines.
The properties of the IP3R involved in this Ca2+ signaling pathway are likely to play a key role in the generation of the supralinear Ca2+ increase observed during coincident PF and CF activation. In addition to IP3 binding sites, the IP3R also contain Ca2+ binding sites that further activate Ca2+ release. This phenomenon is referred to as calcium-induced calcium release (CICR) (this is also observed in the Ryanodine receptors found in the Purkinje dendritic shafts, but not the spines themselves). Therefore, there is a positive feedback present in the system in which Ca2+ release stimulates further Ca2+ release. Note that there is an apparent threshold Ca2+ concentration above which an IP3R becomes increasingly deactivated but at a slower timescale (9–12).
The IP3R in Purkinje cells have certain, unique properties as compared to other neuronal or peripheral cells. Namely, the receptor density is significantly higher (13–16) and the sensitivity to IP3 is extraordinarily lower in vivo (17,18). It has been shown that the sensitivity of the Purkinje cell IP3R is similar to those of other cells when analyzed in isolation, leading to the hypothesis that the reduced sensitivity is due to interference by an inhibiting protein found in Purkinje cells (19,20). The physiological significance of these properties in terms of Ca2+ release before the onset of LTD is unclear at this time. For example, would similar Ca2+ release profiles be observed if the cell had a significantly lower IP3R density but a much higher sensitivity, i.e., the density and sensitivity common in other cells? It is possible that factors beyond those involved in the LTD-induction mechanism mandate these properties. Additionally, as is supported by the results of this work, it is likely that the CICR phenomenon at the IP3R is the basis of the coincidence detection mechanism that triggers LTD. Therefore, it is important that the unique properties and influence of the IP3R be correctly modeled and analyzed as part of a study of the Ca2+ dynamics that precede LTD.
When considering the origins of Ca2+ release patterns in Purkinje spines, the unique geometry of the spines must also be taken into account. It is hypothesized that the thin neck connecting a spine to its dendrite aids in localizing LTD to a particular spine by creating a significant diffusional resistance (21). This could aid in biochemically decoupling the spine from the parent dendrite (22–25), which is desirable since the Ca2+ signaling events can thus be made specific to a single synapse. In summary, the available data in the literature implies that the Purkinje cell's ability to produce the supralinear behavior may rely on a variety of biochemical and geometrical effects.
Given the importance of Ca2+ signaling to the induction of the mechanisms leading to LTD, the objective of this work is to use mathematical models of a Purkinje cell that focus on the relevant Ca2+ signaling networks to investigate the significance of certain unique characteristics of the Purkinje cell, such as the sensitivity and density of the IP3R and the geometry of the spines, in terms of LTD induction. The results of this work will aid in identifying those features of the cell that are most critical to the onset of LTD, including consideration of both biochemical and geometrical effects. The wide availability of experimental data on calcium dynamics in Purkinje cells makes such a modeling study feasible.
A recent modeling study of Purkinje spine Ca2+ signaling (26) contained analysis of a compartmental model of a single spine that did not consider diffusion out of the spine into the adjacent dendritic shaft or the unique sensitivity and density of the IP3R. These are key differences between the models proposed here and those in the other work. Indeed, it is these features of Ca2+ signaling in Purkinje cell spines that set it apart from other systems. As will be shown, without taking into account the unique in vivo sensitivity of the IP3R, significant Ca2+ release would be produced at low [IP3] in direct disagreement with available experimental data (e.g., (17)). This combination of biochemical and geometric features also assures that the signal is confined to the activated spine. Additionally, as shown experimentally by Noguchi et al. (25) in pyramidal neurons, diffusion through the spine neck is an important factor in spine Ca2+ signaling, suggesting that dynamic spine morphology can be a powerful modulator of synaptic plasticity. The modeling results shown here demonstrate that the spine neck diameter can behave as a sensitive switch for the Ca2+ signal.
In the next section, the models used in this work are introduced and the sources for all parameter values identified. In the subsequent sections, simulation results are presented for a one-dimensional spatial model, a compartmental model, and a two-dimensional spatial model. These results demonstrate the models' ability to rationalize the high density and low sensitivity of the spine IP3R, to generate the supralinear Ca2+ spike, and to elucidate the mechanisms underlying the supralinear behavior. In the last section, conclusions are drawn and future research directions discussed.
MODEL DEVELOPMENT
The models developed in this work are based on an assembly of components from our own previous work and those available in the literature relating to cellular calcium dynamics. Additionally, many parameter values are taken from a variety of pertinent references and are summarized in Table 1. The modeling and simulation are performed using the Virtual Cell (http://vcell.org) biological modeling framework (27,28). All models used in this work are publicly available in the Virtual Cell. To access, view, or copy the models described in this article, log on to the Virtual Cell (free registration is required), and go to File → Open → BioModel. In the BioModel Database dialog, the two-dimensional and compartmental models can be found in the Shared Models directory under “hernjak.” The one-dimensional model is similarly available as a MathModel. In what follows, the features shared by all of the models are introduced and the sources for the parameter values discussed. A concise summary of all of the models is provided in the Appendix.
TABLE 1.
Parameters and initial conditions used in the simulations
| Parameter | Description | Value | Notes |
|---|---|---|---|
| rs (r1) | Spine radius | 0.29 μm | (49) |
| rn | Spine neck radius | 0.1 μm | (49) |
| r2 | Dendrite radius | 1 μm | (30) |
| ln (l12) | Spine neck length | 0.66 μm | (49) |
| s | Linear spine density | 14 μm−1 | (49) |
| l2 | Length of adjacent dendrite compartment (compartmental model) | 27.98 μm | Calculated |
| l23 | Distance between adjacent and distal dendrite compartments | 5.63 μm | Calculated |
| DCa | Ca2+ diffusion coefficient | 223 μm2 s−1 | (51) |
| DIP3 | IP3 diffusion coefficient | 283 μm2 s−1 | (51) |
| DPV | PV diffusion coefficient | 43 μm2 s−1 | (30) |
| DCD28k | CD28k diffusion coefficient | 28 μm2 s−1 | (30) |
| DCG | CG diffusion coefficient | 15 μm2 s−1 | (52) |
| kon,CD28k,high | Forward rate coefficient | 5.5 μM−1 s−1 | (29) |
| kon,CD28k,med | Forward rate coefficient | 43.5 μM−1 s−1 | (29) |
| koff,CD28k,high | Reverse rate coefficient | 2.6 s−1 | (29) |
| koff,CD28k,med | Reverse rate coefficient | 35.8 s−1 | (29) |
| kon,PV,Ca | Forward rate coefficient | 107.0 μM−1 s−1 | (30) |
| kon,PV,Mg | Forward rate coefficient | 0.8 μM−1 s−1 | (30) |
| koff,PV,Ca | Reverse rate coefficient | 0.95 s−1 | (53) |
| koff,PV,Mg | Reverse rate coefficient | 25.0 s−1 | (53) |
| kon,CG | Forward rate coefficient | 430.0 μM−1 s−1 | (30) |
| koff,CG | Reverse rate coefficient | 140.0 s−1 | (54) |
| a | IP3R Ca2+ release amplitude (abundance) | 21,000.0 μM s−1 | 10× the value in (41) |
| [Ca2+]er | ER [Ca2+] | 400 μM (constant) | (55) |
| dCa | IP3R Ca2+ binding constant | 0.3 μM | (41) |
| dIP3 | IP3R IP3 binding constant | 20.0 μM | 10× the value in (41) |
| Vmax | Amplitude of SERCA pump intake | 3.75 μM s−1 | (41) |
| ker | Pump binding constant | 0.27 μM | (56) |
| L | Leak constant | 0.12 μM s−1 | (41) |
| K1 | Dissociation constant for IP3R | 0.2 μM | (41) |
| K2 | Forward rate coefficient, Ca2+ binding to inactivating IP3R site | 2.7 μM−1 s−1 | (41) |
| τ1 | Start time of CF Ca2+ influx | 0.1 s | (30) |
| τ2 | End time of CF Ca2+ influx | 0.105 s | (30) |
| Jch,1 | Magnitude of CF Ca2+ entry signal in the spine | 13.25 s−1 | (30) |
| Jch,2 | Magnitude of CF Ca2+ entry signal in the adjacent dendrite compartment | 6.25 s−1 | (30) |
| [Ca2+]ex | Extracellular [Ca2+] | 1.0 mM (constant) | (57) |
| Jp | IP3 pulse magnitude | 80.0 μM s−1 | Calculated |
| τ3 | Time between IP3 pulses | 0.012 s | (10) |
| K3 | IP3 pulse decay factor | 1.188 s−1 | (41) |
| Kdeg | IP3 degradation rate | 0.14 s−1 | (41) |
| P | Ca2+ pumping rate | 8.0 μm s−1 | (46) |
| [Ca2+]T | Threshold [Ca2+] | 0.2 μM | (46) |
| [Ca2+]o | Initial [Ca2+] | 0.045 μM | (58) |
| [IP3]o | Initial [IP3] | 0.16 μM | (41) |
| [PV]o | Total [PV] | 40 μM | (30) |
| [CD28k]o | Total [CD28k] | 40 μM | (30) |
| [CG]o | Total [CG] | 160 μM | (30) |
| [Mg2+] | [Mg2+] | 590 μM (constant) | (30) |
The following species are present in the models: Ca2+, IP3, calbindin (CD28k), parvalbumin (PV), and magnesium (Mg2+). CD28k and PV are buffer species that bind Ca2+. PV also has a strong affinity for Mg2+, thus Mg2+ is explicitly included in the model to effectively diminish the Ca2+-buffering capacity of PV. The general form of the expression used to model the Ca2+ dynamics is given as
 |
(1) |
Each of the terms on the right-hand side of Eq. 1 will be discussed individually in what follows. Because the methodology for modeling diffusion differs among the models developed in this work, discussion of the different forms of Rdiffusion can be found in the corresponding sections below.
The rate of binding of Ca2+ to a buffering species (X) is modeled as
 |
(2) |
where XB denotes the Ca2+-bound form of the buffer. CD28k is found to contain both medium-and high-affinity binding sites (29), accounted for in this model under the assumption that the sites bind independently of each other. The overall Rbuffering term in Eq. 1 is the summation of the buffering rates for all of the buffers, each modeled as in Eq. 2. Parvalbumin and calbindin are the only endogenous buffers considered in this work. According to the experimental data of Schmidt et al. (30), the intracellular concentrations of other buffers (e.g., calmodulin) are considerably lower than those of parvalbumin and calbindin and provide small contributions to the overall Ca2+ dynamics in the system. Similarly, the role of nonprotein buffering species is also likely to be negligible, given the conditions explored in this work.
The behavior of the IP3R is modeled using the formulation of Li and Rinzel (31). This model, which is a simplified version of the DeYoung-Keizer (32) model, also accounts for the CICR behavior that the receptor demonstrates. Although a number of other models for calcium release from the ER have been proposed (e.g., the models of (33–40)), the Li-Rinzel model is adequate for this work's analysis as it represents the critical dynamics of the calcium release via the IP3R in a compact form. The Li-Rinzel model for Ca2+ flux across the ER membrane (including the behavior of SERCA pumps at the ER and an allowance for Ca2+ leakage from the ER) is defined as
 |
(3) |
The variable h is the probability of an inhibition site on the receptor being unoccupied. For the purposes of this work, the most important parameters in the model are a and dIP3. The a parameter corresponds to the density of IP3R in the system, with large values of a indicating a high density of IP3R. The value of dIP3 controls the sensitivity of the IP3R to [IP3], with increasing values of dIP3 indicating decreased sensitivity of the IP3R to [IP3] changes. Physically, dIP3 is the dissociation constant for IP3 binding to the channel. The dCa parameter performs the same task in determining the sensitivity of the CICR behavior to changes in [Ca2+]. Although most of the Li-Rinzel model parameters are taken to be the values obtained from modeling studies of other neurons (such as neuroblastoma cells (41)), the values for a and dIP3 were both increased to correspond to the increased density and decreased sensitivity of the IP3R found in Purkinje cells. Implicit in the model described by Eq. 3 is the assumption that the concentration of Ca2+ in the ER is constant. Although researchers have adapted the Li-Rinzel model to account for varying [Ca2+]ER (e.g., (42–44)), the assumption of constant [Ca2+]ER is appropriate for this work, since the timescales of the Ca2+ dynamics investigated here are very fast relative to the proposed timescales for Ca2+ dynamics in the ER and the magnitudes of the Ca2+ changes that are observed in the cytosol are more than an order-of-magnitude less than [Ca2+]ER. Also note that the magnitude of the leakage term in Eq. 3 is normally very small relative to the other terms, and likely plays a negligible role; however, it is left in the equation for completeness.
To simulate the effect of depolarization of the Purkinje cell by the CF, expressions of the following type are added to the dendrite and spine compartments:
 |
(4) |
(where τ1 < τ2). [Ca2+]ex is the concentration of Ca2+ in the extracellular space and the Jch parameter controls the magnitude of the Ca2+ entry rate (see Table 1). The two conditional statements in Eq. 4 are equal to 1 when true and 0 when false. Therefore, this expression allows for a pulse of Ca2+ to flow between the extracellular space and the cytosol during the time period τ1 < t < τ2. Experimental data showing [Ca2+] changes during CF activation in Purkinje cells (30) were used to find realistic Jch values for the spine and adjacent dendrite regions.
The production of IP3 due to activation of the PF is modeled using techniques developed in a previous modeling study of neuroblastoma cells (41). Based on the experimental observations of Fink et al. ((41), Fig. 4), activation of mGluR is modeled as an exponentially decaying flux of IP3 from the membrane of a spine. Multiple activations produce multiple pulses of IP3. Activation of a PF does not trigger IP3 production in the dendrite shaft under normal conditions, but generates IP3 only in the spine. IP3 can, however, diffuse into the dendritic shaft through the spine neck, but this geometrical feature will be described in the next section. The IP3 pulses are modeled as
 |
(5) |
where n is the number of pulses, τ3 is the time between pulses, and Jp and K3 control the pulse magnitudes and decay times, respectively. Based on commonly adopted experimental protocols for induction of LTD (e.g., Wang et al. (3)), n was chosen as 12 with a time between pulses (τ3) of 0.012 s, corresponding to a frequency of ∼80 Hz (10). The second term in Eq. 5 accounts for the degradation of IP3 to IP2 and IP4 where Kdeg is the degradation rate and [IP3]o is the nominal concentration of IP3. The value for Kdeg was obtained from experimental data included in a modeling study of neuroblastoma cells (41). It is possible that the value for Kdeg in Purkinje cells may differ significantly from the neuroblastoma values, but data does not exist to support the use of other values of this parameter.
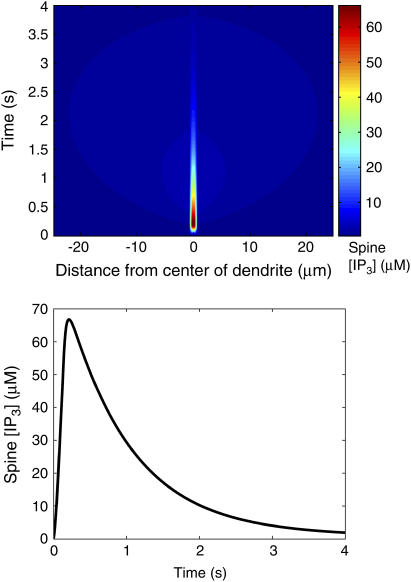
FIGURE 4.
Kymograph showing distribution of IP3 in the spines along the dendrite during PF activation of the center spine (top). IP3 profile in the center spine during simulated PF activation (bottom). Data obtained from the one-dimensional model.
In regard to IP3 dynamics, an experimentally validated basis does not exist for the usage of expressions more detailed than Eq. 5 in modeling the IP3 response to PF activation. However, we have examined whether our system might be sensitive to certain unknown effects. For example, it has been shown that the rate of IP3 conversion to IP4 via 3-kinase is sensitive to [Ca2+] (45). Using Eq. 3 from Dupont and Erneux (45) and their parameters, an estimate of the rate of degradation of IP3 via 3-kinase at the peak concentrations of IP3 and Ca2+ observed in this work is 0.49 μM/s. Because the rate of diffusion of IP3 from the spine is on the order of 102–103 μM/s, any degradation effect will be minimal. We have performed sensitivity analysis to examine this issue further (see Supplementary Material) and have confirmed that [Ca2+] is only weakly sensitive to Kdeg given the conditions explored in this work. Similar arguments demonstrate that any Ca2+-sensitivity of the PLC isoform in Purkinje cells would have a negligible effect on the IP3 profile, particularly since the IP3 pulses required to induce the supralinear Ca2+ behavior are very localized and occur over short time-windows. Again, sensitivity analysis (included in the Supplementary Material) provides quantitative support for this argument.
ONE-DIMENSIONAL SPATIAL MODEL
The first model considered in this work is a one-dimensional spatial model of a dendritic segment of length 500 μm, as shown in Fig. 3. The results discussed in this section will demonstrate, via thorough modeling of spatial effects, that the relevant Ca2+ dynamics are localized to the activated spine under normal conditions. The governing equation for diffusion and reaction for each species in the dendrite has the form of the standard reaction-diffusion partial differential equation (PDE),
 |
(6) |
where [X]d represents the concentration of species X in the dendrite, z represents the length dimension, and Ri refers to the rates of the buffering reactions and other pertinent reactions as discussed in the previous section. Species diffusion constants (DX) were obtained from experimental data (30). The validity of this one-dimensional model depends on the assumption that the dimensions of the spines and the radius of the dendrite are small enough such that no spatial gradients exist in those directions. Thus, only diffusion along the length of the dendrite needs to be explicitly considered. The large length of the geometry was selected to make sure that boundary conditions have no effect on the solution. A standard Fick's law expression is used to account for diffusion from a spine to the adjacent dendritic shaft region through the diffusion barrier posed by the spine neck. Specifically, the change in concentration of species X in a spine due to flux between the spine and a point along the dendrite adjacent to the spine and the various flux rates discussed in the previous section is modeled using an expression such as
 |
(7) |
where ln is the length of the spine neck, An is the cross-sectional area of the spine neck  Vs is the volume of the spine
  is the concentration of the species in the proximal dendrite, and [X]s is the concentration of species X in the spine. Production of IP3 due to PF activation (as in Eq. 5) is only simulated in the spine at the center of the dendrite so that the Ca2+ dynamics resulting from stimulation of a single spine can be studied. This model also accounts for Ca2+ extrusion through the plasma membrane using
 |
(8) |
where σ is the surface/volume ratio of either the spine or the dendritic shaft, P is the rate of pumping, and [Ca2+]T is a threshold Ca2+ concentration below which the pumps are inactive. Equation 8 was obtained from the work of Fink et al. (41) and is based on the experimental observations of Herrington et al. (46), which indicate that the pumping mechanisms behave linearly at moderate [Ca2+] above a threshold value. Because high values of [Ca2+] are reached only for very short time-intervals in this work, this approximation is sufficient. This approximation may tend to overestimate pumping rates at some values of [Ca2+] since pumps are known to saturate. Likewise, the effect of other species' concentrations (e.g., Mg2+) on the capacity of the pumps is ignored for similar reasons. The overall system of equations is solved by the Virtual Cell through use of a finite volume algorithm with computation points evenly distributed at 0.5-μm intervals along the dendrite.
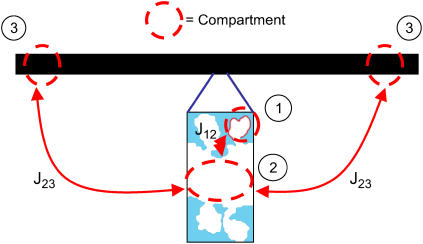
FIGURE 3.
Visualization of the geometry used to simulate calcium dynamics in a dendritic spine. For the one-dimensional spatial model (see article), the diffusion along the dendrite (J23) is modeled explicitly using the PDE in Eq. 6 and the dynamics in the spines is modeled using Eq. 7. For the compartmental model (see article), the first two of the following three compartments are each modeled by a set of ordinary differential equations: 1, The spine under consideration; 2, The region of the parent dendrite directly adjacent to the spine; and 3, The distal regions of the dendrite. Species concentrations in compartment 3 are held constant so that this compartment acts as a sink for material that enters compartment 2. Compartment 1 is modeled as a sphere with volume  where r1 (rs) is the radius of the spine. Compartment 2 is modeled as a cylinder with volume
  where r2 is the radius of the dendrite and l2 is the length of the segment of the dendrite encompassing compartment 2. The fluxes, Jij, between compartments are modeled using Fick's law as shown in Eq. 7.
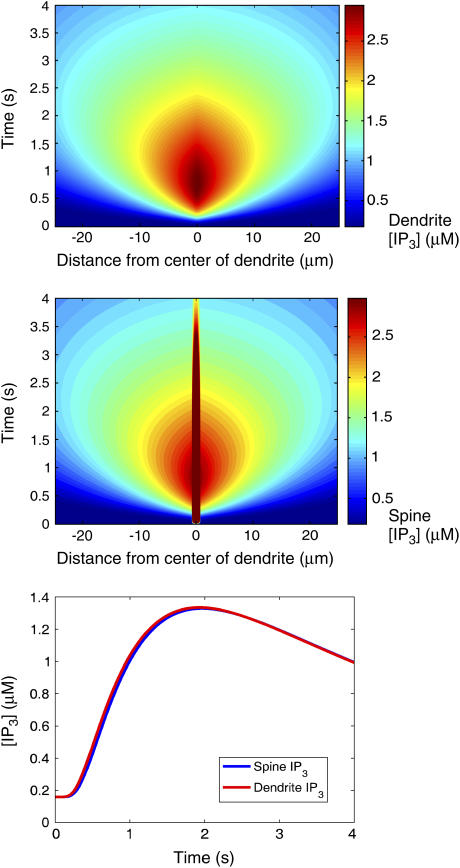
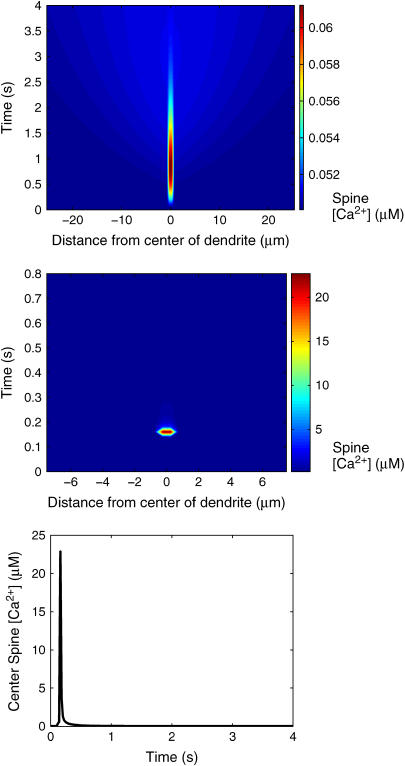
Fig. 4 shows the IP3 profile in the activated spine region (−0.5 μm < z < 0.5 μm) as a function of time as well as a kymograph (a plot of the spatial concentration profile as a function of time) showing [IP3] in neighboring spines distributed along a 50-μm central dendrite segment as a function of time. During PF activation, the level of IP3 in the activated spine region reaches a maximum of nearly 70 μM. The kymograph shows that the pulses of IP3 affect only the [IP3] in the spine region that is activated by the PF. Spines beyond that region do not show an appreciable accumulation of IP3, indicating that IP3 accumulates much more rapidly in the activated region than it can diffuse out into the adjacent dendrite and spines. Fig. 5 contains a kymograph showing the spatial distribution of IP3 in the dendrite during PF stimulation. The results show that IP3 disperses along the dendrite and never reaches a concentration >3 μM. For comparison, Fig. 5 also includes the kymograph from Fig. 4 (i.e., spine [IP3]) plotted with a color scale corresponding to that used to plot the dendrite [IP3] data as well as timecourses showing spine and dendrite [IP3] at 5 μm to the right of the activated spine. The similarities between the data in the two kymographs and the timecourses show that the neighboring spines reach [IP3] similar to those in the dendrite, indicating that the diffusion barrier caused by the spine necks is insufficient to prevent equilibration of IP3 over long timescales. Fig. 6 shows the resulting spine [Ca2+] kymograph also showing that Ca2+ release is effectively restricted to the activated spine. Note that the Ca2+ elevation in even the central activated spine only amounts to 10 nM. Also shown in Fig. 6 is a spine [Ca2+] kymograph obtained during coincident activation of the PF and CF. Although the concentration in the activated spine reaches ∼22 μM (the supralinear effect that will be discussed further in the following section), note that the neighboring spine regions are still generally unaffected.
FIGURE 5.
(Top) Kymograph showing the spatial distribution of IP3 in the dendritic shaft during PF activation of the center spine. (Middle) The kymograph from Fig. 4 is shown again but with the color scaling set to correspond to that of the top figure (hence the color saturation for the center spine data) for comparison. (Bottom) Comparison of the [IP3] time courses obtained in the spine and dendrite segment at 5 μm to the right of the center spine. The results show that the neighboring spines reach similar [IP3] as the adjacent sections of the dendrite, meaning that the diffusion barrier caused by the spine neck is not sufficient to block IP3 entry at such slow time scales. Data obtained from the one-dimensional model.
FIGURE 6.
(Top) Kymograph showing the spatial distribution of Ca2+ in the spines during PF activation of the center spine. (Middle) Kymograph showing the spatial distribution of Ca2+ in the spine during coincident PF and CF activation. Ca2+ spikes rapidly in the center spine and then quickly returns to steady-state values, as shown in the timecourse of [Ca2+] in the center spine obtained during coincident activation of the PF and CF (bottom). The kymographs demonstrate that Ca2+ does not appreciably spread to other spines during PF or coincident PF and CF activation. Data obtained from the one-dimensional model.
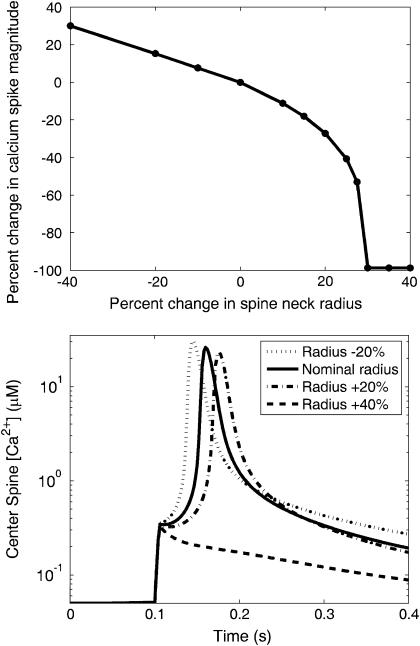
The results shown in the kymographs demonstrate that the particular geometry of the dendritic spines aids in compartmentalizing signals due to the diffusional resistance created by the spine neck (21). By adjusting the neck radius parameter in the model, the magnitude of this effect can be quantified. Fig. 7 shows data that demonstrate the effect of the spine neck radius on the magnitude of the Ca2+ spike generated by coincident activation of the PF and CF. The data show that as the neck radius is increased, the magnitude of the Ca2+ spike decreases. This is in line with intuition, since increasing the neck radius should decrease the resistance to diffusion for material leaving the spine (21,47). Interestingly, when the spine neck is increased by >30%, an apparent threshold is reached, since the Ca2+ spike is quickly extinguished. This switch behavior demonstrates the strongly nonlinear behavior of the model in the parameter space necessary to observe the supralinear Ca2+ spike. These results suggest how the dynamic morphology that has been observed in two-photon recordings of spines (21,47) could serve as an important mediator of LTD.
FIGURE 7.
(Top) The percent change in Ca2+ spike magnitude during coincident PF and CF activation as a function of the percent change in the radius of the spine neck. (Bottom) Several Ca2+ timecourses obtained during coincident activation with varying neck radii. As seen in the figure on the left, neck radii increased by 30% or more prevent a substantial Ca2+ spike from being formed. Data obtained from the one-dimensional model.
Because this one-dimensional model demonstrates that the important events under consideration in this work are restricted to a single spine, we decided to develop a simpler compartmental model that would capture the key process of diffusion down the dendrite without solving PDEs. This model, described in the next section, facilitates a detailed analysis of the interplay of biochemical, electrophysiological, and geometrical parameters in shaping the spine Ca2+ signal.
COMPARTMENTAL MODEL
In this section, simulation results are presented that demonstrate the ability of a compartmental model to generate a supralinear Ca2+ spike given physically realistic Ca2+ signals originating from the PF and CF inputs. Additional simulation results are then presented that demonstrate the sensitivity of the system to certain biochemical features. Results are also shown that elucidate the mechanisms leading to the supralinear Ca2+ spike. In total, the results demonstrate that a wide range of biochemical and geometrical effects act in concert to allow the system to generate the supralinear Ca2+ signal that triggers the LTD process.
The model used in this section focuses on events that occur in a single spine and in the region of the parent dendrite directly adjacent to the spine. The modeling approach is summarized in Fig. 3. As seen in the figure, the model treats the region as consisting of three well-mixed compartments: the spine under consideration, the region of the parent dendrite directly adjacent to the spine, and a compartment representing the combined regions found at the distant ends of the dendrite. Material is allowed to diffuse from one region to the next as depicted in the diagram in Fig. 3. Species' concentrations in the distal dendrite regions are held constant, implying that the distal regions are sufficiently far from the proximal dendrite that they act as a sink for material coming from the spine. This approximation is justified by the results of our model of a 500-μm length of dendrite, as described in the previous section.
Flux from one compartment to the next is modeled assuming diffusion occurs according to Fick's law, as represented in Eq. 7. To determine the effective distance from the proximal dendrite to the distal dendrite (l23), the one-dimensional PDE model of diffusion along a dendrite was used to identify the value of the length parameter that yields the best agreement between the compartmental model and the PDE model. A key benefit of the use of the ODE model is the significant reduction in model complexity and computational cost with only a small loss in fidelity. Further details about this model may be found in the Appendix.
In all simulations, 160 μM Calcium Green-1 (CG) is included in the model as an indicator dye to provide better comparison of the results to experimental data. In the analysis, the indicator is treated as a buffering species and, in most cases, free [Ca2+] is reported. Using the Virtual Cell modeling framework, the relative fluorescence change, ΔF/F, can also be calculated based on the fluorescence properties of CG versus CG bound to Ca2+. In any event, it is important to keep the indicator species in the model because, due to its buffering capability, it may have an effect on the magnitude of the Ca2+ signals observed (41).
Inducing the supralinear Ca2+ signal
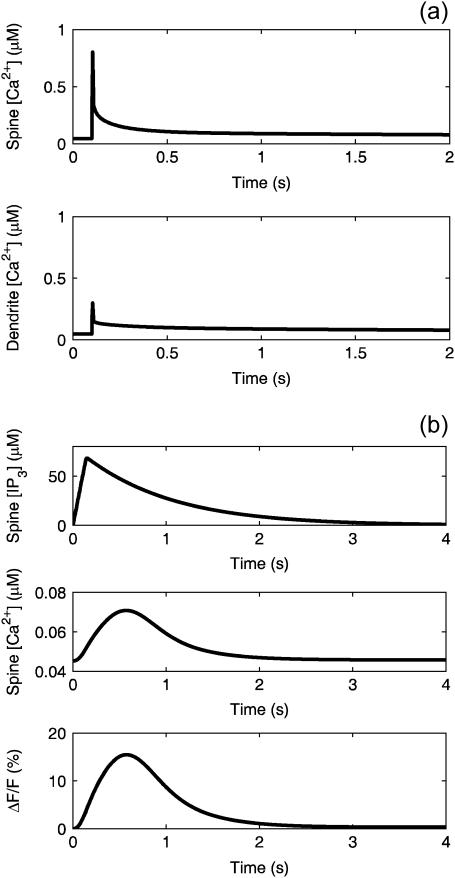
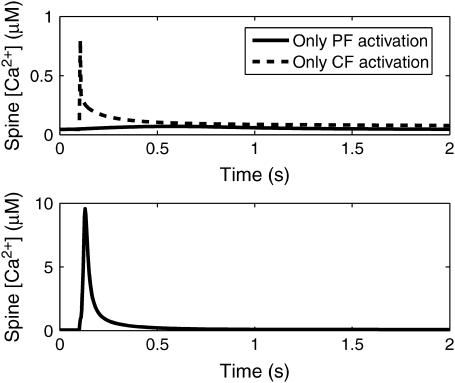
Fig. 8 a shows the Ca2+ profiles in the spine and adjacent dendrite compartments during the simulated CF activation with no PF stimulation. These results were obtained by adjusting the Jch parameters to match the experimental data of Schmidt et al. (30). During the simulated opening of the voltage-sensitive calcium channels, [Ca2+] rapidly spikes in both the spine and adjacent dendrite with a larger magnitude spike in the spine. Decay rates are comparable in both compartments. Note that the magnitudes of both spikes are in the submicromolar concentration range.
FIGURE 8.
(a) Simulated Ca2+ signals in the spine (top) and proximal dendrite (bottom) cytosol during CF activation. Data obtained from the compartmental model. (b) Simulated IP3 (top) and Ca2+ (middle) signals in the spine cytosol during activation of the PF with 12 stimuli at 0.012 s intervals. The percent change in fluorescence (bottom) based on the fraction of bound CG sites is also shown. Data obtained from the compartmental model.
Fig. 8 b shows the [IP3] and [Ca2+] profiles in the spine during the simulated PF stimulation with no activation of the CF. The cumulative effect of the 12 pulses of IP3 that simulate the PF firing activity on [IP3] in the spine cytosol yields an increase on the order of 70 μM, similar to what is observed for the one-dimensional model. Consistent with IP3 flash photolysis experiments discussed in the literature (17), two orders-of-magnitude higher [IP3] is required to stimulate these levels of Ca2+ release from the IP3R as compared to that which is observed in other cells. The model demonstrates that such high levels of IP3 can be attained because of the high surface/volume ratio of the spine. A pulse train of 12 stimuli identical to those used in our earlier neuroblastoma cell model (41) is sufficient to produce the requisite IP3 accumulation in the small spine volume. The rise in [Ca2+] yielded by the model is on the order of 0.02 μM, followed by a decay to steady-state levels. The change in fluorescence, based on the fraction of CG sites occupied, is on the order of 15%. It is important to note that, because this is a mathematical model, our simulation is exquisitely localized to a single spine. Such specificity is impossible to achieve experimentally. Indeed, PF stimulation of a 1-μm dendrite segment containing eight spines in our model produces large μM Ca2+ signals (data not shown) as is observed experimentally (10,48).
Fig. 9 is a plot of [Ca2+] in the spine during coincident activation of the PF and CF inputs. A plot showing the relative timing of the individual Ca2+ signals is also included in the figure. This relative timing was found by trial and error to be optimal in the sense that if the timing between inputs strayed too far from the selected timing, the large-magnitude supralinear spike was not observed. The effect of the relative timing of the inputs on the supralinear behavior will be discussed in more detail in the following subsection. The [Ca2+] results in Fig. 9 clearly show the ability of the model to demonstrate the critical supralinear behavior of the Purkinje cell Ca2+-signaling network. Note that the peak magnitude is on the order of 10 μM, as compared to the individual peak magnitudes in Fig. 8 that are orders-of-magnitude lower. This shows that the nonlinearity inherent in the model causes the calcium signal resulting from coincident activation of the two inputs to be greater than the linear sum of the calcium signals caused by the individual inputs. This is consistent with experimental evidence (e.g., Wang et al. (3)). Additionally, the results show an IP3-sensitive delay before the supralinear rise in [Ca2+], which is also consistent with experimental data (see Supplementary Material).
FIGURE 9.
Relative timings of the individual Ca2+ signals in the spine cytosol (top) and the resulting supralinear Ca2+ spike in the spine cytosol during coincident activation (bottom). Data obtained from the compartmental model.
As will be discussed in more detail, Ca2+ buffers play an important role in the generation of the Ca2+ spike. Included in the list of buffers is the fluorescent indicator dye CG. This dye was added to the model to allow for an accurate comparison to experimental data on CF activation. Because CG is a high-affinity dye (KD = 325 nM), it is possible that its presence is reducing the magnitude of the supralinear spike by binding large amounts of free Ca2+ and reducing the CICR effect. In the experimental work of Wang et al. (3), the effect of coincident activation of the PF and CF inputs when the indicator dye is Magnesium Green (KD = 19 μM) is investigated yielding similar results to those seen in this simulation work.
Sensitivity of the supralinear behavior
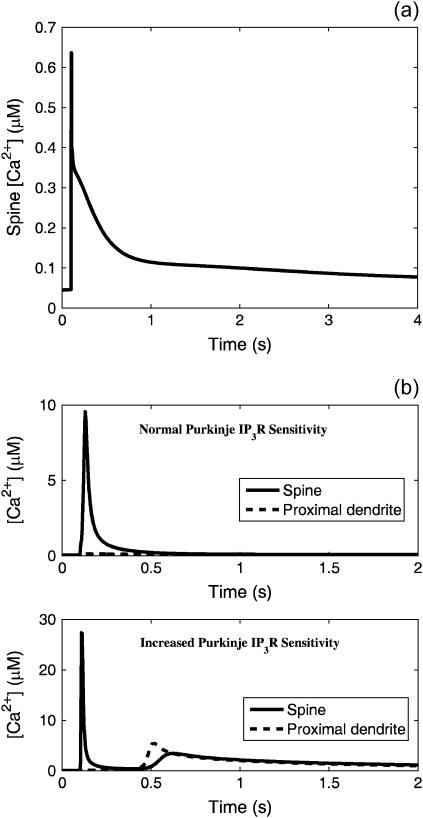
The results in this section will show that the ability of the system to demonstrate the strongly nonlinear behavior evidenced by the supralinear Ca2+ spike is strongly dependent on many features of the system, including biochemical effects and geometrical effects (i.e., spine geometry, as discussed previously). Recall that the IP3R in Purkinje cells are more abundant and less sensitive to IP3 than those found in other neurons or peripheral cells. Our earlier neuroblastoma cell model, for example, produced robust Ca2+ release with a and dIP3 each an order-of-magnitude lower than the values used thus far in this work. By adjusting the parameters a (abundance of IP3R) and dIP3 (sensitivity of IP3R to IP3) found in Eq. 3, the effect of adjusting the IP3R abundance and sensitivity can be investigated in terms of the ability of the system to generate the Ca2+ spike that induces LTD. In Fig. 10 a, the results of a simulation involving coincident activation of the PF and CF are shown for parameter values that represent an order-of-magnitude decrease in the IP3R abundance and an order-of-magnitude increase in the IP3R sensitivity. As can be seen in the figure, altering those parameters by an order of magnitude effectively extinguishes the supralinear [Ca2+] spike under these conditions. It is important to stress that a and dIP3 were increased in our model to conform to the experimental findings of extraordinarily high IP3R density (13) and low sensitivity to IP3 (17). They were not adjusted simply to fit the desired Ca2+ signaling behavior.
FIGURE 10.
(a) Spine cytosol Ca2+ signal during coincident activation when the abundance of IP3R is decreased by a factor of 10 and the sensitivity (dIP3) is increased by a factor of 10. The supralinear behavior is negligible under these conditions. Data obtained from the compartmental model. (b) Ca2+ signals in the spine and proximal dendrite cytosol during coincident activation. The top plot shows the responses given the normal Purkinje IP3R sensitivity, whereas the bottom plot shows the responses with the sensitivity to IP3 (dIP3) increased by a factor of 10. When the sensitivity is increased, a secondary Ca2+ spike is observed in the dendrite that diffuses into the spine. This effect may prevent localization of LTD to the intended spine. Data obtained from the compartmental model.
Another interesting set of results is obtained by returning the IP3R abundance parameter, a, to its high value but leaving the dIP3 parameter at the value corresponding to high IP3 sensitivity. Simulation results given this parameter set during coincident PF and CF activation are shown in Fig. 10 b. At first glance, it appears that these conditions generate two Ca2+ spikes in the spine: a large magnitude spike followed by a smaller spike ∼0.5 s later. In actuality, a secondary Ca2+ spike is being generated in the proximal dendrite compartment which then diffuses into the spine compartment. Thus, the second spine Ca2+ spike is effectively an echo of the first and is, likewise, manifest in all the proximal spines emanating from this region of the dendrite. This is because spine density is ∼14 μm−1 (49). These results suggest that the low sensitivity of Purkinje cell IP3R aids in the localization of the Ca2+ spike to only the activated spine by preventing Ca2+ spiking in the dendrite. These results attest to the importance of the unique IP3R sensitivity and density. Without these features, the spike is either not formed (normal IP3R density) or not localized (normal IP3R sensitivity) to a single spine.
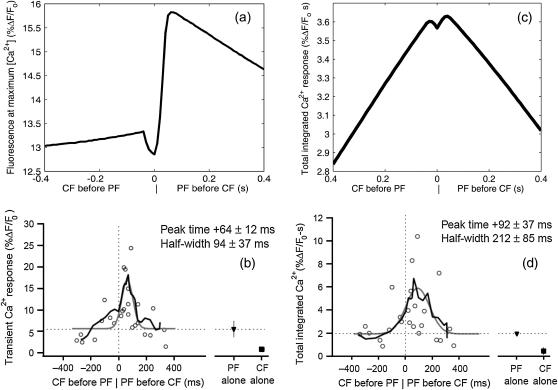
As alluded to in the previous subsection and shown by Wang et al. (3), the relative timing of the CF and PF inputs is critical to the formation of the supralinear Ca2+ spike. Experimental results show that the largest magnitude Ca2+ spikes are obtained by activating the CF briefly after the PF input train begins (3). As shown in Fig. 11, simulated results agree qualitatively with the experimental evidence in terms of both peak and integral fluorescence. To obtain results that could be correctly compared to the data of Wang et al. (3), the indicator dye was changed to Magnesium Green (KD = 19 μM at a concentration of 375 μM) and the IP3 pulse train length was reduced to include only four pulses. The results show that the maximum [Ca2+] is obtained when the CF is activated ∼0.05 s after the PF input train begins. Given timings of this order of magnitude, the CF [Ca2+] spike is occurring just before the time that [IP3] is reaching its peak magnitude at the end of the PF pulse train, thus providing a large Ca2+ influx when the maximum release of Ca2+ from the ER is occurring. Given this relative timing, [Ca2+] peaks at approximately the same time that [IP3] peaks. Timing shifts in either direction result in a decrease in maximum [Ca2+], with shifts in the CF activation time to earlier times resulting in a sharper decrease in maximum [Ca2+]. These results show a strong agreement with the experimental results of Wang et al. (3), in terms of the time when the maximum Ca2+ peak occurs. Also in qualitative agreement with the experimental data, the results in Fig. 11 show that the integrated Ca2+ data trend is more symmetric than the peak Ca2+ data trend. Analysis of the results suggests that proper timing of CF activation relative to PF activation may stimulate the CICR phenomenon at the IP3R to a degree that is optimal in terms of yielding maximum Ca2+ release given the fixed IP3 profile, as is necessary for induction of LTD.
FIGURE 11.
(a) Maximum spine [Ca2+] observed during coincident activation as a function of the relative timing of the PF and CF inputs reported in terms of fluorescence. Timing is calculated as time of CF activation − time of initial PF activation. For comparison to data of Wang et al. (3), an IP3 pulse train consisting of four pulses was used with Magnesium Green as an indicator dye. The results show that the maximum fluorescence is reached when the CF is activated ∼0.05 s after the IP3 input train begins. These results are qualitatively similar to the fluorescence results reported by Wang et al. (3) in Fig. 6 b of their article (shown in b, copyright permission granted by Nature) in terms of the time at which the maximum calcium is observed. Data obtained from the compartmental model. (c) The total integrated Ca2+ signal (computed over the full transient period) also reaches its maximum value at a relative timing near 0.05 s, in agreement with the experimental data of Wang et al. as shown in d (copyright permission granted by Nature).
Physical mechanisms underlying supralinearity
A key issue to address in the study of the Ca2+ spike that leads to LTD is the determination of the actual physical mechanism that leads to the supralinear behavior. Although the results in the previous subsection provide an understanding of when and under what conditions the supralinear spike forms, the question of how the spike forms still needs to be addressed. In this subsection, two underlying mechanisms that act in concert to generate the supralinear behavior are explored using the compartmental model.
The influx (CF-activated) contribution to the total Ca2+ in the spine is a linear function of the density of channels, the open timing, and the current per channel. These are all held constant in our models. However, the IP3R Ca2+ release is intrinsically nonlinear as it is sensitive to the level of Ca2+ in the system, with higher levels of Ca2+ inducing increased Ca2+ release. This positive feedback is part of the mechanism that leads to the Ca2+ spike. As evidence, simulations were performed under coincident activation conditions but with the model parameter that controls the sensitivity of the IP3R to Ca2+ levels, dCa, increased to correspond to a lessened sensitivity to Ca2+. Given an order-of-magnitude increase in this parameter, the Ca2+ spike is extinguished. This result shows that the positive feedback in the CICR mechanism is necessary to generate the supralinear spike. In agreement with experimental evidence, the IP3R with its concerted IP3 and Ca2+ dependencies is necessary for the formation of the supralinear Ca2+ spike.
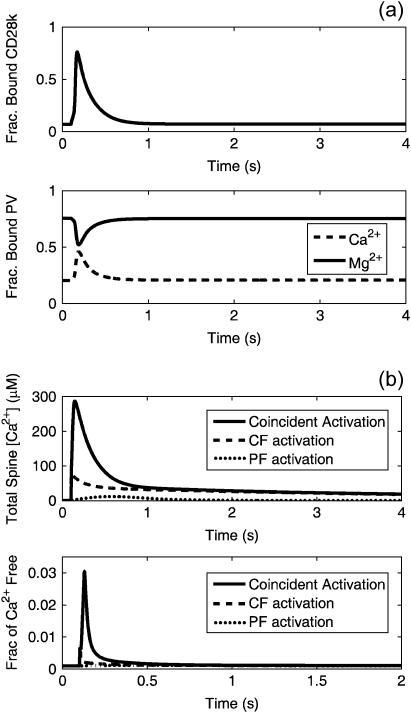
A second important aspect of the mechanism leading to the Ca2+ spike is the role played by Ca2+ buffers in the system. The Ca2+ buffers act as significant stores of bound Ca2+. Fig. 12 a is a plot of the fraction of buffer sites occupied for each of the buffers as a function of time during a normal coincident activation simulation. The model results shown in Fig. 12 a indicate that the buffers approach but do not reach saturation during the Ca2+ spike. Of course, as the buffers approach saturation, there must be a concomitant increase in free Ca2+ (Figs. 6, 9, and 12 b, bottom). The rate of buffer diffusion from the spine may also be important, since the bound form of the buffers are free to diffuse from the spine to the dendrite and to be replaced by buffers with free sites, thus providing additional Ca2+-buffering capacity. A useful estimate of the characteristic time for diffusion is given by L2/DX, where L is a characteristic diffusion length and Dx is a diffusion coefficient. If L is taken to be the length of the spine neck and DX is taken to be the fastest buffer diffusion coefficient in the model (DPV = 43 μm2/s), the fastest characteristic diffusion time is 0.010 s. This timescale is the same order of magnitude as the timing of the Ca2+ spike formation observed in the data obtained in this work. This implies that, in the best case, the rate of buffer diffusion may not be fast enough to replenish the spine with unbound buffers, thus aiding in the saturation of the buffers present in the spine. The results in Fig. 12 a also suggest that the finite rate at which Ca2+ binds to the buffers may be slower than the rate of formation of the Ca2+ spike. This is particularly true in the case of PV, where the results suggest that Mg2+ must unbind first to free sites for Ca2+ to occupy since Mg2+ is preferentially bound. All of these effects suggest that the buffers are unable to bind all of the Ca2+ that is released into the cytosol thus resulting in the large, nonlinear increase in Ca2+ observed during coincident activation.
FIGURE 12.
(a) Fraction of calbindin (top) and parvalbumin (bottom) buffer sites occupied during coincident activation in the spine cytosol. Data obtained from the compartmental model. (b) Total spine Ca2+ (bound and free) during coincident activation and independent activation of the PF and CF (top). Fraction of spine Ca2+ that is bound during coincident and independent activation (bottom). Data obtained from the compartmental model.
Another method for observing the role of the buffers in formation of the Ca2+ spike is by calculating the total Ca2+ in the spine (bound and free, not counting that which is in the stores in the ER or the extracellular space) as well as the proportion of total Ca2+ in the system that is free versus that which is bound to the buffers, including the CG indicator. As shown in Fig. 12 b, the total Ca2+ in the spine during coincident activation is approximately three times the amount that is observed during CF activation and is orders-of-magnitude more than that which is observed during PF activation. Compare this result to the data in Fig. 9, which show that the change in cytosolic [Ca2+] during coincident activation is ∼10 times higher than the CF Ca2+ signal. The difference lies in the proportion of free Ca2+ versus bound Ca2+. As seen in the lower plot in Fig. 12 b, during the comparably slow release of Ca2+ from the ER during PF activation, there is no significant change in the proportion of bound versus free Ca2+. During the fast influx of Ca2+ observed during CF activation, a small increase in the proportion of free Ca2+ is observed. During coincident PF-CF activation, a much larger proportion of free Ca2+ is observed, indicating that a significant amount of Ca2+ is not being bound by the buffers. Therefore, as the buffers approach saturation, the fraction of free Ca2+ increases disproportionately, causing the spike in cytosolic [Ca2+].
TWO-DIMENSIONAL SPATIAL MODEL
Although the results above demonstrate that the one-dimensional and compartmental models are sufficient to model the localized effects considered in this work, future research may consider effects that occur over longer length scales. This type of study will require a model that represents the geometry of the dendrite more accurately than the somewhat simplified one-dimensional model. In this section, a two-dimensional model of IP3 diffusion in a segment of the dendrite is introduced and used to demonstrate its ability to yield results similar to those seen in the previous sections.
In the two-dimensional model, the PDE in Eq. 6 is solved across the geometry shown in Fig. 13. No approximations are made that would allow for the use of ODE expressions. Diffusion in spines is treated explicitly as in the dendritic shaft. The geometry is based on the high-magnification micrograph in Fig. 1. The Virtual Cell system allows electronic images such as this to be used in defining system geometries. As can be seen in the figure, the geometry used in this model can account for spines on either side of the dendritic shaft as opposed to the one-dimensional model that can only model a single spine at each point along the shaft. Because the one-dimensional model represented a 500-μm segment of dendrite where the boundaries could be safely assumed to have reached basal IP3 concentrations at all times, the one-dimensional model was used to establish the time-dependent boundary conditions at the open ends of the two-dimensional geometry.
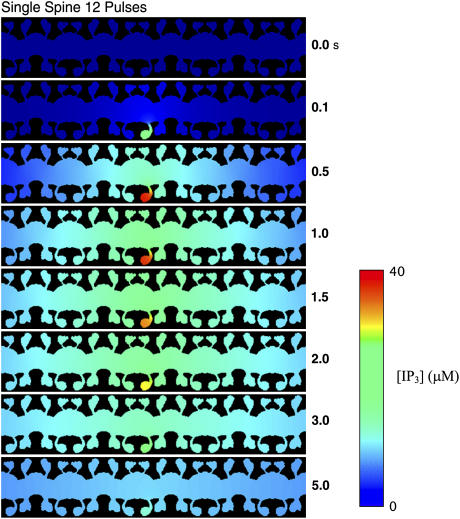
FIGURE 13.
[IP3] after simulated activation of a PF obtained from the two-dimensional model. As seen in the one-dimensional model, high IP3 levels are not observed in neighboring spines, including those directly across the dendritic shaft from the activated spine.
Similar to the kymographs in Figs. 4 and 5, Fig. 13 shows the spread of IP3 during PF activation of a single spine in the center of the bottom side of the dendrite as a function of time. In the activated spine, the [IP3] reaches values of >40 μM, whereas the remainder of the dendrite never reaches [IP3] >10–15 μM. Given the available experimental data and the results in the previous section, this is an insufficient level of IP3 to activate Ca2+ spikes that would lead to LTD in other regions of the dendrite. Note that the levels of [IP3] observed in the dendrite and the other spines are slightly higher than those observed in the one-dimensional model results in Figs. 4 and 5. Similar to the conclusions drawn from the one-dimensional model results, the results again indicate that the spine is able to compartmentalize signals and prevent the spread of LTD. This further justifies the used of the reduced-order compartmental model for local analysis.
Although the two-dimensional model was found to produce the same types of results as the compartmental model for analysis of events caused by stimulation of a single spine, this type of modeling will become necessary when consideration is given to events occurring in multiple spines. In that case, the results of this work will be instrumental in identifying parameter values and simulation conditions to be used in extending the low-dimensional models to higher-dimensional cases. The two-dimensional model discussed and demonstrated in this section is an example of such a model.
CONCLUSIONS
The results obtained in this work demonstrate that a unique interplay of biochemical and morphological specializations contribute to the Purkinje cells' ability to generate localized Ca2+ spikes in dendritic spines. These features range from the biochemical effects of buffer capacity and the unique properties of the IP3R to the diffusional barrier imposed by the spine neck. The simulation results suggest that the system is designed in such a way that a lack of any of the features and mechanisms discussed in this work may prevent the onset of LTD. In addition, the results obtained in this work provide some understanding of the degree of sensitivity of the supralinear Ca2+ response to many of the important system features.
In the case of the unusual IP3R sensitivity and abundance observed in Purkinje cells, the results indicate that these features are necessary for the system to induce and localize the supralinear Ca2+ spike that is a prerequisite for LTD. The system geometry is also a critical feature in the Ca2+ signaling network due to the role it plays in limiting diffusion from the spine for the majority of the system species. In the case of IP3, its higher diffusion coefficient allows it to overcome the spine neck's diffusion barrier during repeated PF activation. This is consistent with the lack of evidence of rapid degradation of IP3 after PF activation ends.
Although the modeling and simulation performed in this work focused on events occurring at the level of a single dendritic spine, the ability of the Virtual Cell to model spatially varying systems using PDE models will allow for further study of events occurring over larger length scales, such as branchlet-wide Ca2+ signaling, which is generally dominated by voltage-dependent Ca2+ entry. The capability to model and simulate PDE systems efficiently will permit the study of events occurring at multiple spines including identification of particular events and mechanisms that cause the spread of LTD effects from one spine to others. Additionally, the role of the unique geometry of the dendritic arbor could be investigated in this context. The parameters identified in this work using the simplified model and existing experimental data will be very useful in extending the model so that Ca2+ dynamics on the scale of branchlet segments, or even full branchlets, will be possible. For example, an obvious next step would be to consider simulated activation of multiple spines in a region of dendritic shaft. Neglecting to consider diffusion of material from the spines (i.e., consideration of only compartmental models) would have served to prevent the applicability of the models to problems such as these.
Additionally, proper spatial modeling is required as one begins to consider accurately the role of the mechanisms leading to the production of IP3. For example, PIP2 is bound to the membrane and, therefore, its availability for reaction may be limited by lateral diffusion along the membrane. This would limit the Purkinje cell's ability to produce the large amount of IP3 required to stimulate the IP3R. Membrane diffusion capabilities will soon be available in the Virtual Cell, thus allowing this type of analysis to be performed in conjunction with a larger spatial modeling study including explicit consideration of PIP2 hydrolysis.
SUPPLEMENTARY MATERIAL
An online supplement to this article can be found by visiting BJ Online at http://www.biophysj.org.
Supplementary Material
Acknowledgments
The Virtual Cell project is supported by the National Institutes of Health National Center for Research Resources grant No. RR13186.
APPENDIX
This Appendix includes a summary of each of the models used in this work. All parameter values can be found in Table 1.
One-dimensional model
In this model, each species X (X = Ca2+, IP3, PV, PVBc, PVBm, CD28k, CD28kB1, CD28kB2, and CD28kB12) at time t and location z is represented by two concentrations: [X]d(z,t) and [X]s(z,t) in the dendrite and spine, respectively. These concentrations are governed by the equations
 |
 |
where DX is the diffusion coefficient of the species X, l12 is the spine neck length, and the coefficients k1 and k2 are determined by the spine neck radius rn, the spine radius r1, the dendrite radius r2, and the linear spine density s: k1 = s(rn/r2)2, k2 = (3/r1)(rn/2r1)2. The last terms in the governing equations (the source terms) are described below. They include rates of all processes, other than diffusion, that influence the corresponding concentration. RXd and RXs have identical structures: RXs can be obtained from RXd by simply replacing all dendrite parameters and concentrations by their spine counterparts (except in the case of IP3, which is discussed below).
The source terms for calcium and IP3 are detailed in Eqs. 2–5 and Eq. 8 of the main text. The rate of calcium buffering includes the sum of terms of the type defined in Eq. 2 that correspond to binding to PV and CD28k. The surface/volume ratio σ in the rate of calcium extrusion, Eq. 8, is 2/r2 and 3/r1 for the dendrite and spine, respectively. To reflect activation of only one spine by PF, the first term in Eq. 5 must be zero everywhere except on the segment of length L = 1/s (note that this term is absent from the so-called dendrite equation),
 |
 |
where θ(x) is a step function,
 |
The “dendrite” source terms (the “spine” source terms are analogous) for calcium buffers are
 |
 |
 |
 |
 |
 |
 |
The set of governing equations was solved numerically (28) on the one-dimensional domain of 250-μm length (half of the total length, due to symmetry) with a spatial step of 0.5 μm and a time step of 0.1 ms.
Compartmental model
As shown in Fig. 3, the compartmental model consists of three compartments: the spine (compartment 1), the proximal dendrite (compartment 2), and the distal dendrite (compartment 3). Species concentrations in compartment 3 ([X]3) are held constant at their respective steady-state values. Material can diffuse to compartment 2 from compartment 1 and vice versa, and to compartment 3 from compartment 2 and vice versa. The flux expressions are modeled using Fick's law. For example, the rate of diffusion of species X in compartment i to compartment j is modeled as
 |
where DX is the diffusion coefficient for species X, Aij is the cross-sectional area of the region connecting compartments i and j (the spine neck for Rdiffusion,12 and Rdiffusion, 21, and the dendrite for Rdiffusion,23 and Rdiffusion,32), lij is the distance between compartments i and j, and Vi is the volume of compartment i.
Species in compartment 1 (spine) and compartment 2 (proximal dendrite) are modeled using ODEs of the form
 |
 |
The definitions of the source terms, RX,i (i = 1,2), are the same as in the one-dimensional model. Again, RIP3,1 is defined by Eq. 5 of the main text whereas RIP3,2 contains IP3 degradation only. In this model the set of species was extended to include a fluorescent indicator, CG. Correspondingly, RCa,i will have an extra buffering contribution (Eq. 2), and the source terms for the additional species are
 |
 |
The set of ODEs was solved numerically using the Runge-Kutta-Fehlberg method (50), a default ODE solver in the Virtual Cell.
Two-dimensional model
The two-dimensional model simulates the dynamics of IP3 across the geometry depicted in Fig. 13. The governing equation,
 |
is solved in the presence of the IP3 influx restricted to the membrane of the central spine. The corresponding flux density, J(t), reflects repetitive single spine excitations,
 |
with the parameter values as in Fink et al. (41). The conditions at the domain boundaries were obtained from the corresponding one-dimensional model simulated with the identical parameter set. The simulations of the two-dimensional model were performed with the 10-μs time step on a 0.04-μm grid overlaying the 27.9 × 6.5 μm geometry. The computational error is estimated to be <1%.
Nicholas Hernjak and Boris Slepchenko contributed equally to this work.
References
- 1.Ito, M. 2001. Cerebellar long-term depression: characterization, signal transduction, and functional roles. Physiol. Rev. 81:1143–1195. [DOI] [PubMed] [Google Scholar]
- 2.Konnerth, A., J. Dreessen, and G. J. Augustine. 1992. Brief dendritic calcium signals initiate long-lasting synaptic depression in cerebellar Purkinje cells. Proc. Natl. Acad. Sci. USA. 89:7051–7055. [DOI] [PMC free article] [PubMed] [Google Scholar]
- 3.Wang, S. S., W. Denk, and M. Hausser. 2000. Coincidence detection in single dendritic spines mediated by calcium release. Nat. Neurosci. 3:1266–1273. [DOI] [PubMed] [Google Scholar]
- 4.Sakurai, M. 1990. Calcium is an intracellular mediator of the climbing fiber in induction of cerebellar long-term depression. Proc. Natl. Acad. Sci. USA. 87:3383–3385. [DOI] [PMC free article] [PubMed] [Google Scholar]
- 5.Freeman, J. H., Jr., T. Shi, and B. G. Schreurs. 1998. Pairing-specific long-term depression prevented by blockade of PKC or intracellular Ca2+. Neuroreport. 9:2237–2241. [DOI] [PubMed] [Google Scholar]
- 6.Daniel, H., N. Hemart, D. Jaillard, and F. Crepel. 1992. Coactivation of metabotropic glutamate receptors and of voltage-gated calcium channels induces long-term depression in cerebellar Purkinje cells in vitro. Exp. Brain Res. 90:327–331. [DOI] [PubMed] [Google Scholar]
- 7.Inoue, T., K. Kato, K. Kohda, and K. Mikoshiba. 1998. Type 1 inositol 1,4,5-trisphosphate receptor is required for induction of long-term depression in cerebellar Purkinje neurons. J. Neurosci. 18:5366–5373. [DOI] [PMC free article] [PubMed] [Google Scholar]
- 8.Miyata, M., E. A. Finch, L. Khiroug, K. Hashimoto, S. Hayasaka, S. I. Oda, M. Inoye, Y. Takagishi, G. J. Augustine, and M. Kano. 2000. Local calcium release in dendritic spines required for long-term synaptic depression. Neuron. 28:233–244. [DOI] [PubMed] [Google Scholar]
- 9.Parker, I., and I. Ivorra. 1990. Localized all or none calcium liberation by inositol trisphosphate. Science. 250:977–979. [DOI] [PubMed] [Google Scholar]
- 10.Finch, E. A., and G. J. Augustine. 1998. Local calcium signalling by inositol-1,4,5-trisphosphate in Purkinje cell dendrites. Nature. 396:753–756. [DOI] [PubMed] [Google Scholar]
- 11.Bezprozvanny, I., J. Watras, and B. E. Ehrlich. 1991. Bell-shaped calcium-response curves of Ins(1,4,5)P3-and calcium-gated channels from endoplasmic reticulum of cerebellum. Nature. 351:751–754. [DOI] [PubMed] [Google Scholar]
- 12.Parys, J. B., S. W. Sernett, S. DeLisle, P. M. Snyder, M. J. Welsh, and K. P. Campbell. 1992. Isolation, characterization, and localization of the inositol 1,4,5-trisphosphate receptor protein in Xenopus laevis oocytes. J. Biol. Chem. 267:18776–18782. [PubMed] [Google Scholar]
- 13.Maeda, N., M. Niinobe, and K. Mikoshiba. 1990. A cerebellar Purkinje cell marker P400 protein is an inositol 1,4,5-trisphosphate (InsP3) receptor protein. Purification and characterization of InsP3 receptor complex. EMBO J. 9:61–67. [DOI] [PMC free article] [PubMed] [Google Scholar]
- 14.Walton, P. D., J. A. Airey, J. L. Sutko, C. F. Beck, G. A. Mignery, T. C. Sudhof, T. J. Deerinck, and M. H. Ellisman. 1991. Ryanodine and inositol trisphosphate receptors coexist in avian cerebellar Purkinje neurons. J. Cell Biol. 113:1145–1157. [DOI] [PMC free article] [PubMed] [Google Scholar]
- 15.Ferris, C. D., and S. H. Snyder. 1992. Inositol phosphate receptors and calcium disposition in the brain. J. Neurosci. 12:1567–1574. [DOI] [PMC free article] [PubMed] [Google Scholar]
- 16.Suburo, A. M., J. Rodrigo, M. L. Rossi, R. Martinez-Murillo, G. Terenghi, N. Maeda, K. Mikoshiba, and J. M. Polak. 1993. Immunohistochemical localization of the inositol 1,4,5-trisphosphate receptor in the human nervous system. Brain Res. 601:193–202. [DOI] [PubMed] [Google Scholar]
- 17.Khodakhah, K., and D. Ogden. 1993. Functional heterogeneity of calcium release by inositol trisphosphate in single Purkinje neurones, cultured cerebellar astrocytes, and peripheral tissues. Proc. Natl. Acad. Sci. USA. 90:4976–4980. [DOI] [PMC free article] [PubMed] [Google Scholar]
- 18.Fujiwara, A., K. Hirose, T. Yamazawa, and M. Iino. 2001. Reduced IP3 sensitivity of IP3 receptor in Purkinje neurons. Neuroreport. 12:2647–2651. [DOI] [PubMed] [Google Scholar]
- 19.Watras, J., R. Orlando, and I. I. Moraru. 2000. An endogenous sulfated inhibitor of neuronal inositol trisphosphate receptors. Biochemistry. 39:3452–3460. [DOI] [PubMed] [Google Scholar]
- 20.Watras, J., C. C. Fink, and L. M. Loew. 2005. Endogenous inhibitors of InsP3-induced Ca2+ release in neuroblastoma cells. Brain Res. In press. [DOI] [PubMed]
- 21.Svoboda, K., D. W. Tank, and W. Denk. 1996. Direct measurement of coupling between dendritic spines and shafts. Science. 272:716–719. [DOI] [PubMed] [Google Scholar]
- 22.Harris, K. M., and S. B. Kater. 1994. Dendritic spines: cellular specializations imparting both stability and flexibility to synaptic function. Annu. Rev. Neurosci. 17:341–371. [DOI] [PubMed] [Google Scholar]
- 23.Nimchinsky, E. A., B. L. Sabatini, and K. Svoboda. 2002. Structure and function of dendritic spines. Annu. Rev. Physiol. 64:313–353. [DOI] [PubMed] [Google Scholar]
- 24.Sabatini, B. L., M. Maravall, and K. Svoboda. 2001. Ca2+ signaling in dendritic spines. Curr. Opin. Neurobiol. 11:349–356. [DOI] [PubMed] [Google Scholar]
- 25.Noguchi, J., M. Matsuzaki, G. C. Ellis-Davies, and H. Kasai. 2005. Spine-neck geometry determines NMDA receptor-dependent Ca2+ signaling in dendrites. Neuron. 46:609–622. [DOI] [PMC free article] [PubMed] [Google Scholar]
- 26.Doi, T., S. Kuroda, T. Michikawa, and M. Kawato. 2005. Inositol 1,4,5-trisphosphate-dependent Ca2+ threshold dynamics detect spike timing in cerebellar Purkinje cells. J. Neurosci. 25:950–961. [DOI] [PMC free article] [PubMed] [Google Scholar]
- 27.Schaff, J., C. C. Fink, B. Slepchenko, J. H. Carson, and L. M. Loew. 1997. A general computational framework for modeling cellular structure and function. Biophys. J. 73:1135–1146. [DOI] [PMC free article] [PubMed] [Google Scholar]
- 28.Slepchenko, B. M., J. C. Schaff, I. G. Macara, and L. M. Loew. 2003. Quantitative cell biology with the Virtual Cell. Trends Cell Biol. 13:570–576. [DOI] [PubMed] [Google Scholar]
- 29.Nagerl, U. V., D. Novo, I. Mody, and J. L. Vergara. 2000. Binding kinetics of calbindin-D(28k) determined by flash photolysis of caged Ca2+. Biophys. J. 79:3009–3018. [DOI] [PMC free article] [PubMed] [Google Scholar]
- 30.Schmidt, H., K. M. Stiefel, P. Racay, B. Schwaller, and J. Eilers. 2003. Mutational analysis of dendritic Ca2+ kinetics in rodent Purkinje cells: role of parvalbumin and calbindin D28k. J. Physiol. (Lond.). 551:13–32. [DOI] [PMC free article] [PubMed] [Google Scholar]
- 31.Li, Y. X., and J. Rinzel. 1994. Equations for InsP3 receptor-mediated [Ca2+]i oscillations derived from a detailed kinetic model: a Hodgkin-Huxley-like formalism. J. Theor. Biol. 166:461–473. [DOI] [PubMed] [Google Scholar]
- 32.De Young, G. W., and J. Keizer. 1992. A single-pool inositol 1,4,5-trisphosphate-receptor-based model for agonist-stimulated oscillations in Ca2+ concentration. Proc. Natl. Acad. Sci. USA. 89:9895–9899. [DOI] [PMC free article] [PubMed] [Google Scholar]
- 33.Atri, A., J. Amundson, D. Clapham, and J. Sneyd. 1993. A single-pool model for calcium oscillations and waves in the Xenopus laevis oocyte. Biophys. J. 65:1727–1739. [DOI] [PMC free article] [PubMed] [Google Scholar]
- 34.Bezprozvanny, I. 1994. Theoretical analysis of calcium wave propagation based on inositol(1,4,5)trisphosphate (InsP3) receptor functional properties. Cell Calcium. 16:151–166. [DOI] [PubMed] [Google Scholar]
- 35.Tang, Y., J. L. Stephenson, and H. G. Othmer. 1996. Simplification and analysis of models of calcium dynamics based on IP3-sensitive calcium channel kinetics. Biophys. J. 70:246–263. [DOI] [PMC free article] [PubMed] [Google Scholar]
- 36.Laurent, M., and M. Claret. 1997. Signal-induced Ca2+ oscillations through the regulation of the inositol 1,4,5-trisphosphate-gated Ca2+ channel: an allosteric model. J. Theor. Biol. 186:307–326. [DOI] [PubMed] [Google Scholar]
- 37.Kaftan, E., B. Ehrlich, and J. Watras. 1997. Inositol 1,4,5-trisphosphate (InsP3) and calcium interact to increase the dynamic range of InsP3 receptor signaling. J. Gen. Physiol. 110:529–538. [DOI] [PMC free article] [PubMed] [Google Scholar]
- 38.Mak, D. O. D., S. McBride, and J. K. Foskett. 1998. Inositol 1,4,5-tris-phosphate activation of inositol tris-phosphate receptor Ca2+ channel by ligand tuning of Ca2+ inhibition. Proc. Natl. Acad. Sci. USA. 95:15821–15825. [DOI] [PMC free article] [PubMed] [Google Scholar]
- 39.Adkins, C. E., and C. W. Taylor. 1999. Lateral inhibition of inositol 1,4,5-trisphosphate receptors by cytosolic Ca2+. Curr. Biol. 9:1115–1118. [DOI] [PubMed] [Google Scholar]
- 40.Moraru, I. I., E. J. Kaftan, B. E. Ehrlich, and J. Watras. 1999. Regulation of type 1 inositol 1,4,5-trisphosphate-gated calcium channels by InsP3 and calcium. Simulation of single channel kinetics based on ligand binding and electrophysiological analysis. J. Gen. Physiol. 113:837–849. [DOI] [PMC free article] [PubMed] [Google Scholar]
- 41.Fink, C. C., B. Slepchenko, I. I. Moraru, J. Watras, J. Schaff, and L. M. Loew. 2000. An image-based model of calcium waves in differentiated neuroblastoma cells. Biophys. J. 79:163–183. [DOI] [PMC free article] [PubMed] [Google Scholar]
- 42.Li, Y. X., S. S. Stojilkovic, J. Keizer, and J. Rinzel. 1997. Sensing and refilling calcium stores in an excitable cell. Biophys. J. 72:1080–1091. [DOI] [PMC free article] [PubMed] [Google Scholar]
- 43.Wagner, J., Y. X. Li, J. Pearson, and J. Keizer. 1998. Simulation of the fertilization Ca2+ wave in Xenopus laevis eggs. Biophys. J. 75:2088–2097. [DOI] [PMC free article] [PubMed] [Google Scholar]
- 44.Li, Y. X. 2003. Tango waves in a bidomain model of fertilization calcium waves. Physica D. 186:27–49. [Google Scholar]
- 45.Dupont, G., and C. Erneux. 1997. Simulations of the effects of inositol 1,4,5-trisphosphate 3-kinase and 5-phosphatase activities on Ca2+ oscillations. Cell Calcium. 22:321–331. [DOI] [PubMed] [Google Scholar]
- 46.Herrington, J., Y. B. Park, D. F. Babcock, and B. Hille. 1996. Dominant role of mitochondria in clearance of large Ca2+ loads from rat adrenal chromaffin cells. Neuron. 16:219–228. [DOI] [PubMed] [Google Scholar]
- 47.Yuste, R., A. Majewska, and K. Holthoff. 2000. From form to function: calcium compartmentalization in dendritic spines. Nat. Neurosci. 3:653–659. [DOI] [PubMed] [Google Scholar]
- 48.Khodakhah, K., and C. M. Armstrong. 1997. Induction of long-term depression and rebound potentiation by inositol trisphosphate in cerebellar Purkinje neurons. Proc. Natl. Acad. Sci. USA. 94:14009–14014. [DOI] [PMC free article] [PubMed] [Google Scholar]
- 49.Harris, K. M., and J. K. Stevens. 1988. Dendritic spines of rat cerebellar Purkinje cells: serial electron microscopy with reference to their biophysical characteristics. J. Neurosci. 8:4455–4469. [DOI] [PMC free article] [PubMed] [Google Scholar]
- 50.Press, W. H., S. A. Teukolsky, W. T. Vetterling, and B. P. Flannery. 1992. Numerical Recipes in FORTRAN 77. Cambridge University Press, Cambridge, UK.
- 51.Allbritton, N. L., T. Meyer, and L. Stryer. 1992. Range of messenger action of calcium ion and inositol 1,4,5-trisphosphate. Science. 258:1812–1815. [DOI] [PubMed] [Google Scholar]
- 52.Holthoff, K., D. Tsay, and R. Yuste. 2002. Calcium dynamics of spines depend on their dendritic location. Neuron. 33:425–437. [DOI] [PubMed] [Google Scholar]
- 53.Lee, S. H., B. Schwaller, and E. Neher. 2000. Kinetics of Ca2+ binding to parvalbumin in bovine chromaffin cells: implications for [Ca2+] transients of neuronal dendrites. J. Physiol. 525:419–432. [DOI] [PMC free article] [PubMed] [Google Scholar]
- 54.Eberhard, M., and P. Erne. 1994. Calcium and magnesium binding to rat parvalbumin. Eur. J. Biochem. 222:21–26. [DOI] [PubMed] [Google Scholar]
- 55.Miyawaki, A., J. Llopis, R. Heim, J. M. McCaffery, J. A. Adams, M. Ikura, and R. Y. Tsien. 1997. Fluorescent indicators for Ca2+ based on green fluorescent proteins and calmodulin. Nature. 388:882–887. [DOI] [PubMed] [Google Scholar]
- 56.Gill, D., and S.-H. Chueh. 1985. An intracellular (ATP + Mg2+)-dependent calcium pump within the N1E–115 neuronal cell line. J. Biol. Chem. 260:9289–9297. [PubMed] [Google Scholar]
- 57.Wiest, M. C., D. M. Eagleman, R. D. King, and P. R. Montague. 2000. Dendritic spikes and their influence on extracellular calcium signaling. J. Neurophysiol. 83:1329–1337. [DOI] [PubMed] [Google Scholar]
- 58.Airaksinen, M. S., J. Eilers, O. Garaschuk, H. Thoenen, A. Konnerth, and M. Meyer. 1997. Ataxia and altered dendritic calcium signaling in mice carrying a targeted null mutation of the calbindin D28k gene. Proc. Natl. Acad. Sci. USA. 94:1488–1493. [DOI] [PMC free article] [PubMed] [Google Scholar]
- 59.Palay, S. L., and V. Chan-Palay. 1974. Cerebellar Cortex. Cytology and Organization. Springer Verlag, New York.
Associated Data
This section collects any data citations, data availability statements, or supplementary materials included in this article.


