

Abstract
We describe a two-dimensional stochastic model of intercellular Ca2+ wave (ICW) spread in glia that includes contributions of external stimuli, ionotropic and metabotropic P2 receptors, exo- and ecto-nucleotidases, second messengers, and gap junctions. In this model, an initial stimulus evokes ATP and UTP release from a single cell. Agonists diffuse and are degraded both in bulk solution and at cell surfaces. Ca2+ elevation in individual cells is determined by bound agonist concentrations s and by number and features of P2 receptors summed with that generated by IP3 diffusing through gap junction channels. Variability of ICWs is provided by randomly distributing a predetermined density of cells in a rectangular grid and by randomly selecting within intervals values characterizing the extracellular compartment, individual cells, and interconnections with neighboring cells. Variability intervals were obtained from experiments on astrocytoma cells transfected to express individual P2 receptors and/or the gap junction protein connexin43. The simulation program (available as Supplementary Material) permits individual alteration of ICW components, allowing comparison of simulations with data from cells expressing connexin43 and/or various P2 receptor subtypes. Such modeling is expected to be useful for testing phenomenological hypotheses and in understanding consequences of alteration of system components under experimental or pathological conditions.
INTRODUCTION
Glial cells can respond to a variety of neurotransmitters with increases in intracellular Ca2+ levels that can be transmitted to neighboring cells as intercellular Ca2+ waves (ICWs), thus providing long-range glial Ca2+-signaling. Two main pathways contribute to spread of ICWs (1), one involving the release and diffusion of extracellular messengers such as ATP and UTP that activate cell membrane Ca2+-mobilizing receptors or promote Ca2+ influx from the extracellular medium, and a separate gap junction-mediated route that allows for direct cytosol-to-cytosol diffusion of intracellular Ca2+ mobilizing second messengers. (See Table 1 for a glossary of terms used in this article.)
TABLE 1.
Glossary of symbols (in alphabetical order)
| Symbol | Unit | Description |
|---|---|---|
| a (a = ATP, UTP) | Released agonist. | |
| å (å = ADP, UDP) | Hydrolyzed a. | |
| s−1 | Degradation modules of agonists a and å in the bulk solution and in cell at node (m,n). Defined in the text. | |
| ä (ä = AMP, UMP, …) | Degradation compounds without agonist activity. | |
| β | Text variable taking values from an attached list. | |
| C(m,n;m+i,n+j) | Arb* | (Integer) Number of gap junction channels formed between the cells at the nodes (m,n) and (m+i,n+j). |
 |
μM | Cytosolic concentration of Ca2+ at the moment t in the cell at node (m,n). |
 |
mM | Concentration of Ca2+ in the ER stores of the cell at node (m,n). |
 |
mM | Concentration of Ca2+ in the bulk solution. |
| χ(m,n) | Number of internodal distances (λ) from the central cell to the node (m,n). | |
| d/dt, ∂/∂t | Total and partial time derivatives. | |
| DATP, DUTP | 10−10 m2/s | Diffusion coefficients in the bulk solution. |
| δx,ATP, δx,UTPδx,ADP, δx,UDP | 103 M−1 s−1 | Degradation rates of ATP, ADP, UTP, and UDP in solution by the exo-nucleotidase x. |
| δz,ATP(m,n), δz,UTP(m,n)δz,ADP(m,n), δz,UDP(m,n) | 103 M−1 s−1 | Degradation rates of ATP, ADP, UTP, UDP at the membrane of the cell located at node (m,n) by the ecto-nucleotidase z. |
| [ɛ]/ [ɛmax] | Energy of the stimulus/ maximal energy that preserves the cell integrity. | |
| η(m,n) | s−1 | Rate of Ca2+ sequestration in the cell at node (m,n). |
| {EATP}, {EUTP} | Arb* | (Integer) Number of transducers, each responsible for ATP or UTP release after mechanical stimulation. |
| ΦER(m,n;t) | mol/s | Ca2+ flux from the ER to the cytosol at moment t in the cell located at node (m,n). |
| ΦIP3(m,n;t) | mol/s | IP3 formation rate at moment t in the cell located at node (m,n). |
| ΦSO(m,n;t) | mol/ | Total Ca2+ influx through the membrane of the cell located at node (m,n). |
| Γ(m,n;m+i,n+j) | 10−21 mol/s | IP3 permeability of a unitary gap junction channel formed between the cells located in the nodes (m,n) and (m+i,n+j). |
| Hr,s(m,n), (e.g., HEATP,ɛ, HEUTP,ɛ, HP2X4,ATP, etc.) | Unit of [s] | Intensity of stimulus s eliciting half-saturation response of transduction/receptor r in the cell at node (m,n). |
| i, j | Integer values. | |
| {IP3} | Arb* | (Integer) Number of IP3 receptors. |
| κ(m,n) | s−1 | Degradation rate of IP3 in the cell at node (m,n). |
| ∇2 = ∂2/∂x2 + ∂2/∂y2 + ∂2/∂z2 | Laplacian. | |
| Lr,s(m,n) (e.g., LEATP,ɛ, LEUTP,ɛ, LP2X4,ATP, etc.) | s | Latency of the response of transducer/receptor r from the cell located at node (m,n) to the stimulus s. |
| LATP ≡ LEATP,ɛ(0,0)LUTP ≡ LEUTP,ɛ(0,0) | s | Latency of agonists release by the central cell. |
| λ | μm | Internodal distance. |
| (m,n), m,n = −12, …, 12 | Node of the grid. (0,0) = The central node locating the stimulated cell. | |
| Mr,s(m,n) (e.g., MEATP,ɛ, MEUTP,ɛ, MP2X4,ATP, etc.) | Unit of [s] | Threshold intensity of stimulus s to elicit the response of transducer/receptor r from the cell located at node (m,n). |
| NORMSINV | Returns the inverse of the standard normal cumulative distribution for the cumulative probability. | |
| OCC(m,n) | Occupancy of the node (m,n). | |
 |
Number of iteration steps (elementary time intervals τ) from the stimulation until the new steady state of the system. | |
 |
Number of elementary time intervals τ from the stimulation until the first formation of IP3 in the cell located at node (m,n). | |
| P | Probability to assign a cell to a node = confluence. | |
| {P2Xi(m,n)}{P2Yi(m,n)} | Arb* | (Integer) Number of P2X and P2Y receptors in the cell at node (m,n). The index i indicates the subtype of the receptor. |
| Qr,s(m,n), (e.g., QEATP,ɛ, QEUTP,ɛ, QP2X4,ATP, etc.) | Hill slope of the logistic dose-response of transducer/receptor r from the cell located at node (m,n) to the stimulus s. | |
| rand(…) | Evenly distributed random number ≥0, and <1. | |
| ψ(m,n) | s−1 | Rate of Ca2+ extrusion in the cell at node (m,n). |
| σ | Standard deviation. | |
| Ta(m,n) | s | Time after stimulation when the released agonist a (= ATP, UTP) from the central cell reaches the node (m,n). |
| τ | s | Elementary time-interval used as iteration step. |
| θr,s(m,n;t+Lr,s(m,n)) (e.g., θEATP,ɛ, θEUTP,ɛ, θP2X4,ATP, etc.) | Response of transducer/ receptor r from the cell located at node (m,n) to the stimulus s at time t + latency L. | |
| Θr,s(m,n) (e.g., ΘEATP,ɛ, ΘEUTP,ɛ, ΘP2X4,ATP, etc.) | Unit of θ | Saturated response of transducer/receptor r from the cell located at node (m,n) to the stimulus s. |
| V(m,n) | pl | Volume of the cell located at node (m,n). |
| VER(m,n) | pl | Total volume of Ca2+ ER stores of the cell at node (m,n). |
| VSO | cm3 | Volume of the bulk solution. |
| [x1], [x2], … | μM | Concentration of exo-nucleotidase x1, x2, … in the bulk solution. |
| Y(m,n;m+i,n+j) | 10−21 mol/s | The product between the number and permeability of gap junction channels interconnecting the cells located at nodes (m,n) and (m+j,n+k). |
| [z1(m,n)], [z2(m,n)], … | Concentration of ecto-nucleotidase z1, z2, … in the cell at node (m,n). |
100 Arb (arbitrary) units are responsible for the maximal observed value.
Gap junctional pathway
Astrocytes are coupled by gap-junction channels mainly formed by the gap junction protein connexin43 (Cx43) (2,3) and, as first shown by Boitano et al. (4), inositol 1,4,5-triphosphate (IP3) is generally believed to be the main intracellular messenger responsible for gap-junction-mediated ICW spread between these cells (5,6). IP3 generated in stimulated astrocytes by activation of phospholipase C (PLC) increases Ca2+ levels due to the release of Ca2+ from intracellular IP3-sensitive Ca2+ stores (7). The increases in intracellular Ca2+ can then be transmitted to neighboring coupled cells by second-messenger diffusion through gap junction channels (5,6,8–11).
Extracellular purine-/pyrimidinergic pathway
The contribution of an extracellular route to the spread of ICWs between cultured astrocytes was first suggested by the observations that Ca2+ waves could jump cell-free areas (12,13). Further evidence that gap junctions were not required for ICW spread between astrocytes was obtained from experiments using gap junction channel blockers and Cx43-null mice, showing that the extent of ICW spread was attenuated but not totally prevented when coupling was substantially reduced (14–16). The extracellular messenger mediating such gap junction-independent ICW spread was identified as being ATP, other nucleotides and/or their metabolites (17,18). Nucleotides released from mechanically stimulated cells (19–21) can induce intracellular Ca2+ mobilization through activation of ionotropic (P2X) and metabotropic (P2Y) purinergic receptors (22,23). Activation of ligand-gated P2XR ion channels allows influx of Ca2+ from the extracellular compartment, while activation of G-protein coupled P2YRs mobilizes Ca2+ from intracellular pools through activation of PLC and generation of intracellular second messengers (22,23).
Mathematical modeling of ICW
As described above, ICW spread between astrocytes depends on a large number of variables linked through complex regulatory interactions between distinct cellular processes. One way in which to gain insight into such interactions is the use of mathematical modeling for these processes, which may provide a conceptual framework to account for experimental observations and to generate experimentally testable predictions. The stochastic two-dimensional model that we have generated describes and allows computer simulations of the participation of both gap junctional and extracellular pathways for the transmission of ICWs, permitting separate alterations of the individual contribution of each component of these two pathways, including variations in degree of junctional coupling as well as levels of P2R expression reported for astrocytes from different central nervous system regions and under different pathophysiological conditions (3,24–30). Supplementary Material contains the procedures to initialize the system and a simplified version of the simulation program. The values of the parameters may be individually fixed or randomly selected from Gaussian distributions centered on predefined value intervals, as described in the Supplementary Material (procedures 1a–1d).
In this report, model parameters were chosen to simulate the phenomena that occur after focal mechanical stimulation in a culture dish in which a human astrocytoma cell line (1321N1 cells), stably transfected with various P2 receptor subtypes and/or with Cx43 gap junction channels, was grown at 80–90% confluence in a medium containing 1 mM Ca2+. The model was developed progressively so that the characteristics of each simulation were used to determine those of the next one.
PHYSICAL MODEL
Physical system and main approximations
In a cell culture system, ICWs can be induced by focal stimulation of a single cell. The transmission profile and properties of the ICWs depend both on the subtypes of P2R expressed and on the degree of junctional coupling (31). Fig. 1 depicts the ICW phenomenon observed in a culture of human 1321N1 astrocytoma cells stably transfected to express only the P2Y2R subtype. Focal mechanical stimulation of a cell in the center of the field induces a prompt rise in intracellular Ca2+ that spreads to neighboring cells within a few seconds. This spread is illustrated in a plot of changes over time in the fluorescence ratio of Indo-1, an intracellular Ca2+ indicator. Similar experiments performed on 1321N1 cells transfected with vectors encoding each P2R subtype and/or the gap-junction protein Cx43 were previously quantified (31) to determine parameters used to constrain the model simulations presented below. These experimental results permitted the separation of the contribution of each component of the purine-/pyrimidinergic and gap junctional pathways for the transmission of ICWs.
FIGURE 1.

Intercellular calcium wave (ICW) spread among 1321N1 human astrocytoma cells stably expressing P2Y2 receptors. (A) Confocal images of cells loaded with Indo 1-AM and imaged using a real-time confocal microscope (Model RCM-8000, Nikon, Tokyo, Japan) as previously described (3,31). Images were pseudo-colored using the lookup table (fluorescence ratio proportional to the logarithm of the molar concentration of Ca2+) indicated at the far left. Mechanical stimulation of a cell in the center of the field (arrow, cell a) induces a steep increase in the intracellular Ca2+ level of the stimulated cell and triggers the transmission of the Ca2+ signal to the neighboring cells (a chain of which is labeled b–d). (B) Graphical representation of the phenomenon illustrated in A as a function of time for the four cells indicated in the photograph.
The components of the physical system described below are illustrated in Fig. 2. In our model of ICW spread, the cells (where the average diameter is assumed to be 20 μm but can be adjusted to account for differences or variability in cell morphology) are randomly distributed on the nodes {(m,n)|m,n = −12, …, 12} of a 25 × 25 rectangular grid, reported to the Cartesian axes centered in the central node (0,0) with the internodal distance λ larger or equal to the maximal cell diameter to avoid cell overlapping. The central section of this grid is illustrated in Fig. 2 A; note that grid size is considerably larger than the observed spread of ICW (see Fig. 1) so that edge effects are negligible. The cellular network is placed at the surface of a dish (100 mm) containing culture medium (extending 2 mm above the cells). Confluence p, a parameter previously shown to affect ICW spread (16) is randomly selected from the 80–90% value interval and used as probability to assign a cell to a node to simulate normal culture conditions. The cells can be grouped into concentric circular tiers (as indicated by the ring with light shading in Fig. 2 A), where tier thicknesses are equal to the internodal distance λ. The height of the medium and diameter of the dish are considered to be infinite compared to the cell diameter and the average intercellular distance. Therefore, as compared to the distances between the stimulated cell and the edges of the entire system, concentrations of all molecules of interest may be considered uniform within each cell volume as well as at each cell surface at any point in time.
FIGURE 2.

The main features of the model. (A) 13 × 13 node portion of the network. In this example, cells (whose centers are illustrated by the small circles) were assigned to nodes with 80% probability. Tier 5 is represented by a circular crown of thickness equal to one internodal distance. Note the nonuniform cell density within the tier. (B) Agonist release, diffusion, binding, and degradation. The central cell (located at the node (0,0) in A) is externally stimulated with an energetically quantifiable stimulus [ɛ] and due to the independent transduction events EATP and EUTP it immediately releases single amounts of ATP (A) and UTP (U). The agonists diffuse (D = diffusion coefficient) through the solution and irreversibly bind to P2X and P2Y receptors on the cell surface (shaded; note that in this illustration only the extracellular cell surfaces are relevant). The agonist is degraded both in the solution by exo-nucleotidases (EXO) and at the membrane surface by the ecto-nucleotidases (ECTO). The first degradation product, A′ or U′, may be an additional active agonist for certain P2Rs. The next degradation step produces compounds without agonist activity, all denoted by the generic letter ä. (C) Ca2+ influx induced by ionotropic activity. Agonist binding to ionotropic P2XRs opens channels through which Ca2+ diffuses from the medium into the cell. Notations: a(m,n;t) = agonist on node (m,n) at time t, where (m,n) denotes the location of the cell in a Cartesian system centered on the stimulated cell;  and
and 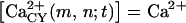 concentrations in bulk solution, endoplasmic reticulum, and cytosol; and VSO and VCY(m,n) = volume of bulk solution and of cytosol. Basal Ca2+ concentration is restored in time by sequestration of Ca2+ ions into the ER with the rate η(m,n) and/or extrusion in the extracellular medium with the rate ψ(m,n) through the calcium-extrusion pump (CE). (D) Generation of intracellular Ca2+ pulse in cells expressing metabotropic P2YRs and in cells interconnected through gap junction channels with cells expressing P2YRs. Agonist binding to P2YRs initiates a series of intracellular reactions leading to IP3 generation. IP3 then diffuses within the cytosol and to the neighboring cells through the C(m,n;m+i,n+j) gap junction channels having the IP3 permeability Γ, releases Ca2+ from IP3-sensitive stores of the endoplasmic reticulum (ER), and is degraded within the cytosol with the rate κ(m,n). As illustrated for the cell in the upper right corner, increase in cytosolic Ca2+ can occur also in cells that lack P2 receptors if they are interconnected via gap junction channels with cells producing IP3.
To account for the variability of expression levels of enzymes, transducers, receptors, and gap-junction channels, the simulation program (see Supplementary Material) allows values of these parameters to be fixed or randomly selected for each cell in the network within corresponding Gaussian distributions centered on user-defined value intervals (extended for three standard deviations around the mean). For the simulations included in this article we have chosen fixed values of the parameters (indicated in figure legends and Table 2) to simplify understanding of their contribution to the ICW.
TABLE 2.
Values of P2 receptor saturation (θ), half-maximum (H), and minimum (M) concentrations used in the simulations
| Saturation (θ)
|
Half-maximum concentration (H) (μM)
|
Minimum concentration (M) (μM)
|
||
|---|---|---|---|---|
| P2R and agonists | Ca2+ influx (10−18 mol M−1 s−1) | IP3 formation (10−21 mol s−1) | ||
| P2X4R | ||||
| ATP | 20.0 | 0.3 | 0.03 | |
| P2X7R | ||||
| ATP | 20.0 | 100.0 | 1.0 | |
| P2Y1R | ||||
| ATP | 25.0 | 0.3 | 0.03 | |
| ADP | 25.0 | 0.01 | 0.001 | |
| P2Y2R | ||||
| ATP | 25.0 | 3.0 | 0.01 | |
| UTP | 25.0 | 0.3 | 0.01 | |
| P2Y4R | ||||
| ATP | 8.0 | 3.0 | 0.1 | |
| UTP | 8.0 | 3.0 | 0.1 | |
The central cell is externally stimulated with an energetically quantifiable stimulus [ɛ], and due to transduction events, it immediately releases discrete amounts of ATP and UTP (A and U in Fig. 2 B) that are logistically dependent on the stimulus energy. As illustrated in Fig. 2 B, we have explicitly split the transduction events as EATP and EUTP, allowing separate activation and therefore, independent release of these two agonists. The amount of the released agonist may range between 1% and 10% of the cellular content (∼26.4 fmol ATP and 5.2 fmol UTP for astrocytes, and ∼7.5 fmol ATP and 2.1 fmol UTP for the 1321N1 cells (32)). Although several distinct mechanisms for transmitter release from glial cells have been proposed (e.g., exocytosis, diffusion through ion channels; see Parpura et al. (33)), in this model we have considered that only the externally stimulated cell releases agonists, regardless of the underlying mechanism of release. However, both EATP and EUTP can be further subdivided into EATP1, EATP2, EATPn, and EUTP1, EUTP2, EUTPn to account for various types of release mechanisms. The agonist a (labeled A for ATP and U for UTP in Fig. 2 B) diffuses (with the diffusion coefficient D indicated in Fig. 2 B) through the solution, and instantaneously and irreversibly binds to cell surface P2X and P2Y receptors. Both in the solution and at the membrane surface the agonist is degraded in two steps (summarized in Fig. 2 B) by removal of phosphate groups. The first degradation product, å (labeled in Fig. 2 B as A′ or U′ for hydrolysis of ATP and UTP, respectively), may be an additional active agonist for certain P2Rs, as in the case of ADP obtained by ATP hydrolysis, which is an agonist for P2Y1R. In this model we have neglected the potential agonistic activity of other degradation products such as AMP, adenosine, or uridine, all denoted by the generic letter ä. Degradation is catalyzed at the membrane surface by various ecto-nucleotidases (e.g., NTPDase1 and NTPDase2, denoted as ECTO in Fig. 2 B) and in the bulk solution by exo-nucleotidases (e.g., NPP1, NPP2, denoted as EXO in Fig. 2 B) (34). Enzyme concentration is significantly higher at the membrane surface than in the bulk solution, thereby rapidly degrading the bound agonists and terminating their action on the P2 receptors. As shown in Fig. 2 C, agonist binding to ionotropic P2XRs opens channels through which Ca2+ diffuses from the medium into the cell. Since 1) Ca2+ concentrations in both bulk solution  and endoplasmic reticulum (ER) stores,
 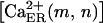 (where (m,n) denotes the node locating the cell in a Cartesian system centered on the stimulated cell), are much higher (≈1 mM) than the cytosolic concentration,
  (50–200 nM) at any moment t; and 2) the extracellular volume VSO is much larger than the sum of all cell volumes,
  ; and 3), at any moment, in any cell, most of the intracellular Ca2+ is located in the Ca2+-stores of the endoplasmic reticulum, i.e.,
  the Ca2+ gradients are practically constant during the spread of ICWs and therefore the Ca2+-fluxes are modulated only by receptor activity. Ca2+ entry exhibits a logistic dependence on agonist concentration in the vicinity of the receptor and is proportional to the number of receptors and to the [Ca2+] gradient. Basal Ca2+ concentration is restored by sequestration of Ca2+ ions into the ER with the rate η(m,n) and/or extrusion in the extracellular medium with the rate ψ(m,n) through the calcium-extrusion pump (CE in Fig. 2 C).
Fig. 2 D displays the Ca2+ responses generated in cells expressing metabotropic P2YRs that are interconnected through gap junction channels to other P2YR-expressing cells. Agonist binding to P2YRs initiates a series of reactions leading to IP3 generation. For each type of P2YR, production of IP3 exhibits a distinct logistic dependence on agonist concentration at the cell surface and is proportional to the number of receptors. IP3 then diffuses within the cytosol of the stimulated cell and to the neighboring cell through the C(m,n;m+i,n+j) gap junction channels, having a defined permeability Γ(m,n;m+i,n+j), where it releases Ca2+ from IP3-sensitive stores of the ER (7); IP3 is then degraded within the cytosol with the rate κ(m,n). Ca2+ elevations can also occur in cells that lack P2 receptors only if they are interconnected via gap junction channels with cells producing IP3. Ca2+ release exhibits a logistic dependence on IP3 concentration in the vicinities of the IP3 receptors, with the average parameters: 0.3 μM half-saturation constant for IP3 activation of IP3 receptors, 0.4 s−1 rate constant for IP3 receptor activation, 0.08 s−1 rate constant of Ca2+ release, and 4 s−1 rate constant for IP3 receptor inactivation (35). Efficient local Ca2+ buffering mechanisms largely limit Ca2+ liberation from Ca2+-sensitive calcium stores. Because direct intercellular Ca2+ diffusion through gap junction channels is not expected to be significant, we have not included it in the model. In our model, the values of all parameters are independently assigned to each cell. In cases in which no quantitative information is available about a particular feature (such as, for instance, the energy of the stimulus, the numbers of transducers and receptors), we used the interval (0,100).
Network and bulk solution
The network is immersed in a solution containing a constant and uniform concentration of Ca2+ (1 mM) and of exo-nucleotidases [x] (x = x1, x2, …). Also constant and uniform are the diffusion coefficients DATP and DUTP of the agonists (2 × 10⁻¹⁰ m2/s; 37) and their degradation rates δx,ATP, δx,UTP due to exo-nucleotidase activity. The value intervals of the degradation rates were selected so that the half-times of the agonist in the solution are in the range of 12–25 min (as observed by Lazarowski et al. (36)) when the concentrations of the nucleotidases are in the range of hundreds of nanomoles.
Each node (m,n) is assigned cell occupancy OCC(m,n) (= 0, 1) with the probability p randomly selected from the interval of cell confluences (80–90%). The procedure to assign features to the network is described in section 1a in the Supplementary Material. The centers of the most distal cells (at the corners of the network) are at the distance  from the central one.
Individual cell features
Each cell (located at node (m,n)) is assigned constant values for the cellular volume V(m,n), the steady-state concentrations of Ca2+ within the cytosol  and within the Ca2+-stores of the ER
  the concentrations [z(m,n)] and the degradation rates δz,a(m,n) and δz,å(m,n) of several (z = z1, z2, …) ecto-nucleotidases on the membrane surface, the numbers {r(m,n)} of pre-established types of energy transducers (r = EATP, EUTP) and P2X, P2Y, and IP3 receptors, as well as the rates of Ca2+-sequestration η(m,n) and extrusion ψ(m,n), and the degradation rate of IP3, κ(m,n), according to procedure 1b in Supplementary Material.
Intercellular communication
Each pair (m,n; m+i,n+j) of neighbor cells (up to eight neighbors per cell) is assigned the number C(m,n; m+i,n+j) and permeability Γ of gap junction channels according the procedure 1c in the Supplementary Material.
We considered that each gap junction contains 30–170 Cx43 channels with a total conductance of 3–17 nS as measured in astrocytes (37,38) and in Cx43 transfected astrocytoma cells (D. C. Spray, unpublished results), with the value of junctional permeability (in mol s−1 M−1) derived from that used in the model of Hofer et al. (39). Input parameters in the Supplementary Material can be changed to fit other cell types and experimental conditions.
MODEL EQUATIONS AND SIMULATIONS
Activation of transducers and receptors
In this model we considered that any transducer or receptor r on the cell located in the generic node (m,n) responds after the latency Lr,s(m,n) to the specific stimulus s whose intensity [s](m,n;t) at the moment t of application exceeds the threshold Mr,s(m,n) by the response θr,s(m,n;t+Lr,s(m,n)) that satisfies the classical logistic dose-response relationship
 |
(1) |
where Θr,s(m,n) is the saturation response, Hr,s(m,n) is the stimulus intensity eliciting half-saturation response, and Qr,s(m,n) is the Hill slope.
The response differs from one cell to another mainly due to differences in the number of receptors on each cell. The values of the logistic activation parameters may be fixed (as are the values from Table 2 used in the illustrations below) or selected from the user-defined value intervals according to procedure 1d in the Supplementary Material.
Agonist release, diffusion, and degradation in solution
The simplest stimulation paradigm involves the central cell receiving a single stimulus of defined energy [ɛ] < [ɛmax], where [ɛmax] is the maximal stimulus energy that preserves cell integrity, and negligible duration. After the latencies LATP (≡ LEATP,ɛ (0,0)) and LUTP (≡ LEUTP,ɛ (0,0)), the central cell releases single amounts of ATP and UTP, {ATP}o and {UTP}o, that are proportional to the number of transducers {EATP} and {EUTP} and the logistic responses θEATP,ɛ (0,0; LATP) and θEUTP,ɛ (0,0; LUTP) of the corresponding transducers of the stimulus intensity ɛ.
Fig. 3 A presents simulations of agonist release from the central cell (node 0,0) induced by increasing stimulus energy and activation of randomly assigned numbers of transducers {EATP} or {EUTP}. Note that the amount of agonist released is markedly affected not only by the stimulus energy (% of ɛmax) and numbers ({EATP}, {EUTP}) of activated transducers but also by each of the activation parameters. Although for a similar number of transducers, higher Hill slope (Q) values elicit more rapid agonist release, the total final amount of agonist released depends not only on the stimulus energy but also on the transducer saturation values (Θ).
FIGURE 3.

Agonist release and degradation in the solution. (A) Logistic dependence of the total amount of agonist (ATP or UTP) released instantaneously by a mechanical stimulus (ɛ) upon a cell located at node (0,0) at time 0. The stimulus is a percentage of the unknown energy ɛmax, which is the maximum intensity that can stimulate the cell without damaging it. Note that for a particular stimulus energy (ɛ/ɛmax), any changes in energy receptor parameters ({ENE} = {EATP} or {EUTP}, number of energy transducers, Θ = saturation release of agonist, M = minimum energy for agonist release, H = energy necessary to release half-maximal amount of agonist stored within the cell, Q = slope of the sigmoidal stimulus intensity-agonist release curve) greatly affect the amount of agonist released by the stimulated cell. (B and C) Timecourse of changes in the total amount of ATP (B) and ADP (C) in the system due to exo-nucleotidase activity. Note that the increase in arbitrarily set concentrations of the exo-nucleotidase [x] = 0.01, 0.1, and 1 μM speeds the degradation of ATP in the system (B) and increases the amount of generated ADP (C). Because ADP is also degraded by exo-nucleotidases, the amount of ADP in the system at any moment is smaller than the initially released amount of ATP. Input parameters for central cell stimulation: ɛ/ɛmax = 10%, {EATP} = 90, Θ(EATP,ɛ) = 5 × 10⁻¹⁸ mol s−1, H(EATP,ɛ) = 10−2ɛmax, Q(EATP,ɛ) = 1.5, L(EATP1,ɛ) = 1 s, and M(EATP,ɛ) = 10−3ɛmax; exo-nucleotidase parameters set arbitrarily as [x] = 0.01, 0.1, and 1 μM, degradation rates δ (× 103 M−1 s−1) for ATP = 5, ADP = 2.
The exo-nucleotidases in the bulk solution and ecto-nucleotidases at the cell membranes degrade nucleotide triphosphates to di- and monophosphates. Both released and degraded nucleotides diffuse through the homogeneous bulk solution. This system consists of a continuous and uniform distribution of enzymes in bulk solution superimposed on a discrete nonhomogeneous stochastic distribution of degrading enzymes at the cell surface. Such a reaction-diffusion problem can be numerically solved by using finite differences or Monte Carlo methods. However, due to the very small percentage of the system volume that is occupied by cells, the amount of bound and degraded agonist is negligible with respect to the total amount in the system at each moment and can be neglected. With this approximation, the timecourse of total amounts of agonists in the bulk solution satisfies the differential equations,
 . .
|
(2) |
Fig. 3, B and C, displays simulations of the timecourse of the total amount of ATP and generated ADP, respectively, in the system for selected values of the input parameters for a single type of exo-nucleotidase. Note that increasing the concentration of the enzyme in the bulk solution significantly accelerates ATP removal from the system and consequently generation of ADP. However, the total amounts of ADP formed in the first 2 min after stimulation (when ICWs may be observed) are negligible, as compared to those of ATP. Even at 10 min after stimulation, when the maximal amounts of ADP generated in the bulk solution by exo-nucleotidase ([x] = 0.1 μM) activity is observed, the concentrations of ADP at the nodes that would bind to membrane receptors would still be negligible because of the large volume in which ADP is diluted. Therefore, we can neglect the ADP and also UDP formed in the bulk solution and only consider the amounts of ADP and UDP generated at the membrane surface through the action of ecto-nucleotidases. The concentrations of ATP and UTP in the proximities of the nodes (identified by the Cartesian vector  with the origin in the node locating the stimulated cell), before binding to membrane receptors satisfy the reaction-diffusion equations derived from the expressions in Eq. 2 for elementary volume, in which the total time derivative d/dt was decomposed into the partial time derivative ∂/∂t and the diffusion operator −Da∇2 (40), are
 , ,
|
(3) |
where σ is the standard deviation of the Gaussian distribution of concentrations.
In the absence of degradation, the right term of Eq. 3 is zero and the solution is a Gaussian distribution of concentrations in the half-space (no diffusion below the cell layer) at any moment t; the distribution is centered on the node locating the stimulated cell and has the area below the distribution curve equal to the released amount {a}o. The uniform degradation in the bulk solution does not affect the diffusion time to the nodes but diminishes the areas below the distribution curves by the factor  Considering initial point sources for ATP and UTP (i.e., σATP(t ≤ LATP) = σUTP(t ≤ LUTP) = 0) and the dynamics of the standard deviation
  (41), agonist a reaches its maximal concentration in the proximity of the node (m,n) at time Ta(m,n) after stimulation:
 . .
|
(4) |
For the average values of λ = 20 μm and DATP ≈ DUTP ≈ 2 × 10⁻¹⁰ m2 s−1, the maximal concentration of agonists at nodes (0,1), (0,2), and (0,3) is obtained after 1, 4, and 9 s, after their release by the central cell in addition to the transducer latency, which is in agreement with the experimental data (see Fig. 1 B).
Agonist binding and degradation at membrane surface
Since only the central cell releases agonists, and practically the entire diffusion-reaction pathway (before binding to the membrane receptors) is located in the bulk solution above the cell layer, initial agonist concentration is the same for all nodes located at the same distance from the stimulated cell and can be determined from Eq. 3 for r = σ = χ(m,n)λ for the cell located in the node (m,n) and r = σ = λ/2 for the central cell. However, the timecourse of the concentration varies among the cells from the same tier due to local variability in the concentrations of ecto-nucleotidases that degrade the bound agonists. Therefore, the timecourses of the agonist concentrations at the membrane receptors are described by
 . .
|
(5) |
Fig. 4 displays simulations of the timecourse of the agonist concentrations for cells located at nodes (0,0), (0,1), (0,2), and (0,3) of a square grid for two different concentrations of ecto-nucleotidases. Note that for the same distance of diffusion, the amount of agonist that reaches the cell and is further degraded is significantly altered by changes in the concentrations of enzymes.
FIGURE 4.

Timecourse of changes in the concentration of (A) ATP, (B) ADP, and (C) UTP at the membrane surface of cells located in nodes (0,0), (0,1), (0,2), and (0,3). In these simulations the central cell (node 0,0) is mechanically stimulated and releases ATP and UTP. We assigned the same number of transducers for ATP ({EATP}) and UTP ({EUTP}) release and chose their activation parameters so that the ratio of the released amounts of ATP and UTP is 3:1, as observed by Lazarowski and Harden (32) (leftmost graphs in A and C). Observe the delay of the release of agonist by the stimulated cell at node (0,0) and the time necessary for the agonist to reach cells located at consecutive nodes (0,1), (0,2), and (0,3). Also illustrated is the effect of increased concentrations of ecto-nucleotidases ([z] = 0.01 and 0.1 μM) on the amount of bound agonists on cells at consecutive nodes in the grid. Input parameters are as in Fig. 3, with diffusion coefficient for ATP and ADP in the solution D = 2 × 10⁻¹⁰ m2 s−1 (56), {EATP} = {EUTP} = 80, exo-nucleotidases concentrations [x1] and [x2] = 0.01 μM, and degradation rates (× 103 M−1 s−1) for ATP = 5, ADP = 2, UTP = 4, and UDP = 1, ecto-nucleotidases [z1] = [z2] arbitrarily set as 0.01 or 0.1 μM, z1 degradation rates (× 103 M−1 s−1) ATP = 400, ADP = 350, UTP = 350, UDP = 250; and z2 degradation rates ATP = 450, ADP = 200, UTP = 400, and UDP = 100. The differences in degradation rate constants for z1 and z2 in relation to ATP and ADP are based on data described by Kukulski and Komoszynski (57) for NTPDase1 and NTPDase2.
The interval Ir,s(m,n) from the moment of stimulation after which the receptor r on the cell located at node (m,n) responds to agonist a or å is the sum of the above defined time Ta(m,n) (transducer latency + diffusion time to the node (m,n)) and the receptor latency L r,s(m,n).
Activation of P2X receptors and Ca2+ influx
The logistic response of P2X receptor r (= P2Xi |i = 1,2,3,4,5,6,7) to the stimulus s (= [ATP]), θr,s(m,n;t) is the permeability to Ca2+ (in mol M−1 s−1). The interval values of the activation parameters are different for each P2X receptor subtype (42). We considered that the total Ca2+ influx through the membrane of the cell located at node (m,n), ΦSO(m,n;t) is the sum of Ca2+ influxes through all P2XRs, independently activated by the agonist. Since  and
and  is negligibly affected by the amount entering the cells, the total Ca2+ influx is
 . .
|
(6) |
Simulations of Ca2+ influx and of increase in cytosolic Ca2+ levels due to activation of P2XR expressed by cells located at nodes (0,0), (0,1), (0,2), and (0,3) are illustrated in Fig. 5. In these simulations, we considered a single subtype of P2X receptor (P2X4R).
FIGURE 5.

Ca2+ entry through P2X receptors. In these simulations, the time courses of Ca2+ influx (A) and cytosolic Ca2+ levels (B) due to activation of P2X4 receptors are shown for cells located in nodes (0,0), (0,1), (0,2), and (0,3). Because in this model Ca2+ influx does not promote Ca2+ release from internal stores and is actively removed from the cytosol by ER sequestration and extrusion to the extracellular medium, the kinetics of the P2X4R-mediated increase in cytosolic Ca2+ are strongly determined by those of the Ca2+ influx. Input parameters for central cell stimulation, diffusion coefficient for agonists, and nucleotidase degradation rates are the same as in Fig. 4. Amounts of ATP and UTP released = 0.47 fmol (∼98 μM ATP initial concentration at the central cell surface) and 0.15 fmol (∼32 μM UTP initial concentration at the central cell surface). Exo-nucleotidase concentration set arbitrarily as [x1] and [x2] = 0.01 μM and ecto-nucleotidases [z1] = 0.1 μM and [z2] = 0.01 μM. Number of P2X4Rs on the center stimulated cell (node 0,0) and on cells located on the other nodes was respectively fixed as 100% and 80% of the maximum number that may exist on the membrane for each cell. Other P2X4R parameters are listed in Table 2; Hill-slope Q is 1.5 and latency L is 0.5 s. Basal cytosolic and ER concentrations of [Ca2+],  and
and  ; sequestration rate η(m,n) = 0.2 s−1; extrusion rate ψ(m,n) = 0.2 s−1.
Activation of P2Y receptors, IP3 formation, degradation and diffusion through gap junction channels, and Ca2+ mobilization from ER stores
Agonist binding to P2Y receptors initiates a series of reactions leading to IP3 formation. We assumed independent activation of each receptor by each of the agonists and independent reactions to form IP3 using logistic dose-response relations to describe P2Y receptor (23,31).
The IP3 formation rate  (in mol s−1) at moment t in the cell located at node (m,n) is
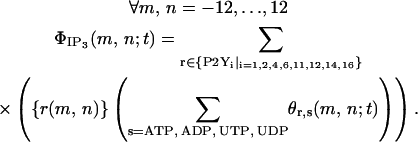 |
(7) |
IP3 undergoes degradation within the cytosol and also diffuses to neighboring cells through gap junction channels. Since no IP3 circulates outside cells, the dynamics of IP3 concentration within the cell located at node (m,n) at time t, [IP3(m,n;t)], can be described by
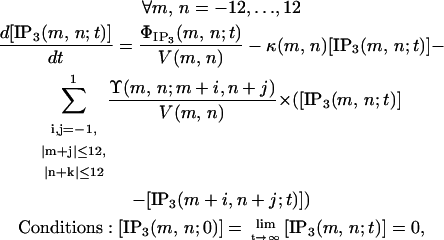 |
(8) |
where V(m,n) is the cell volume, κ(m,n) is the degradation rate, and Y(m,n;m+i,n+j) is the product between the number and permeability of gap junction channels interconnecting the cells located at nodes (m,n) and (m+j,n+k).
IP3 mediates the release of Ca2+ from the ER. Experimental data (43) indicate that Ca2+ release is logistically dependent on the cytosolic concentration of IP3 and Coombes et al. (44) analyzed how the stochastic nature of individual IP3 (and ryanodine) receptors of the ER combine to create a stochastic behavior on long timescales that may ultimately lead to waves of activity in a spatially extended cell model of myocytes. Therefore, we considered the response of each IP3 receptor (in mol M−1 s−1) to be satisfactorily described by the logistic function from Eq. 1.
Ca2+ flux from the ER to the cytosol, ΦER, is proportional to the difference  to the number of IP3 receptors, and to the Ca2+ permeability of each IP3 receptor:
 . .
|
(9) |
Fig. 6 displays simulations of the dynamics of IP3 formation rate and concentration as well as of intracellular Ca2+ concentration due to Ca2+ release from the ER of cells located at nodes (0,0), (0,1), (0,2), and (0,3), induced by P2Y2R activation in the absence of gap junction channels. IP3 formation upon agonist binding and receptor activation is considered to be instantaneous and formation rate to depend on agonist concentration, number of P2Y receptors on the membrane and receptor properties (saturation (Θ), half-maximal concentration (H), threshold (M), slope (Q), and latency (L)). For this simulation, all receptor parameters were fixed. Therefore, the delay in the responses of cells located in different nodes and the differences between IP3 formation rates are solely attributed to agonist diffusion and degradation by nucleotidases that determine the concentration of agonists at each node and the level of P2Y2R activation. Note the temporal decrease in the rate of IP3 formation (Fig. 6 A) at each node caused by the decrease in receptor activation as ATP and UTP are removed from the system by nucleotidase action. The accumulation of IP3 in the cytosol (Fig. 6 B) will be mainly determined by the rate of IP3 formation and IP3 degradation. Note that for the same degradation rate, IP3 accumulates faster and displays higher final cytosolic concentrations in the center cell (node 0,0) than in neighboring cells. However, because of the low threshold for IP3 receptor activation (M = 0.03 μM), Ca2+ is promptly released from the ER followed P2YR activation. Final cytosolic Ca2+ concentrations will depend on the level of P2YR activation, on the rate of IP3 degradation, and on the rate of Ca2+ removal from the cytoplasm due to extrusion and ER sequestration (see below). Note that despite the differences between IP3 formation rate and concentration observed between the stimulated cell (node 0,0) and its immediate neighbor (node 0,1), they display similar maximal intracellular Ca2+ concentrations. This occurs because the peak concentration of IP3 at node (0,1) exceeds the concentration required for maximal activation of IP3 receptors (half-maximal set as H = 3 μM) and Ca2+ release from the ER. Observe that for the cell at node (0,2), where the final concentration of IP3 is close to the value inducing half-maximal activation of IP3 receptors, the amount of Ca2+ mobilized from the ER is half that observed for the cells at nodes (0,0) and (0,1).
FIGURE 6.

Activation of P2Y receptors. In these simulations the rate of IP3 formation (A), intracellular IP3 concentration (B), and resultant increase in cytosolic Ca2+ due to IP3-mediated Ca2+ mobilization from the ER (C) of cells located at nodes (0,0), (0,1), (0,2), and (0,3) are shown for activation of a single P2YR subtype, the P2Y2R that is sensitive to both ATP and UTP, but insensitive to ADP. For these simulations, the number of P2Y2R on each node is the same. The differences observed between IP3 formation rates, intracellular concentration, and resultant cytosolic [Ca2+] observed between cells are due to agonist diffusion and degradation by nucleotidases, resulting in different levels of P2Y2R activation. Note the temporal decrease in the rate of cellular IP3 formation (A) at each node due to decrease in receptor activation as ATP and UTP are removed from the system by nucleotidase action. Observe also how the rapid formation of IP3 leads to a steady accumulation of IP3 in the cytosol and increased [Ca2+] that reach a plateau and then decay because of decreased P2Y2R activation. Input parameters for central cell stimulation, diffusion coefficient for agonists, nucleotidase concentrations, degradation rates, and amounts of ATP and UTP released from central cell are the same as in Fig. 5. The number of P2Y2Rs on the center stimulated cell (node 0,0) and on cells located on the other nodes was respectively fixed as 100% and 80% of the maximum number that may exist on the membrane for each cell. Other P2Y2R parameters are listed in Table 2; Hill-slope Q is 1.5 and latency L is 0.5 s. We fixed the number of IP3Rs at 80% of the maximum number that may exist in the cell and the IP3 degradation rate, κ(m,n) at 0.08 s−1. Parameters for Ca2+ concentrations, extrusion, and sequestration rates are the same as in Fig. 5.
Dynamics of cellular [Ca2+]
Recovery mechanisms restore basal Ca2+ concentration in the cytosol, and largely prevent Ca2+-diffusion through the gap junctions by sequestering excessive Ca2+ into the ER with rate η(m,n) and extruding Ca2+ in the bulk solution with rate ψ(m,n). Both processes are reversible. Therefore, the dynamics of Ca2+ concentration within the cell located at node (m,n) are described by
 . .
|
(10) |
Simulations of changes in intracellular Ca2+ concentration of cells located at nodes (0,0), (0,1), (0,2), and (0,3), when activation of ionotropic and metabotropic receptors are considered separately and combined but in the absence of IP3 diffusion through gap-junction channels, are presented in Fig. 7.
FIGURE 7.

Individual and combined contribution of P2X and P2Y receptors to Ca2+ signal generation in the absence of gap-junction channels. In these simulations, the Ca2+ signals generated by activation of a particular P2R subtype (A–E) are solely attributed to the properties of each receptor in relation to their agonists (saturation (Θ), half-maximal concentration (H), threshold (M), and slope (Q)). The number of P2Rs on cells located in nodes (0,0), (0,1), (0,2), and (0,3) is the same, {P2Y1,2,4} and {P2X4,7} = 80% of the maximum number that may exist on the membrane for each cell, Hill-slope Q is 1.5, and latency L is 0.5 s for all P2Rs. Note that for the same stimulation conditions and amount of agonist reaching each node (determined by diffusion and nucleotidases activity) the Ca2+ response of each cell differs according to P2R subtype present. Due to the higher sensitivity of the P2Y1Rs to ATP and also its responsiveness to ADP that is generated both in the solution and at each node from ATP degradation by nucleotidases, all cells in the simulation display Ca2+ responses with similar amplitudes (A). In the case of the P2Y2R (B) and P2Y4R (C) that are sensitive to ATP and UTP but insensitive to ADP, the nucleotidase activity restricts the range of the Ca2+ signaling as cells located farther from the center cell will be reached by smaller amounts of agonists (amplitude of the Ca2+ response decays from node (0,0) to (0,3)). The differences in Ca2+ wave spread for cells expressing the P2X4R (D) or the P2X7R (E) are due to the lower sensitivity of P2X7R to ATP, and therefore only the cells closest to the central cell respond. Part F shows Ca2+ responses in cells expressing P2Y1,2 and 4R and P2X4 and 7R. Note that although the Ca2+ amplitudes are higher than those induced by activation of single P2R subtypes (A–E), they are smaller in cells located farther from the stimulated cell. Input parameters for central cell stimulation, diffusion coefficient for agonists, nucleotidase degradation rates, and amounts of ATP and UTP released from central cell are the same as in Fig. 5. Exo-nucleotidase concentration set arbitrarily as [x1] and [x2] = 0.01 μM and ecto-nucleotidases set as [z1] = 0.1 μM and [z2] = 0.01 μM. Parameters for Ca2+ concentrations, extrusion and sequestration rates are the same as in Fig. 5. Parameters for IP3R and IP3 degradation rate are the same as in Fig. 6. Parameters for P2Rs are listed in Table 2.
To simplify the simulations displayed in Fig. 7, the number of P2 receptors and the values of all parameters except those associated with receptor properties were kept constant and uniform for all cells. Therefore, the differences in the Ca2+ signal generated by activation of a particular P2R subtype were solely attributed to the properties of each receptor in relation to their agonists (saturation (Θ), stimulus producing half-maximal response (H), threshold (M), Hill slope (Q), and latency of the response (L)). As agonist concentration in the bulk solution is the same in equally distant nodes from the stimulated cell and the latency of response (L) was set to be the same for all P2Rs, the characteristic differences in activation thresholds of each P2R subtype determines whether and when a response is observed in these nodes. The amplitude and the timecourse of the Ca2+ signal also differ owing to the differences in Θ, H, M, and Q. In cases where the transmission of the Ca2+ signal is mediated by activation of a single P2R subtype, the properties of the ICW are mainly determined by the receptor properties. For instance, in 1321N1 cells expressing P2Y1R, the spread of ICW recruits a similar percentage of cells per tier, while the waves mediated by P2Y2R activation have a decremental profile, with reduced percentage of responding cells per tier as the Ca2+ signal travels from the central stimulated cell (31). These differences in ICW profiles can be attributed to the higher sensitivity of P2Y1R to ATP and the conversion of ATP into ADP (see Figs. 3 and 4), which is an agonist for P2Y1R but not for P2Y2R. Fig. 8 compares the experimental data obtained from 1321N1 cells expressing single P2YRs with simulations of P2R-mediated ICW spread profiles that were determined from consecutive simulations performed as described in Fig. 7. Note that the model closely reproduces the ICW profiles mediated by each P2YR subtype.
FIGURE 8.

P2 receptor-mediated intercellular Ca2+ wave profiles. Simulations and experimental data obtained for intercellular Ca2+ waves (ICW) triggered by focal mechanical stimulation of the central cell (node 0,0) showing the efficacy of the Ca2+ signal spread (relative number of responding cells per tier). (A, C, and E). Efficacies of P2YR-mediated Ca2+ signaling calculated from consecutive simulations performed using parameters described in Fig. 7. All parameters, except those that characterize the P2R properties in relation to their agonists (saturation (Θ), half-maximal concentration (H), threshold (M) and slope (S)) were fixed. (B, D, and F) Experimental data obtained from P2YR-expressing 1321N1 cells (31). The figures illustrate changes in efficacies of the Ca2+ signal transmission depending on which P2YR subtype is being activated. Simulations are in agreement with experimental data as shown for ICWs mediated by P2Y1Rs, which enroll a small but uniform number of cells per tier (compare A and B), and for waves mediated by P2Y2R activation with efficacies higher in the tiers closer to the central cell and decaying as the signal spreads farther from the center (C and D). Simulated P2Y4R-mediated ICW spread also resembles that obtained experimentally and is characterized by its restricted profile, with only a small number of responding cells per tier (E and F).
When gap junction channels are present, the intercellular diffusion of IP3 generated by P2YR activation can significantly contribute to ICW spread. Fig. 9 simulates the sole contribution of gap-junction channels to Ca2+ signal transmission. For these simulations, the center cell (node 0,0) is the only cell expressing a P2YR subtype (P2Y1R); in the absence of gap junction channels, the IP3 generated by activation of P2Y1Rs on the center cell (node 0,0) (Fig. 9 A) and the resultant increase in intracellular Ca2+ concentration (Fig. 9 C) are confined to the stimulated cell. However, in the presence of gap junction channels (Fig. 9 B), the IP3 generated in the stimulated cell (node 0,0) diffuses to neighboring coupled cells according to its concentration gradient and induces release of Ca2+ from the ER of these cells, triggering ICW spread. Because IP3 diffusion through gap junction channels is driven by the IP3 concentration gradient, the presence of gap junction channels is expected to minimize eventual differences in IP3 concentration and Ca2+ amplitudes between cells expressing for instance distinct levels of P2Y1Rs. As shown by the simulation in Fig. 9 E, where uncoupled cells express different numbers of P2Y1Rs, the latency for the response still follows the agonist diffusion rate, but the Ca2+ signals peak faster in cells expressing more P2Y1Rs (located at nodes (0,2) and (0,3)) than cell expressing few receptors (located in node (0,1)); this situation leads to what we have called a saltatory profile of ICW spread (31; Fig. 9 E). In contrast, in the presence of gap junction channels (Fig. 9 F), the differences in IP3 concentration generated in cells located at nodes (0,1), (0,2), and (0,3) are attenuated, which ultimately minimizes the difference in the Ca2+ signal amplitude, leading to a decremented ICW spread (31; compare Fig. 9, E and F).
FIGURE 9.

Contribution of gap-junction channels to intercellular transmission of Ca2+ waves and impact of cell coupling on P2 receptor-mediated intercellular Ca2+ wave (ICW) spread. The sole participation of gap junction channels in the spread of ICWs due to the intercellular diffusion of IP3, is illustrated in the simulations A–D where P2Rs were removed from all cells with the exception of the center one (node 0,0) that express 100% of the P2Y1R subtype. Upon stimulation, the center cell responds with an increase in cytosolic IP3 (A) and Ca2+ (C) concentrations that are confined to the stimulated cell. However, in the presence of gap junction channels, the increase in IP3 concentration in the stimulated cell generates a concentration gradient between this and the neighboring coupled cells, leading to IP3 diffusion (B). Increases in IP3 concentration in the nonstimulated cells induce Ca2+ release from the ER and triggers ICW spread (D). Simulations in E and F illustrate P2YR-mediated ICW spread in the absence and presence of gap junctions, respectively; in E, cells are uncoupled and all express P2Y1Rs but with different levels, with the cells at nodes (0,2) and (0,3) expressing higher numbers of P2Y1Rs than the cell at node (0,1). In this case, the Ca2+ signals in cells located at nodes (0,2) and (0,3) peak faster than the one generated in node (0,1), creating what we have called a saltatory ICW spread (31). In the presence of gap junction channels (F), the differences in IP3 concentration levels and by consequence in Ca2+ amplitudes seen in cells expressing distinct numbers of P2Y1Rs (compare to E) are attenuated due to the diffusion of IP3 between the coupled cells. Such dissipation of large IP3 concentration gradients between cells alters the behavior of ICW, which assumes a decremental profile of spread. All parameters, with the exception of number of P2Y1Rs, are the same as in Fig. 7. The number of gap junction channels was fixed at 80% of the total number of channels that can be formed and channel permeability (Γ) was fixed at 0.6 × 10⁻¹² mol M−1 s−1.
Numeric solution
Because the system (Eq. 8) of 25 × 25 (= 625) equations has no analytical solution due to the dependence of each cell's response on that of its neighbors, the numerical procedure is the single alternative. For such numerical solution, the timestep τ was considered equal to the 10th part of the required time for the agonist to diffuse the first internodal distance. The iteration timestep is small enough to approximate each latency and diffusion time as multiples of timesteps:
 |
where int (A/B) designates the integer part of the ratio A/B.
DISCUSSION
Calcium signal transmission between astrocytes was first described 15 years ago (45,46) and was initially thought to be mainly attributable to the diffusion of Ca2+ mobilizing second messengers through gap junction channels (9), to which they were shown to be permeable (47). Later, it became apparent that activation of membrane receptors linked to the formation of IP3 and/or Ca2+ played a significant role in such long-range signal transmission (13), as evidenced by purinergic receptor-activated spread in immune cells (48).
To better understand the phenomenon of calcium waves, mathematical models were generated to provide insights into the mechanisms involved on their initiation, propagation, and termination. The first models generated considered only a few parameters, which then evolved to more complex models as new experimental data and concepts were generated. However, the several models that have been presented previously have been limited to simulation of either extracellular or intercellular modes of Ca2+ wave transmission and therefore represent analyses of different aspects of ICWs. For instance, the initial model of Sneyd et al. (49) considered whether the diffusion of IP3 or Ca2+ might underlie gap junction-mediated ICW transmission in airway epithelial cells (and also between glia). This linear five-cell model incorporated the then rather novel involvement of two intracellular Ca2+ release compartments (IP3R and RyR (50)) and calculated diffusion of IP3 through this chain of cells as a function of time, assuming that Ca2+ release would be triggered by a threshold concentration of IP3. Although parameters such as junctional permeability and sizes of Ca2+ releasable pools were fixed in this deterministic model, the modeling concluded that IP3 rather than Ca2+ itself was the relevant gap junction permeant second messenger communicating the ICWs and also suggested that long-distance spread might require IP3 regeneration by distal cells in the chain. The same group subsequently extended this model to a 7 × 7 two-dimensional grid of cells with oscillating intracellular Ca2+ levels, showing that intercellular IP3 (but not Ca2+) diffusion was sufficient to entrain the oscillations in cells connected by gap junctions (51). More recently, Hofer et al. (35,39) modeled the dynamics of intracellular Ca2+ and of IP3 diffusion in a 9 × 9 array considering four discrete variables (cytosolic and ER store Ca2+ concentrations, IP3 concentration, and the fraction of active IP3R). These variables were used to obtain numerical solutions for the intracellular Ca2+ levels resulting from IP3 diffusion through randomly varied gap junctional communication between cells. To provide the amplification of IP3 necessary for long-range Ca2+ signal transmission, Hofer et al. (35) included a partial regenerative response in which PLC activity could be increased as a discrete variable that was added to the diffusional IP3 flux.
In our 625-cell model, the combination of the extracellular ICW component with that mediated by gap junctions explains in principle the long-range spread of the Ca2+ signal, without having to include the partial regeneration of IP3. The only previous mathematical model explicitly combining gap junctions and membrane surface receptors for the transmission of ICWs was the deterministic model based on responses in hepatocytes (52) that was extended to a stochastic model by Gracheva and Gunton (53). In this system, Dupont et al. (52) determined that ICW spread required an agonist (vasopressin or norepinephrine), but that gap junctions were required for the synchronization of the responses. Through summation of intracellular IP3 generated by agonists and by gap junction-mediated diffusion, these authors were able to closely mimic the entrainment of intracellular Ca2+ oscillations seen in adjacent cells.
One notable feature of this model is the stochastic character that we and others (e.g., (44)) believe to account for the experimentally observed variability of ICWs. Thus, in addition to randomly distributing the cells in a 25 × 25 rectangular grid with randomly selected internodal distances that can be deformed to account for different glial topologies, the model selects randomly, from experimentally determined variability intervals, relevant properties of the immersing solution (concentrations of two exo-nucleotidases), of individual cells (numbers of two types of energy transducers independently responsible for ATP or UTP release, two types of P2X, three types of P2Y and one type of IP3 receptors, and concentration of two ecto-nucleotidases), and of interconnections with each neighbor cell (number of gap junction channels). The reason for using randomly assigned values within variability intervals instead of deterministic values for these parameters is to account for their variable expression levels. The nature as well as the value-intervals of each of the contributors to Ca2+ signals can be altered separately so that comparison of the statistical features of model simulations with data from parallel experiments may be used in testing phenomenological hypotheses and determining excitation and ICW spread parameters.
Our model allows making simulations and predictions regarding changes in the expression levels and in the features of transducers and/or certain receptors and/or gap junction coupling that occur under pathological conditions. For instance, simulations of Ca2+ signals under inflammatory conditions in which gap junctions and P2R have been described to be altered (28,54,55) may provide insights to determine how much to manipulate the accessible parameters to restore the physiological conditions or limit the damages induced by the pathology. The model has also a high potential to be generalized to better approximate ICWs in brain regions. Thus, it can be easily expanded to predefined, nonrectangular grids whose nodes are occupied by different types of cells according to a conditional probability scheme to account for the nonrandom topology of the central nervous system structures, or to include other receptors and agonists (either directly released by the stimulated cells or as downstream products of enzymatic degradation), or to introduce dependence relationships among the expression levels of various types of transducers/receptors/gap junction proteins, or additional types of cells (such as neurons) that may communicate through extracellular and/or gap junctional pathways with the astrocytes.
SUPPLEMENTARY MATERIAL
An online supplement to this article can be found by visiting BJ Online at http://www.biophysj.org.
Supplementary Material
Acknowledgments
This work was supported by National Institutes of Health grants Nos. NS-41023, NS-41282, and DK060037.
References
- 1.Scemes, E. 2000. Components of astrocytic intercellular calcium signaling. Mol. Neurobiol. 22:167–179. [DOI] [PubMed] [Google Scholar]
- 2.Dermietzel, R., Y. Gao, E. Scemes, D. Vieira, M. Urban, M. Kremer, M. V. Bennett, and D. C. Spray. 2000. Connexin43 null mice reveal that astrocytes express multiple connexins. Brain Res. Brain Res. Rev. 32:45–56. [DOI] [PubMed] [Google Scholar]
- 3.Scemes, E., S. O. Suadicani, and D. C. Spray. 2000. Intercellular communication in spinal cord astrocytes: fine-tuning between gap junctions and P2 nucleotide receptors in calcium wave propagation. J. Neurosci. 20:1435–1445. [DOI] [PMC free article] [PubMed] [Google Scholar]
- 4.Boitano, S., E. R. Dirksen, and M. J. Sanderson. 1992. Intercellular propagation of calcium waves mediated by inositol trisphosphate. Science. 258:292–295. [DOI] [PubMed] [Google Scholar]
- 5.Leybaert, L., K. Paemeleire, A. Strahonja, and M. J. Sanderson. 1998. Inositol-trisphosphate-dependent intercellular calcium signaling in and between astrocytes and endothelial cells. Glia. 24:398–407. [PubMed] [Google Scholar]
- 6.Venance, L., N. Stella, J. Glowinski, and C. Giaume. 1997. Mechanism involved in initiation and propagation of receptor-induced intercellular calcium signaling in cultured rat astrocytes. J. Neurosci. 17:1981–1992. [DOI] [PMC free article] [PubMed] [Google Scholar]
- 7.Berridge, M. J., P. Lipp, and M. D. Bootman. 2000. The versatility and universality of calcium signalling. Nat. Rev. Mol. Cell Biol. 1:11–21. [DOI] [PubMed] [Google Scholar]
- 8.Charles, A. C., C. C. Naus, D. Zhu, G. M. Kidder, E. R. Dirksen, and M. J. Sanderson. 1992. Intercellular calcium signaling via gap junctions in glioma cells. J. Cell Biol. 118:195–201. [DOI] [PMC free article] [PubMed] [Google Scholar]
- 9.Finkbeiner, S. 1992. Calcium waves in astrocytes—filling in the gaps. Neuron. 8:1101–1108. [DOI] [PubMed] [Google Scholar]
- 10.Nedergaard, M. 1994. Direct signaling from astrocytes to neurons in cultures of mammalian brain cells. Science. 263:1768–1771. [DOI] [PubMed] [Google Scholar]
- 11.Venance, L., D. Piomelli, J. Glowinski, and C. Giaume. 1995. Inhibition by anandamide of gap junctions and intercellular calcium signalling in striatal astrocytes. Nature. 376:590–594. [DOI] [PubMed] [Google Scholar]
- 12.Enkvist, M. O., and K. D. McCarthy. 1992. Activation of protein kinase C blocks astroglial gap junction communication and inhibits the spread of calcium waves. J. Neurochem. 59:519–526. [DOI] [PubMed] [Google Scholar]
- 13.Hassinger, T. D., P. B. Guthrie, P. B. Atkinson, M. V. Bennett, and S. B. Kater. 1996. An extracellular signaling component in propagation of astrocytic calcium waves. Proc. Natl. Acad. Sci. USA. 93:13268–13273. [DOI] [PMC free article] [PubMed] [Google Scholar]
- 14.Guan, X., B. F. Cravatt, G. R. Ehring, J. E. Hall, D. L. Boger, R. A. Lerner, and N. B. Gilula. 1997. The sleep-inducing lipid oleamide deconvolutes gap junction communication and calcium wave transmission in glial cells. J. Cell Biol. 139:1785–1792. [DOI] [PMC free article] [PubMed] [Google Scholar]
- 15.Naus, C. C., J. F. Bechberger, Y. Zhang, L. Venance, H. Yamasaki, S. C. Juneja, G. M. Kidder, and C. Giaume. 1997. Altered gap junctional communication, intercellular signaling, and growth in cultured astrocytes deficient in connexin43. J. Neurosci. Res. 49:528–540. [DOI] [PubMed] [Google Scholar]
- 16.Scemes, E., R. Dermietzel, and D. C. Spray. 1998. Calcium waves between astrocytes from Cx43 knockout mice. Glia. 24:65–73. [DOI] [PMC free article] [PubMed] [Google Scholar]
- 17.Guthrie, P. B., J. Knappenberger, M. Segal, M. V. Bennett, A. C. Charles, and S. B. Kater. 1999. ATP released from astrocytes mediates glial calcium waves. J. Neurosci. 19:520–528. [DOI] [PMC free article] [PubMed] [Google Scholar]
- 18.Wang, Z., P. G. Haydon, and E. S. Yeung. 2000. Direct observation of calcium-independent intercellular ATP signaling in astrocytes. Anal. Chem. 72:2001–2007. [DOI] [PubMed] [Google Scholar]
- 19.Harden, T. K., and E. R. Lazarowski. 1999. Release of ATP and UTP from astrocytoma cells. Prog. Brain Res. 120:135–143. [DOI] [PubMed] [Google Scholar]
- 20.Lazarowski, E. R., L. Homolya, R. C. Boucher, and T. K. Harden. 1997. Direct demonstration of mechanically induced release of cellular UTP and its implication for uridine nucleotide receptor activation. J. Biol. Chem. 272:24348–24354. [DOI] [PubMed] [Google Scholar]
- 21.Lazarowski, E. R., D. A. Shea, R. C. Boucher, and T. K. Harden. 2003. Release of cellular UDP-glucose as a potential extracellular signaling molecule. Mol. Pharmacol. 63:1190–1197. [DOI] [PubMed] [Google Scholar]
- 22.Khakh, B. S., G. Burnstock, C. Kennedy, B. F. King, R. A. North, P. Seguela, M. Voigt, and P. P. Humphrey. 2001. International Union of Pharmacology. XXIV. Current status of the nomenclature and properties of P2X receptors and their subunits. Pharmacol. Rev. 53:107–118. [PubMed] [Google Scholar]
- 23.Ralevic, V., and G. Burnstock. 1998. Receptors for purines and pyrimidines. Pharmacol. Rev. 50:413–492. [PubMed] [Google Scholar]
- 24.Blomstrand, F., N. D. Aberg, P. S. Eriksson, E. Hansson, and L. Ronnback. 1999. Extent of intercellular calcium wave propagation is related to gap junction permeability and level of connexin 43 expression in astrocytes in primary cultures from four brain regions. Neuroscience. 92:255–265. [DOI] [PubMed] [Google Scholar]
- 25.Giaume, C., C. Fromaget, A. el Aoumari, J. Cordier, J. Glowinski, and D. Gros. 1991. Gap junctions in cultured astrocytes: single-channel currents and characterization of channel-forming protein. Neuron. 6:133–143. [DOI] [PubMed] [Google Scholar]
- 26.Giaume, C., and K. D. McCarthy. 1996. Control of gap junctional communication in astrocytic networks. Trends Neurosci. 19:319–325. [DOI] [PubMed] [Google Scholar]
- 27.James, G., and A. M. Butt. 2002. P2Y and P2X purinoceptor mediated Ca2+ signalling in glial cell pathology in the central nervous system. Eur. J. Pharmacol. 447:247–260. [DOI] [PubMed] [Google Scholar]
- 28.John, G. R., E. Scemes, S. O. Suadicani, J. S. Liu, P. C. Charles, S. C. Lee, D. C. Spray, and C. F. Brosnan. 1999. IL-1β differentially regulates calcium wave propagation between primary human fetal astrocytes via pathways involving P2 receptors and gap junction channels. Proc. Natl. Acad. Sci. USA. 96:11613–11618. [DOI] [PMC free article] [PubMed] [Google Scholar]
- 29.Kukley, M., J. A. Barden, C. Steinhauser, and R. Jabs. 2001. Distribution of P2X receptors on astrocytes in juvenile rat hippocampus. Glia. 36:11–21. [DOI] [PubMed] [Google Scholar]
- 30.Zhu, Y., and H. K. Kimelberg. 2001. Developmental expression of metabotropic P2Y1 and P2Y2 receptors in freshly isolated astrocytes from rat hippocampus. J. Neurochem. 77:530–541. [DOI] [PubMed] [Google Scholar]
- 31.Suadicani, S. O., C. E. Flores, M. Urban-Maldonado, M. Beelitz, and E. Scemes. 2004. Gap junction channels coordinate the propagation of intercellular Ca2+ signals generated by P2Y receptor activation. Glia. 48:217–229. [DOI] [PMC free article] [PubMed] [Google Scholar]
- 32.Lazarowski, E. R., and T. K. Harden. 1999. Quantitation of extracellular UTP using a sensitive enzymatic assay. Br. J. Pharmacol. 127:1272–1278. [DOI] [PMC free article] [PubMed] [Google Scholar]
- 33.Parpura, V., E. Scemes, and D. C. Spray. 2004. Mechanisms of glutamate release from astrocytes: gap junction “hemichannels”, purinergic receptors and exo-cytotic release. Neurochem. Int. 45:259–264. [DOI] [PubMed] [Google Scholar]
- 34.Zimmermann, H., and N. Braun. 1999. Ecto-nucleotidases—molecular structures, catalytic properties, and functional roles in the nervous system. Prog. Brain Res. 120:371–385. [PubMed] [Google Scholar]
- 35.Hofer, T., L. Venance, and C. Giaume. 2002. Control and plasticity of intercellular calcium waves in astrocytes: a modeling approach. J. Neurosci. 22:4850–4859. [DOI] [PMC free article] [PubMed] [Google Scholar]
- 36.Lazarowski, E. R., L. Homolya, R. C. Boucher, and T. K. Harden. 1997. Identification of an ecto-nucleoside diphosphokinase and its contribution to interconversion of P2 receptor agonists. J. Biol. Chem. 272:20402–20407. [DOI] [PubMed] [Google Scholar]
- 37.Dermietzel, R., E. L. Hertberg, J. A. Kessler, and D. C. Spray. 1991. Gap junctions between cultured astrocytes: immunocytochemical, molecular, and electrophysiological analysis. J. Neurosci. 11:1421–1432. [DOI] [PMC free article] [PubMed] [Google Scholar]
- 38.Spray, D. C., M. J. Vink, E. Scemes, S. O. Suadicani, G. I. Fishman, and R. Dermietzel. 1998. Characteristics of coupling in cardiac myocytes and astrocytes from Cx43(−/−) mice. In Gap Junctions. R. Werner, editor. IOS Press, Amsterdam, The Netherlands. 281–285.
- 39.Hofer, T., A. Politi, and R. Heinrich. 2001. Intercellular Ca2+ wave propagation through gap junctional Ca2+ diffusion: a theoretical study. Biophys. J. 80:75–87. [DOI] [PMC free article] [PubMed] [Google Scholar]
- 40.Iacobas, D. A. 2000. Ideas and Methods in the Physics of Living. Tilia Press International, Constanta, Romania.
- 41.Hobbie, R. K. 1997. Intermediate Physics for Medicine and Biology. John Wiley & Sons, New York.
- 42.North, R. A. 2002. Molecular physiology of P2X receptors. Physiol. Rev. 82:1013–1067. [DOI] [PubMed] [Google Scholar]
- 43.Missiaen, L., H. De Smedt, J. B. Parys, I. Sienaert, S. Valingen, and R. Casteels. 1996. Threshold for inositol 1,4,5-trisphosphate action. J. Biol. Chem. 271:12287–12293. [DOI] [PubMed] [Google Scholar]
- 44.Coombes, S., R. Hinch, and Y. Timofeeva. 2004. Receptors, sparks and waves in a fire-diffuse-fire framework for calcium release. Prog. Biophys. Mol. Biol. 85:197–216. [DOI] [PubMed] [Google Scholar]
- 45.Charles, A. C., J. E. Merrill, E. R. Dirksen, and M. J. Sanderson. 1991. Intercellular signaling in glial cells: calcium waves and oscillations in response to mechanical stimulation and glutamate. Neuron. 6:983–992. [DOI] [PubMed] [Google Scholar]
- 46.Cornell-Bell, A. H., S. M. Finkbeiner, M. S. Cooper, and S. J. Smith. 1990. Glutamate induces calcium waves in cultured astrocytes: long-range glial signaling. Science. 247:470–473. [DOI] [PubMed] [Google Scholar]
- 47.Saez, J. C., J. A. Connor, D. C. Spray, and M. V. Bennett. 1989. Hepatocyte gap junctions are permeable to the second messenger, inositol 1,4,5-trisphosphate, and to calcium ions. Proc. Natl. Acad. Sci. USA. 86:2708–2712. [DOI] [PMC free article] [PubMed] [Google Scholar]
- 48.Osipchuk, Y., and M. Cahalan. 1992. Cell-to-cell spread of calcium signals mediated by ATP receptors in mast cells. Nature. 359:241–244. [DOI] [PubMed] [Google Scholar]
- 49.Sneyd, J., A. C. Charles, and M. J. Sanderson. 1994. A model for the propagation of intercellular calcium waves. Am. J. Physiol. 266:C293–C302. [DOI] [PubMed] [Google Scholar]
- 50.Berridge, M. J. 1990. Calcium oscillations. J. Biol. Chem. 265:9583–9586. [PubMed] [Google Scholar]
- 51.Sneyd, J., M. Wilkins, A. Strahonja, and M. J. Sanderson. 1998. Calcium waves and oscillations driven by an intercellular gradient of inositol (1,4,5)-trisphosphate. Biophys. Chem. 72:101–109. [DOI] [PubMed] [Google Scholar]
- 52.Dupont, G., T. Tordjmann, C. Clair, S. Swillens, M. Claret, and L. Combettes. 2000. Mechanism of receptor-oriented intercellular calcium wave propagation in hepatocytes. FASEB J. 14:279–289. [DOI] [PubMed] [Google Scholar]
- 53.Gracheva, M. E., and J. D. Gunton. 2003. Intercellular communication via intracellular calcium oscillations. J. Theor. Biol. 221:513–518. [DOI] [PubMed] [Google Scholar]
- 54.Brand-Schieber, E., P. Werner, D. A. Iacobas, S. Iacobas, M. Beelitz, S. L. Lowery, D. C. Spray, and E. Scemes. 2005. Connexin43, the major gap junction protein of astrocytes, is down-regulated in inflamed white matter in an animal model of multiple sclerosis. J. Neurosci. Res. 80:798–808. [DOI] [PMC free article] [PubMed] [Google Scholar]
- 55.Narcisse, L., E. Scemes, Y. Zhao, S. C. Lee, and C. F. Brosnan. 2005. The cytokine IL-1β transiently enhances P2X7 receptor expression and function in human astrocytes. Glia. 49:245–258. [DOI] [PMC free article] [PubMed] [Google Scholar]
- 56.Rostovtseva, T. K., and S. M. Bezrukov. 1998. ATP transport through a single mitochondrial channel, VDAC, studied by current fluctuation analysis. Biophys. J. 74:2365–2373. [DOI] [PMC free article] [PubMed] [Google Scholar]
- 57.Kukulski, F., and M. Komoszynski. 2003. Purification and characterization of NTPDase1 (ecto-apyrase) and NTPDase2 (ecto-ATPase) from porcine brain cortex synaptosomes. Eur. J. Biochem. 270:3447–3454. [DOI] [PubMed] [Google Scholar]
Associated Data
This section collects any data citations, data availability statements, or supplementary materials included in this article.