

Abstract
In single-molecule mechanics experiments the molecular elasticity is usually measured from the deformation in response to a controlled applied force, e.g., via an atomic force microscope cantilever. We have tested the validity of an alternative method based on a recently developed theory. The concept is to measure the change in thermal fluctuations of the cantilever tip with and without its coupling to a rigid surface via the molecule. The new method was demonstrated by its application to the elasticity measurements of L- and P-selectin complexed with P-selectin glycoprotein ligand-1 or their respective antibodies, which showed values comparable to those measured from the slope of the force-extension curve. L- and P-selectin were found to behave as nearly linear springs capable of sustaining large forces and strains without sudden unfolding. The measured spring constants of ∼4 and ∼1 pN/nm for L- and P-selectin, respectively, suggest that a physiological force of ∼100 pN would result in an ∼200% strain for the respective selectins.
INTRODUCTION
Biomechanical measurements at the level of single molecules provide insights into their inner workings that complement information obtained from conventional biochemical and biophysical measurements on ensembles of large numbers of molecules (1). In the past decade, there have been many measurements of mechanical properties of single DNA, RNA, and protein molecules (2–7). In these experiments, ultrasensitive force techniques, e.g., atomic force microscopy (AFM) (8) and optical tweezers (9,10), were used to stretch the molecules to measure their force-extension curves. Typically, the applied forces and molecular extensions are in the ranges of tens to hundreds of piconewtons and a few to tens of nanometers, respectively, due to the extremely small size and softness of biomolecules. Consequently, these experiments may be susceptible to thermal excitations, which manifest as force and displacement fluctuations that reduce measurement accuracy. On the other hand, the responses to thermal excitations of small and soft mechanical systems are related to their elastic properties. This principle has been used to measure the flexural rigidities of actin filaments and microtubules (11) as well as the bending rigidities of red blood cell membranes (12). To enable implementation of this idea for measuring the extensional elasticity of linear molecules, we have characterized the thermomechanical responses of an arbitrarily shaped AFM cantilever with the tip coupled to an elastic spring (13). Our method also improved the accuracy of the thermal fluctuation method for calibrating the AFM cantilever spring constant. Here we provide experimental validation of the theoretical results and apply the new method to molecular elasticity measurements of L-selectin and P-selectin. The validity and accuracy of the thermal fluctuation approach (thermal method) are demonstrated by favorable comparisons of the results so obtained with those obtained from the conventional force-extension curve approach (stretch method).
Selectins are a family of adhesion molecules (14–16). Their common structure is an N-terminal C-type lectin (Lec) domain, followed by an epidermal growth factor (EGF)-like module, multiple copies of consensus repeat (CR) units (two and nine for L- and P-selectins, respectively) characteristic of complement-binding proteins, a transmembrane segment, and a short cytoplasmic domain. L-selectin, expressed on leukocytes, binds to constitutively or inducibly expressed ligands on endothelial cells and to ligands on other leukocytes. E-selectin, expressed on cytokine-activated endothelial cells, binds to ligands on leukocytes. P-selectin is stored in secretory granules of platelets and endothelial cells. Upon stimulation with secretagogues such as thrombin or histamine, P-selectin is rapidly redistributed to the cell surface, where it binds to ligands on leukocytes. P-selectin glycoprotein ligand-1 (PSGL-1) is a sialomucin on leukocytes that binds to all three selectins. In particular, its binding to L- and P-selectin can be blocked by the same monoclonal antibody (mAb) to the N-terminal region of PSGL-1. Interactions of selectins with cell-surface glycoconjugates such as PSGL-1 mediate tethering and rolling of leukocytes on activated endothelial cells or activated platelets or other leukocytes that have previously adhered to vascular surfaces. This process initiates the multistep adhesion and signaling cascade of leukocyte recruitment to sites of inflammation and injury. The hydrodynamic forces acting on the leukocytes have to be balanced by adhesive forces on the selectin-ligand bonds, which stretch these molecules. Therefore, the molecular elasticities of the selectins may be pertinent to their functions in this mechanically stressful environment.
MATERIALS AND METHODS
Proteins and antibodies
P-selectin and L-selectin were purified from human platelets (17) and human tonsils (18), respectively, as previously described. Native dimeric PSGL-1 was purified from human neutrophils (17). Recombinant monomeric soluble PSGL-1 (sPSGL-1) was purified from Chinese hamster ovary cell transfectants (19). The blocking anti-P-selectin mAb G1 (20), the blocking anti-L-selectin mAb DREG56 (21), and the nonblocking anti-PSGL-1 mAb PL2 (22) have been described.
Forming selectin-reconstituted bilayers
Selectin-incorporated lipid vesicle solutions were prepared following the method of McConnell et al. (23). Briefly, egg phosphatidylcholine (Avanti Polar Lipids, Alabaster, AL) was dissolved in chloroform and dried on a Teflon surface with argon. Vesicles were formed by rehydrating the dried lipid film with 250 μl of 2% octyl β-glucopyranoside (OG) (Fisher Scientific, Pittsburgh, PA) Tris saline solution, creating a 0.8-mM lipid solution. The 2% OG egg phosphatidylcholine solution was combined with 250 μl of 1% OG solution, containing 7 μg of P- or L-selectin. The resulting 0.4-mM lipid solution was dialyzed with three 1-liter changes of Tris saline buffer (25 mM Tris-HCL, 150 mM NaCl, pH 7.4) in 12-h increments. The resulting lipid vesicle solution was stored under argon at 4°C and used within several months.
P-selectin or L-selectin was reconstituted into glass-supported polyethylenimine (PEI)-cushioned lipid bilayers using the method of vesicle fusion as previously described (24–26) (cf. Fig. 1). Briefly, a dry coverslip precleaned with Piranha solution (70% 12 N sulfuric acid and 30% hydrogen peroxide) at 100°C for 45 min was immersed in a 100-ppm PEI (molecular weight = 1800 g/mol, 95% purity; Polysciences, Warrington, PA) solution of 0.5 mM KNO3 (Fisher Scientific) in deionized water (pH 7.0) for 20 min, rinsed, dried by argon, and placed in a desiccator for 10 min. A 3- to 5-μl drop of P- or L-selectin-incorporated lipid vesicle solution was placed on the PEI-coated coverslip, placed in a Petri dish, and covered with a damp paper towel. After 20 min incubation, the Petri dish was filled with 10 ml Hank's balanced salt solution with 1% Ig-free bovine serum albumin. The P-selectin and L-selectin bilayers so formed had molecular densities of a few hundred sites/μm2 that resulted in infrequent binding (15–20%) to the (s)PSGL-1-, G1-, or DREG56-coated cantilever tips, as required for measuring single-bond interactions (26). The bilayers were immediately used in AFM experiments.
FIGURE 1.

Functionalization of the AFM system. The schematic represents a composite of all molecules adsorbed or captured on different AFM tips or reconstituted in different bilayers. PL2, DREG56, or G1 was adsorbed. sPSGL-1 or PSGL-1, respectively depicted as monomer or dimer, was captured by PL2. L-selectin or P-selectin, respectively depicted as monomer or dimer, was reconstituted in PEI-cushioned lipid bilayer on different coverslips.
AFM system and cantilever functionalization
Our in-house-built AFM system and its functionalization with ligands and mAbs have been described previously (24–26). Briefly, a piezoelectric translator (PZT) (Poly Physik Instrument, Boston, MA) was used to actuate the cantilever (unsharpened gold-coated half-wafer cantilevers, Veeco Instruments, Woodbury, NY). The cantilever tip inclination was measured by bouncing a laser beam (Oz optics, Ontario, Canada) off the back of the cantilever onto a photodiode (Hamamatsu, Bridgewater, NJ). A personal computer with data acquisition boards (analog output board and multifunction I/O board, National Instruments, Austin, TX) was used to control the movement of the PZT and to collect the signal from the photodiode. LabView (National Instruments) was used as the interface between the user and the data acquisition boards.
Cantilevers were incubated overnight at 4°C with a mAb (10 μg/ml) and followed by 30–60 min incubation at room temperature with 1% bovine serum albumin in Hank's balanced salt solution. The cantilevers were used immediately in the AFM experiments. During each experiment, cantilevers precoated with capture mAb PL2 were functionalized by incubation with (s)PSGL-1 (PSGL-1 or sPSGL-1, 100 ng/ml, 20 min at room temperature); cantilevers coated with anti-P-selectin mAb G1 or anti-L-selectin mAb DREG56 were used directly without further modifications. The molecular systems used in this study are depicted in Fig. 1.
Calibrating cantilever spring constant
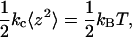
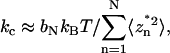
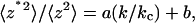
Accurate in situ calibration of each cantilever spring constant kc is crucial for measuring molecular spring constants. A previous method of thermal fluctuation analysis (27) was modified, based on the theory described in Wu et al. (13). Applying the equipartition theory from statistical mechanics to the AFM cantilever, it has been shown that
 |
(1) |
where kB is the Boltzmann constant, T is the absolute temperature, z is the cantilever tip deflection, and the brackets denote ensemble averaging. Thus, kc can be determined from the mean square of fluctuating deflections of the cantilever tip under thermal excitations.
Two corrections were made to further improve the accuracy of the cantilever spring constant estimation. The first has to do with the fact that the photodiode monitors laser light reflected from the back of the cantilever tip, which measures the cantilever tip inclination,  rather than the cantilever tip deflection, z(L), where L is the distance from the built-in end (x = 0) to the tip (x = L) along the long axis (x) of the cantilever. Under static loading, the two are related by
 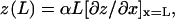 where the proportionality constant α (2/3 for rectangular cantilever) depends only on the cantilever geometry (13). For each cantilever, this relationship was determined in situ by the sensitivity measurement in which the PZT bent the cantilever against a coverslip to produce a range of known static tip deflections and the corresponding photodiode voltage readings were recorded. When the cantilever fluctuates under thermal excitations with waveforms that contain many vibration modes, the real inclination at the tip is expressed in terms of the virtual tip deflection,
 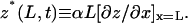 It has been shown that for a free cantilever
 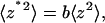 where the proportionality constant b (4/3 for rectangular cantilever) depends only on the cantilever geometry (13). Thus, correction to this error has been made by using
 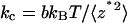 in lieu of
 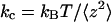 (Eq. 1). The calculated α and b values for the V-shaped commercial Veeco cantilevers are presented in Supplementary Material.
The time courses of free cantilever fluctuations were measured at a high data acquisition rate of 80 kHz. The high bandwidth data allow the mean of the fluctuating z*2 time course to be determined from frequency domain analysis, namely, by calculating the area (divided by 2π) under the power spectral density S*(ω) versus the circular-frequency ω curve:
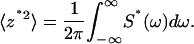 |
(2) |
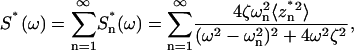
Applying Fourier transform to the square virtual deflection time course, it can be shown that (13)
 |
(3) |
where ζ is the damping coefficient, ωn is the nth resonant circular frequency,  is the power spectral density of the nth eigen mode (i.e., in the absence of all other modes), and
  is the area (divided by 2π) under the
  versus ω curve. The previous thermal fluctuation method approximates the square root of the power spectral density using
 |
(4) |
where A (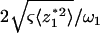 ) and Q (
 ) are respectively referred to as the amplitude and quality factor (27). The inclusion of higher eigen modes (n > 1) in Eq. 3 thus extends the previous method that uses only the fundamental mode (n = 1) (27).
The second correction has to do with the finite bandwidth of the photodiode signals, which limits the number of observable resonant frequencies in the measured spectral density plot to no more than three, thereby truncating the infinite series on the right-hand side of Eq. 3 to a sum of just a few terms. Correction to this error has been made by using the following approximation:
 |
(5) |
where the denominator on the right-hand side represents the N term truncation of the series of the power spectral density of the squared virtual deflection and bN is a constant that depends only on the cantilever geometry. The calculated values for bN for the commercial Veeco cantilevers are presented in Supplementary Material.
The need for the above two forms of corrections can be seen in the following example. For an experiment using cantilever D (nominal spring constant of 30 pN/nm as provided by the manufacturer), the cantilever spring constants estimated using Eq. 5 with one and two terms were 16.8 and 15.2 pN/nm, respectively. Had we used only a single term (similar to Eq. 4) and not corrected for virtual deflection (using Eq. 1 directly), the value would have been 24.0 pN/nm, which overestimated the cantilever spring constant by ∼50%. It should be noted that the hydrodynamic interactions of the cantilever with the wall play no role in the thermal method for determining the cantilever spring constant. These interactions manifest as viscous effects and have been accounted for by the quality factor (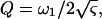 cf. Eq. 4) in the power spectrum density function. However, the standard deviation of the measured virtual deflections is determined by the area under the power spectrum density curve, not by how broadly distributed the spectrum is. In fact, the cantilever spring constants determined in air, where hydrodynamic interactions of the cantilever with the wall are much smaller (and hence, the power spectrum density distribution is much narrower with a much higher Q value), were found to be in good agreement with that determined in liquid (data not shown).
Determining molecular spring constant
The AFM experiments were similar to those designed for measuring lifetimes of single molecular bonds, as previously described (24–26). Briefly, binding was enabled by actuating the ligand- or antibody-coated cantilever tip into contact with the selectin reconstituted bilayer. The cantilever was retracted a predetermined distance (20–100 nm) at a predetermined speed (250 nm/s) and then held stationary. When the tip was linked to the bilayer by a molecular bond, the retraction phase yielded a force-extension curve that allowed determination of molecular elasticity via the stretch method (below). After the PZT stopped retracting and was held stationary, the cantilever fluctuated about a fixed position with a mean force applied to the selectin and ligand (or mAb) if they remained bound. This mean force dropped to zero when the bond ruptured; and the cantilever continued to fluctuate but with increased amplitudes (Fig. 2). Binding was kept infrequent (∼15–20%) by lowering the molecular densities. Binding resulted in clearly visible discrete rupture events from the force-time scan curves that were distinct from null events. The frequencies of null, single, double, and triple rupture events followed Poisson distribution in accordance with small number statistics (data not shown), suggesting that the elasticity values measured from single rupture events represented properties of single molecules (28,29). The virtual deflections of the fluctuating cantilever were continuously monitored by the photodiode at data acquisition rates of 600 and 5000 Hz for P-selectin and L-selectin, respectively, which are much faster than the respective off-rates of P-selectin-sPSGL-1 (0.6–10 s−1; 24) and L-selectin-PSGL-1 (10–50 s−1; 25) interactions under the forces tested. The mean and standard deviation of the virtual deflections were calculated from ∼100 consecutive data points. The mean value was used to determine the mean applied force. The standard deviation was used to determine the molecular spring constant at that force via the thermal method (below). Some of the data were acquired at a much higher rate of 80 kHz for frequency domain analysis, which allowed us to compare them with results obtained from the time domain analysis using data acquired at lower acquisition rates.
FIGURE 2.

Thermal method for measuring molecular spring constant by AFM. A representative force scan curve is shown, consisting of a constant-rate loading regime, a constant-force holding regime, and a force-free regime after the dissociation of the molecular bond. The thermal method determines the spring constant by comparing the mean-square virtual deflections in the holding regime to those in the force-free regime. In the holding regime, the coupled system behaves as if the cantilever spring and the molecular spring are in parallel. The effective spring constant of the system equals the sum of the component spring constants, kc + k. In the force-free regime, the molecular spring is absent and the effective spring constant of the system equals the cantilever spring constant, kc. In both cases, the system spring constants are related to the mean-square virtual deflections through the theory described in the text (cf. Eqs. 1 and 6).
The thermal method is based on a recently developed theory (13). A key result takes the form of Eq. 1, except that kc is now replaced by kc + k, i.e., 1/2(kc + k) 〈z2〉 = 1/2kBT, where k is the spring constant of the molecular complex. In other words, as far as the mean square tip deflection under thermal excitations is concerned, the coupled system behaves as if the cantilever spring and the molecular spring are in parallel. Thus, the added stiffness reduces the cantilever thermal fluctuations. The mean-square virtual deflections could be calculated in a fashion similar to the free cantilever case.
The validity of the thermal method and accuracy of the molecular spring constant so measured depend on whether the fluctuations recorded in the photodiode are thermally driven or contain significant contributions from environmental noise. To address this issue, we measured the photodiode signals when the laser was reflected from the wafer where the cantilever base was mounted, which should contain virtually no thermal fluctuations but include all environmental noise. Comparison of these signals with those when the laser was reflected from the cantilever tip showed that the former were much smaller than the latter, such that the variance of the former signals is only 4% of that of the latter (Fig. 3, A and B). Significantly, the power spectrum density of the latter signals near the resonant circular frequency (1240 Hz) was about five orders of magnitude greater than that of the former signals (Fig. 3, C and D). Given the large damping in the aqueous environment, it is not possible for such a small excitation from environmental noise to be amplified by this magnitude even at the resonant frequency. It can therefore be concluded that the cantilever fluctuations are predominantly the result of purely thermal excitations.
FIGURE 3.

Comparison of photodiode signals (A and B, in volts) and their power spectra (C and D, in V2/Hz) recorded when the laser was reflected from the wafer where the cantilever base was mounted (A and C) with those when the laser was reflected from the cantilever tip (B and D). The respective variances of the fluctuating voltages in panels A and B are 1.58 × 10⁻⁵ and 4.2 × 10⁻⁴.
Similar to the cantilever spring constant calibration, correction is required to relate the mean-square virtual deflections to the mean-square real deflections, which takes the form:
 |
(6) |
where a and b (1/3 and 4/3, respectively, for a rectangular cantilever) are constants that depend only on the cantilever geometry (see Supplementary Material). By comparing the thermal fluctuations of the surface-coupled cantilever with those of the free cantilever, we can determine the molecular spring constant (Fig. 2). Specifically, it follows from Eqs. 1 and 6 that
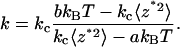 |
(7) |
The calculated a and b values for the V-shaped commercial Veeco cantilevers are presented in the Supplementary Material.
Just like the cantilever spring-constant calibration, correction is also required to account for the bandwidth limitations, which assumes a form similar to Eq. 7 (13):
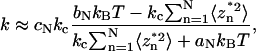 |
(8) |
where the sums on the right-hand side represent the N term truncation of the power spectral density series of the square virtual deflections. The coefficients aN, bN, and cN are constants that depend only on the cantilever geometry. Their calculated values for the commercial Veeco cantilevers are presented in the Supplementary Material. As noted before, the hydrodynamic interactions of the cantilever with the wall play no role in the thermal method in the determination of the molecular spring constant.
The stretch method measures the molecular spring constant directly from the force-extension curve when the selectin-ligand (or selectin-mAb) complex is stretched (Fig. 4). In contrast to the thermal method that extracts information from the standard deviation, the stretch method utilizes the mean of the fluctuating force-scan curve. Since the PZT retracts the built-in end of the cantilever at a constant speed low enough to neglect the cantilever inertia and viscous drag, the mean photodiode signal measures the quasistatic tip inclination that is directly proportional to the quasistatic tip deflection. As depicted in Fig. 4, force is directly measured by f = kc〈z〉 and the molecular extension zm is calculated by subtracting 〈z〉 from the PZT movement zpzt, i.e., zm = zpzt − 〈z〉. In other words, in the stretch method, the coupled system behaves as if the cantilever spring and the molecular spring are in series, which is contrary to the thermal method. For the molecules examined in the present study, the f versus zm plots were nearly linear and the molecular spring constants were found from the slopes of the lines (Fig. 4, and see Fig. 8).
FIGURE 4.

Stretch method for measuring molecular spring constants by AFM. The stretch method measures the molecular spring constant from the slope of the linear ascending phase of the force-extension curve before rupture. A dead zone of zero mean force was observed between this ascending phase and another one to the left, which had negative (compressive) forces, indicating decreased indentation of the AFM tip against the bilayer. The dead zone represents the resting length of the molecular complex as it has to be picked up and fully extended before it could resist tensile force (see text). The force on the molecular complex is calculated using f = kc〈z〉 where the quasistatic tip deflection 〈z〉 is obtained from the mean photodiode signals. Subtracting 〈z〉 from the PZT movement zpzt gives the molecular extension zm. Unlike the thermal case, here the coupled system behaves as if the cantilever spring and the molecular spring are in series because the same mean force is applied to both the cantilever and the molecular complex.
FIGURE 8.

Representative force-extension data (points) without (A and C) and with (B and D) a dead zone are compared to fits (curves) by the three polymer elastic models (Eq. 10) of P-selectin-G1 complex (A and B) and L-selectin-sPSGL-1 complex (C and D). The best-fit FJC model parameters for the data in the four panels are, respectively, L = 51.1 nm and l = 0.18 nm (A), L = 37.9 nm and l = 1.02 nm (B), L = 26.3 nm and l = 0.11 nm (C), and L = 78.0 nm and l = 0.72 nm (D). The best-fit WLC model parameters for the data in the four panels are, respectively, L = 498 nm and l = 0.01 nm (A), L = 60.1 nm and l = 0.27 nm (B), L = 64.2 nm and l = 0.02 nm (C), and L = 112 nm and l = 0.07 nm (D). The best-fit MFJC model parameters and the molecular spring constant estimates by the stretch method are presented in the text. Parts of the MFJC (dashed curve) and WLC (dotted curve) models in panel A and the WLC (dotted curve) in panel B are obscured by the FJC (solid curve).
Statistical analysis
Statistical significance, or the lack thereof, of differences between two measurements were assessed using the two-tailed Student's t-test (assuming unequal variances) and analysis of variance. The two methods give comparable p-values that are indicated in the text and figures.
RESULTS AND DISCUSSION
Spring constants determined from time-domain and frequency-domain analysis
The molecular spring constants estimated from the thermal method were mostly determined by analyzing the cantilever fluctuations directly in the time domain, i.e., calculating the standard deviation of ∼100 consecutive points from the force-scan time course acquired at a relatively low rate of 600–5000 Hz. To assess the accuracy of spring constants so measured, some data were also acquired at a much higher scan rate of 80 kHz to allow frequency-domain analysis. Fig. 5 A compares spring constants of the same molecular complexes determined by the respective time-domain and frequency-domain analyses using separate data measured independently with the same cantilever, which show satisfactory agreement. Additional comparisons between time-domain analysis of low-scan-rate data and frequency-domain analysis of high-scan-rate data were made for free fluctuations of three uncoupled Veeco cantilevers B, C, and D, which had different shapes, sizes, and spring constants (Fig. 5 B). Again, no statistically significant differences (p > 0.3) were found between values determined from analyses of the time data and frequency data for each cantilever. These results have validated the time-domain analysis that was based on standard-deviation calculations of low-scan-rate data. Note that the nominal cantilever spring constant values provided by the manufacturer are, respectively, 20, 10, and 30 pN/nm for cantilevers B (rectangular), C (V-shaped), and D (V-shaped), respectively. These differ from the experimentally determined values by as much as 60%, which emphasizes the need for in situ calibration of each cantilever used for quantitative mechanical measurements.
FIGURE 5.

Comparison of the time-domain and frequency-domain analyses. (A) Molecular spring constants and (B) cantilever spring constants were both measured from time-domain analysis of low-scan-rate data and frequency-domain analysis of high-scan-rate data. Data are presented as mean ± SD of n (indicated by numbers over the error bars) independent measurements.
Molecular spring constants measured by two methods
To test the validity and accuracy of the thermal method for measuring molecular spring constant, we compared the values so measured with those measured by the conventional stretch method (Fig. 6). The measured spring constants vary statistically significantly (p ≪ 0.001) with the selectin used, indicating the ability of our experiment to discriminate elastic properties of P-selectin (Fig. 6 A) and L-selectin (Fig. 6 B). There were no statistically significant differences in the k values when (s)PSGL-1 was replaced by the respective mAb for the P-selectin (G1, p = 0.86) and L-selectin (DREG56, p = 0.27). This suggests that (s)PSGL-1 and antibody are much less stretchable than selectins. By the same token, the lipid bilayer and the underlying PEI layer must be much less deformable under tensile forces, hence having limited (if any at all) contributions to the measured spring constants. This is also supported by the much higher spring constant of the lipid bilayer and the underlying PEI layer during compression (not shown). A reasonable explanation for the selectin dependence of the spring constant may be that the CRs act as a spring in series so that the spring constants of the two selectins are inversely proportional to their lengths. These conclusions will be demonstrated more definitively in a separate article (K. K. Sarangapani, B. T. Marshall, J. Wu, R. P. McEver, and C. Zhu, unpublished data). For the same molecular complex, the spring constants measured by two methods show no statistically significant differences (p-values ranging from 0.26 to 0.70), regardless of the particular molecules tested and their specific spring-constant values. These data support the validity and accuracy of both methods, which are based on very different principles. The thermal method is based on statistical mechanics. It analyzes the standard deviations of the force-scan curves and views the cantilever spring and the molecular spring in parallel. By comparison, the stretch method is based on deterministic mechanics. It analyzes the mean of the force-extension curves and views the two springs in series.
FIGURE 6.

Comparison of the thermal method and the stretch method. Molecular spring constants of (A) P-selectin and (B) L-selectin bound with (s)PSGL-1 or their respective mAb. Data are presented as mean ± SE of n (indicated by numbers over the error bars) independent measurements. The p-values comparing the spring constants (obtained by the stretch method) when the selectin was varied are ≪0.001 for both pairs of P-selectin-sPSGL-1 versus L-selectin-PSGL-1 and P-selectin-G1 versus L-selectin-DREG56. The respective p-values comparing the spring constants (obtained by the thermal method) when the (s)PSGL-1 was changed to mAb are 0.86 and 0.27 for the pairs of P-selectin-sPSGL-1 versus P-selectin-G1 and L-selectin-PSGL-1 versus L-selectin-DREG56, respectively.
Molecular spring constants measured by cantilevers of different shapes and sizes
To further test the reliability of the estimated molecular spring constants, we compared the values measured using Veeco cantilevers of different shapes, sizes, and spring constants. Fig. 7 A shows values of the L-selectin-DREG56 spring obtained by the thermal method using rectangular cantilever B and V-shaped cantilever C. Fig. 7 B shows values of the same molecular spring obtained by the stretch method using cantilevers B, C, and D. Fig. 7 C shows values of the L-selectin-PSGL-1 spring by the stretch method using three different D cantilevers, which had different spring constants. For the data in Fig. 7, A and C, there were no statistically significant differences (p-values ranging from 0.38 to 0.95) in the spring-constant values for the same molecules regardless of the cantilever used in the measurement. Although very small p-values were obtained for the small differences (ranging from 9 to 25%) between the spring constant of the L-selectin-DREG56 complex measured by the rectangular cantilever B and those measured by V-shaped cantilevers C and D, they likely result from the unusually small standard deviations (0.5–1.1 pN/nm for data in Fig. 7 B compared to 1.0–1.8 pN/nm for data in Fig. 7 C). This conclusion is confirmed by the much larger p-values (0.1, 0.25, and 0.02 for C versus B, C versus D, and B versus D, respectively) obtained when standard deviations of 1.8 pN/nm are used along with the means from Fig. 7 B in the Student's t-test. Thus, the measured molecular spring constants do not depend on the shape, size, and spring constant of the cantilevers used, as expected. It follows from Eq. 7 that the relative change in the mean-square virtual deflections of a cantilever due to a molecular bond that elastically links its tip to the coverslip can be expressed as:
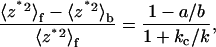 |
(9) |
where the subscripts f and b on the left-hand side indicate the free and bound cantilevers. The left-hand side can be viewed as a measure of the signal/noise ratio, which decreases as kc/k increases according to the right-hand side. Since we are clearly able to discriminate the spring constant of P-selectin from that of L-selectin, the lack of effect on the measured molecular spring constant of the cantilever used for measurement suggests that the kc/k ratios are not too high to affect the accuracy of the molecular spring-constant values.
FIGURE 7.

The lack of dependence of the measured molecular spring constant on the shape, size, and spring constant of the cantilever used for measurement is demonstrated. (A) Molecular spring constants of L-selectin bound to mAb (DREG56) measured by the thermal method using either the V-shaped or rectangular cantilever. (B) Molecular spring constants of L-selectin bound to DREG56 measured by the stretch method using the indicated Veeco cantilevers of different shapes and sizes. (C) Molecular spring constants of L-selectin bound to PSGL-1 measured by the stretch method using the D cantilevers of different spring constants (measured in situ). Data are presented as mean ± SE of n (indicated by numbers over the error bars) independent measurements. p-values for comparisons of data in B are discussed in the text.
Irrelevance of polymer elasticity models
The use of a spring constant to describe the mechanical property of a selectin assumes that the molecule behaves as a linearly elastic material. To test the validity of this assumption, we examined a large number of force-extension curves. In the four representative force-extension curves exemplified in Fig. 8, a continuous transition from compressive to tensile forces as zpzt − 〈z〉 increased was seen in two (Fig. 8, A and C), whereas a “dead zone” of zero mean force between the compressive and tensile force regimes was seen in the other two (Fig. 8, B and D, cf. Fig. 4). The presence of a dead zone gives the appearance of a nonlinear force-extension relationship. This might have prompted the use of the modified free joint chain (MFJC) model in a previous study, which depicted P-selectin and PSGL-1 as chain-like polymers that required little initial force to straighten their randomly coiled shapes (30). Other studies have used the free joint chain (FJC) model (31) and the worm-like chain (WLC) model (32) to describe the elastic behaviors of DNA and proteins (7,33,34). These polymer elasticity models are given by the following equations:
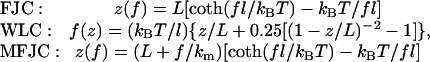 |
(10a-10c) |
where L is the contour length, l is the persistence length, and km is an equivalent molecular spring constant. To test the applicability of these nonlinear elastic models to our data, Eq. 10 was fit to the measured force-extension curves (Fig. 8). All three models were able to fit curves with no or small dead zones, as these models all have linear regimes that can match the data by adjusting the model parameters (Fig. 8, A and C). For curves with larger and larger dead zones, the WLC model, and especially the FJC model, became less and less able to fit the force-extension curves, as they could not follow the piecewise linear trend of the data no matter how the parameters were adjusted (Fig. 8, B and D).
Although the MFJC model remained capable of fitting the data and the parameters reported by Fritz et al. (30) were able to predict some P-selectin-sPSGL-1 force-extension curves we measured, the best-fit parameters varied widely with the dead-zone length. For the P-selectin-G1 complex, the best-fit values are L = 27.7 nm, l = 0.90 nm, and km = 4.55 pN/nm for the curve without dead zone in Fig. 8 A, but L = 36.2 nm, l = 0.66 nm, and km = 6.26 pN/nm for the curve with an ∼15-nm dead zone in Fig. 8 B. For the L-selectin-PSGL-1 complex, the parameter values are L = 2.74 nm, l = 0.77 nm, and km = 4.16 pN/nm for the curve without dead zone in Fig. 8 C, but L = 47.6 nm, l = 4.79 nm, and km = 5.29 pN/nm for the curve with an ∼40-nm dead zone in Fig. 8 D. Moreover, no correlations were found between the km values and the slopes of the linear segments of the tensile force-molecular extension curves, between the L values and the total resting lengths of the four molecular complexes (cf. Fig. 10 below), or between the l values and any characteristic lengths from the structures of these molecules. Furthermore, although it strongly affects the best-fit parameters, the dead-zone length did not correlate with the slope of the tensile force versus molecular extension curve. By contrast, similar slopes (which were taken as molecular spring constants by the stretch method) were seen for the same selectin regardless of the dead-zone length and were distinct for the two different selectins. For example, the P-selectin-G1 values estimated from the data in Fig. 8, A and B, are k = 1.39 and 1.22 pN/nm, respectively; and the L-selectin-PSGL-1 values estimated from the data in Fig. 8, C and D, are k = 4.53 and 4.71 pN/nm, respectively.
FIGURE 10.

(A) Histograms of dead-zone lengths of the indicated molecular complexes. The two P-selectin histograms include ∼120 measurements each. The two L-selectin histograms include ∼60 measurements each. The mean (B) and the most probable (C) dead-zone length are plotted against the total resting length of the molecular complex and fitted by straight lines. The dead-zone lengths is often shorter than the total complex length because the selectin in the bilayer may not lie exactly under the apex of the AFM tip and the (s)PSGL-1 (or mAb) may not be coated exactly on the apex of the tip (see schematic in Fig. 1).
Since the thermal method allows the measurement of the “local” spring constant in the vicinity of a fixed mean force even if the molecule is highly nonlinearly elastic, we used this method to obtain collections of spring constants for the four selectin-(s)PSGL-1 (and -mAb) complexes in the corresponding ranges of forces. As exemplified for the P-selectin-G1 complex (Fig. 9 A) and L-selectin-PSGL-1 complex (Fig. 9 B), the local spring constant appears to be fairly independent of force in the respective force ranges tested, supporting the linear spring model. In fact, no statistically significant differences between spring constant values of any two neighboring data points are noted. Furthermore, the slopes of the trend lines of the data in both panels of Fig. 9 are not statistically significantly different from zero (p = 0.68). This was also the case for the molecular spring constants obtained by the stretch method at different forces (data not shown).
FIGURE 9.

Molecular spring constants of P-selectin-G1 complex (A, 86 measurements) and L-selectin-PSGL-1 complex (B, 106 measurements) measured in a range of fixed forces by the thermal method (points, mean ± SE) are compared to fits (curves) by the three polymer elastic models (Eq. 11). The best-fit FJC model parameters are, respectively, L = 1107 nm and l = 0.12 nm (A) and L = 90.9 nm and l = 0.04 nm (B). The best-fit WLC model parameters are, respectively, L = 292 nm and l = 0.022 nm (A) and L = 114 nm and l = 0.02 nm (B). The best-fit MFJC model parameters for the P-selectin-G1 complex are: L = 9.89 nm, l = 0.53 nm, and km = 1.05 pN/nm (A). Two sets of MFJC model parameters for the L-selectin-PSGL-1 complex are presented in the text; these correspond to two very distinct curves (dark dashed and light dotted) with similar goodness of fit. Part of the light dotted curve is obscured because it overlaps with the light solid curve of the FJC fit (B). The respective spring constants (mean ± SE) for P-selectin-G1 and L-selectin-PSGL-1 averaged from all data over their respective force ranges are 0.99 ± 0.11 and 3.3 ± 0.15 pN/nm, respectively.
To further confirm the irrelevance of the polymer elasticity models, the respective local spring constants at a given force (or extension) level for the three models were calculated from Eq. 10,
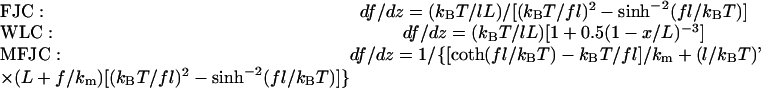 |
(11a-11c) |
and fit to the k versus f data in Fig. 9. It is evident that the best fits are no better than a linear elastic model with the same spring constant across the entire force range tested. In addition, these fits are somewhat arbitrary. For example, two MFJC model fits of nearly identical goodness-of-fit (χ2 = 1.8 vs. 1.9) can have quite different shapes (Fig. 9 B, light dotted and dark dashed curves) and parameters (L = 50.3 nm, l = 0.01 nm, and km = 1.76 pN/nm vs. L = 2.86 nm, l = 0.88 nm, and km = 3.9 pN/nm). Thus, aside from its ability to fit the data by freely adjusting its parameters, it is not justified to apply to our data the MFJC model proposed for the elasticity of P-selectin in the previous study (30). Furthermore, the previous study used biotinylated P-selectin-Ig and PSGL-1-Ig chimeras (where the antibody alone on average was modified with 10 biotins) to immobilize the molecules on the coverslips and on the AFM tips (30). This most likely resulted in random length in the specimens that were stretched, which might also have contributed to the much higher P-selectin spring constant of 5.3 ± 1.5 pN/nm (30). By comparison, we used the bilayer and capture protocols for immobilizing the selectins and (s)PSGL-1 (cf. Fig. 1). The immobilization of P-selectin through the lipid bilayer was determined by dual color fluorescence recovery after photobleaching experiment. Both lipid (labeled by nitrobenzoxadiazole fluorescence) and P-selectin (labeled with G1) appeared uniformly distributed under confocal microscopy. However, lipid fluorescence, but not protein fluorescence, could quickly recover after photobleaching, indicating that the bilayer was continuous and that P-selectin was immobilized presumably by attaching its cytoplasmic tail to the PEI layer (26). This procedure ensures a uniform length of the extracellular domain outside the lipid bilayer for both P- and L-selectin. Although it is still possible for the (s)PSGL-1 captured (and mAbs directly coated) on the AFM tip to have variable angular rotations, they would most likely only result in small errors because the noncoaxial effect manifests primarily as variable dead-zone lengths. Taken together, our results suggest that L-selectin and P-selectin can be modeled as linear springs of respective spring constants of ∼4 and ∼1 pN/nm.
Dead-zone analysis
To identify what the dead zone may represent, its length distribution was characterized by histogram analysis (Fig. 10 A). All histograms exhibited a single peak for the four selectin-(s)PSGL-1 and -mAb complexes studied. The extracelluar domain of P-selectin appears rod-like and measures 38 nm in length under electron microscopy (35), which predicts a 12-nm resting length for the L-selectin ectodomain. The linear length of an IgG is 16 nm. PSGL-1 also appears extended and measures 50 nm in length under electron microscopy (36). Since it was captured by PL2 at nearly the middle, the binding pocket of PSGL-1 should extend ∼41 nm from the AFM tip (16 nm from the IgG and ∼25 nm from where PL2 captured (s)PSGL-1) (cf. Fig. 1). Interestingly, the dead-zone length distribution for the longer molecular complex shifted rightward relative to that for the shorter molecular complex in both cases of P-selectin and L-selectin (Fig. 10 A). Indeed, the mean dead-zone length (Fig. 10 B) and the most probable dead-zone length (i.e., the peak location) (Fig. 10 C) were found to correlate linearly with the total resting length of the molecular complex. Remarkably, the mean (and most probable) dead-zone lengths were nearly the same for the P-selectin-G1 complex and the L-selectin-PSGL-1 complex, which have nearly the same total resting length (54 and 53 nm, respectively, from the AFM tip to the bilayer) but are two very different systems. The maximum dead-zone length observed for any molecular system was never longer than the total resting length of that molecular complex (measured from the AFM tip to the bilayer). These combined data suggest that the dead zone arises from the fact that a molecule has to be picked up by its counter molecule, both of which have finite lengths. Further, the molecular complex has to be oriented and aligned along its long axis before it can resist tensile force that stretches it beyond its resting length. The highly variable dead-zone length (Figs. 8 and 10 A) can be explained as follows. The densities of selectins on the bilayer and (s)PSGL-1 or mAb on the AFM tip were kept low to ensure single molecular interactions. The average distance between two neighboring selectins on the bilayer was tens of nanometers, comparable to the size of the AFM tip, which on average had only an (s)PSGL-1/mAb capable of forming bonds with the selectin bilayer. As such, the experimenter could not always land an (s)PSGL-1/mAb right on top of a selectin, thereby yielding variable angular rotations of the AFM tip during noncoaxial alignment, resulting in broad distributions in the dead-zone length.
Resistance to sudden unfolding
For measurements with the thermal method, the P-selectin and L-selectin were subjected to respective holding forces (and elongations) as high as 50 pN (50 nm) and 150 pN (35 nm), respectively. The highest forces (and elongations) measured in the stretch method were even higher, ∼200 pN (∼200 nm) for P-selectin and ∼250 pN (∼60 nm) for L-selectin. Thus, the highest strain that P- and L-selectin experienced in our experiments was ∼500%. Despite the high forces and high strains, we did not find any evidence of sudden protein unfolding, manifesting as an abrupt increase in molecular extension with a concurrent abrupt drop in force without dissociation of the selectin-(s)PSGL-1 (or -mAb) complex. By comparison, a number of studies have reported successive sudden unfolding of protein globular domains, e.g., titin (7,37,38), tenascin (5), fibronectin (39), and ubiquitin (40), manifesting as a sawtooth pattern in the force-extension curve. Such sudden unfolding was observed to occur at comparable forces and at strains as low as 20% in both the constant-rate stretch mode and constant-force holding mode. The high level of resistance to sudden unfolding for the selectins may be due to the presence of six cysteines in each of their CR domains (41). These cysteines are predicted to form three intradomain disulfide bonds per CR domain, which have been shown to protect melanoma cell adhesion molecules from being unfolded by force (2). Additional resistance may come from the lectin domain, which has two disulfide bonds, and from the EGF domain, which has three disulfide bonds (41,42).
In summary, elasticity measurements of P- and L-selectin complexed with (s)PSGL-1 and mAbs support the validity of the theoretical analysis of mechanical responses of AFM cantilevers to thermal excitations (13), as values measured by the thermal fluctuation method that is based on this theory are comparable to those measured by the conventional stretch method. Our data suggest that selectins behave as linear springs with compliance proportional to their length, which are much greater than those of (s)PSGL-1 and IgG. They can sustain large forces and high strain and resist sudden unfolding under physiological forces. These properties may be important for the selectins, which function in a mechanically stressful environment.
SUPPLEMENTARY MATERIAL
An online supplement to this article can be found by visiting BJ Online at http://www.biophysj.org.
Supplementary Material
Acknowledgments
Note added in proof: After this article was accepted, we became aware of a related article (43), which used a single-degree-of-freedom model to analyze the thermal fluctuations of an AFM cantilever coupled to a molecule.
We thank Vincent Moy for providing the AFM design and training. We also thank John Slanina and Jizhong Lou for assistance in the data collection and analysis.
This work was supported by National Institutes of Health grants AI 44902 (C.Z.), HL65631 (R.P.M.), and HL054614 (M.B.L.). B.T.M. was a recipient of the Whitaker Foundation Graduate Fellowship.
Bryan T. Marshall and Krishna K. Sarangapani contributed equally to this work.
Bryan T. Marshall's present address is Aderans Research Institute, Atlanta, GA 30332.
Jianhua Wu's present address is College of Life Sciences, Sun Yat-Sen University, Guangzhou, China, 510275.
References
- 1.Mehta, A. D., M. Rief, J. A. Spudich, D. A. Smith, and R. M. Simmons. 1999. Single-molecule biomechanics with optical methods. Science. 283:1689–1695. [DOI] [PubMed] [Google Scholar]
- 2.Carl, P., C. H. Kwok, G. Manderson, D. W. Speicher, and D. E. Discher. 2001. Forced unfolding modulated by disulfide bonds in the Ig domains of a cell adhesion molecule. Proc. Natl. Acad. Sci. USA. 98:1565–1570. [DOI] [PMC free article] [PubMed] [Google Scholar]
- 3.Kataoka, N., K. Iwaki, K. Hashimoto, S. Mochizuki, Y. Ogasawara, M. Sato, K. Tsujioka, and F. Kajiya. 2002. Measurements of endothelial cell-to-cell and cell-to-substrate gaps and micromechanical properties of endothelial cells during monocyte adhesion. Proc. Natl. Acad. Sci. USA. 99:15638–15643. [DOI] [PMC free article] [PubMed] [Google Scholar]
- 4.Kis, A., S. Kasas, B. Babic, A. J. Kulik, W. Benoit, G. A. Briggs, C. Schonenberger, S. Catsicas, and L. Forro. 2002. Nanomechanics of microtubules. Phys. Rev. Lett. 89:248101. [DOI] [PubMed] [Google Scholar]
- 5.Oberhauser, A. F., P. E. Marszalek, H. P. Erickson, and J. M. Fernandez. 1998. The molecular elasticity of the extracellular matrix protein tenascin. Nature. 393:181–185. [DOI] [PubMed] [Google Scholar]
- 6.Radmacher, M., M. Fritz, C. M. Kacher, J. P. Cleveland, and P. K. Hansma. 1996. Measuring the viscoelastic properties of human platelets with the atomic force microscope. Biophys. J. 70:556–567. [DOI] [PMC free article] [PubMed] [Google Scholar]
- 7.Rief, M., M. Gautel, F. Oesterhelt, J. M. Fernandez, and H. E. Gaub. 1997. Reversible unfolding of individual titin immunoglobulin domains by AFM. Science. 276:1109–1112. [DOI] [PubMed] [Google Scholar]
- 8.Sarid, D. 1994. Scanning Force Microscopy: With Applications to Electric, Magnetic, and Atomic Forces. Oxford University Press, New York.
- 9.Bustamante, C., S. B. Smith, J. Liphardt, and D. Smith. 2000. Single-molecule studies of DNA mechanics. Curr. Opin. Struct. Biol. 10:279–285. [DOI] [PubMed] [Google Scholar]
- 10.Grier, D. G. 2003. A revolution in optical manipulation. Nature. 424:810–816. [DOI] [PubMed] [Google Scholar]
- 11.Gittes, F., B. Mickey, J. Nettleton, and J. Howard. 1993. Flexural rigidity of microtubules and actin filaments measured from thermal fluctuations in shape. J. Cell Biol. 120:923–934. [DOI] [PMC free article] [PubMed] [Google Scholar]
- 12.Strey, H., M. Peterson, and E. Sackmann. 1995. Measurement of erythrocyte membrane elasticity by flicker eigenmode decomposition. Biophys. J. 69:478–488. [DOI] [PMC free article] [PubMed] [Google Scholar]
- 13.Wu, J., Y. Fang, D. Yang, and C. Zhu. 2005. Thermo-mechanical responses of a surface-coupled AFM cantilever. J. Biomech. Eng. 127:1208–1215. [DOI] [PubMed] [Google Scholar]
- 14.McEver, R. P. 2002. Selectins: lectins that initiate cell adhesion under flow. Curr. Opin. Cell Biol. 14:581–586. [DOI] [PubMed] [Google Scholar]
- 15.McEver, R. P., and R. D. Cummings. 1997. Perspectives series: cell adhesion in vascular biology. Role of PSGL-1 binding to selectins in leukocyte recruitment. J. Clin. Invest. 100:485–491. [DOI] [PMC free article] [PubMed] [Google Scholar]
- 16.Vestweber, D., and J. E. Blanks. 1999. Mechanisms that regulate the function of the selectins and their ligands. Physiol. Rev. 79:181–213. [DOI] [PubMed] [Google Scholar]
- 17.Moore, K. L., N. L. Stults, S. Diaz, D. F. Smith, R. D. Cummings, A. Varki, and R. P. McEver. 1992. Identification of a specific glycoprotein ligand for P-selectin (CD62) on myeloid cells. J. Cell Biol. 118:445–456. [DOI] [PMC free article] [PubMed] [Google Scholar]
- 18.Lawrence, M. B., G. S. Kansas, E. J. Kunkel, and K. Ley. 1997. Threshold levels of fluid shear promote leukocyte adhesion through selectins (CD62L,P,E). J. Cell Biol. 136:717–727. [DOI] [PMC free article] [PubMed] [Google Scholar]
- 19.Yago, T., A. Leppänen, H. Qiu, W. D. Marcus, M. U. Nollert, C. Zhu, R. D. Cummings, and R. P. McEver. 2002. Distinct molecular and cellular contributions to stabilizing selectin-mediated rolling under flow. J. Cell Biol. 158:787–799. [DOI] [PMC free article] [PubMed] [Google Scholar]
- 20.Geng, J.-G., M. P. Bevilacqua, K. L. Moore, T. M. McIntyre, S. M. Prescott, J. M. Kim, G. A. Bliss, G. A. Zimmerman, and R. P. McEver. 1990. Rapid neutrophil adhesion to activated endothelium mediated by GMP-140. Nature. 343:757–760. [DOI] [PubMed] [Google Scholar]
- 21.Kishimoto, T. K., M. A. Jutila, and E. C. Butcher. 1990. Identification of a human peripheral lymph node homing receptor: a rapidly down-regulated adhesion molecule. Proc. Natl. Acad. Sci. USA. 87:2244–2248. [DOI] [PMC free article] [PubMed] [Google Scholar]
- 22.Moore, K. L., K. D. Patel, R. E. Bruehl, L. Fugang, D. A. Johnson, H. S. Lichenstein, R. D. Cummings, D. F. Bainton, and R. P. McEver. 1995. P-selectin glycoprotein ligand-1 mediates rolling of human neutrophils on P-selectin. J. Cell Biol. 128:661–671. [DOI] [PMC free article] [PubMed] [Google Scholar]
- 23.McConnell, H. M., T. H. Watts, R. M. Weis, and A. A. Brian. 1986. Supported planar membranes in studies of cell-cell recognition in the immune system. Biochim. Biophys. Acta. 864:95–106. [DOI] [PubMed] [Google Scholar]
- 24.Marshall, B. T., M. Long, J. W. Piper, T. Yago, R. P. McEver, and C. Zhu. 2003. Direct observation of catch bonds involving cell-adhesion molecules. Nature. 423:190–193. [DOI] [PubMed] [Google Scholar]
- 25.Sarangapani, K. K., T. Yago, A. G. Klopocki, M. B. Lawrence, C. B. Fieger, S. D. Rosen, R. P. McEver, and C. Zhu. 2004. Low force decelerates L-selectin dissociation from P-selectin glycoprotein ligand-1 and endoglycan. J. Biol. Chem. 279:2291–2298. [DOI] [PubMed] [Google Scholar]
- 26.Marshall, B. T. 2002. Force and bond lifetime relationship of the P-selectin/PSGL-1 interaction. PhD thesis. School of Mechanical Engineering, Georgia Institute of Technology, Atlanta, GA.
- 27.Hutter, J. L., and J. Bechhoefer. 1993. Calibration of atomic-force microscope tips. Rev. Sci. Instrum. 64:1868–1873. [Google Scholar]
- 28.Chesla, S. E., P. Selvaraj, and C. Zhu. 1998. Measuring two-dimensional receptor-ligand binding kinetics by micropipette. Biophys. J. 75:1553–1572. [DOI] [PMC free article] [PubMed] [Google Scholar]
- 29.Zhu, C., M. Long, S. E. Chesla, and P. Bongrand. 2002. Measuring receptor/ligand interaction at the single-bond level: experimental and interpretative issues. Ann. Biomed. Eng. 30:305–314. [DOI] [PubMed] [Google Scholar]
- 30.Fritz, J., A. G. Katopodis, F. Kolbinger, and D. Anselmetti. 1998. Force-mediated kinetics of single P-selectin/ligand complexes observed by atomic force microscopy. Proc. Natl. Acad. Sci. USA. 95:12283–12288. [DOI] [PMC free article] [PubMed] [Google Scholar]
- 31.Doi, M., and S. F. Edwards. 1986. The Theory of Polymer Dynamics. Oxford University Press, London.
- 32.Fixman, M., and J. Kovac. 1973. Polymer conformational statistics. III. Modified Gaussian models of stiff chains. J. Chem. Phys. 58:1564–1568. [Google Scholar]
- 33.Marko, J. F., and E. D. Siggia. 1995. Stretching DNA. Macromolecules. 28:8759–8770. [Google Scholar]
- 34.Merkel, R. 2001. Force spectroscopy on single passive biomolecules and single biomolecular bonds. Phys. Rep. 346:343–385. [Google Scholar]
- 35.Ushiyama, S., T. M. Laue, K. L. Moore, H. P. Erickson, and R. P. McEver. 1993. Structural and functional characterization of monomeric soluble P-selectin and comparison with membrane P-selectin. J. Biol. Chem. 268:15229–15237. [PubMed] [Google Scholar]
- 36.Li, F., H. P. Erickson, J. A. James, K. L. Moore, R. D. Cummings, and R. P. McEver. 1996. Visualization of P-selectin glycoprotein ligand-1 as a highly extended molecule and mapping of protein epitopes for monoclonal antibodies. J. Biol. Chem. 271:6342–6348. [DOI] [PubMed] [Google Scholar]
- 37.Rief, M., M. Gautel, A. Schemmel, and H. E. Gaub. 1998. The mechanical stability of immunoglobulin and fibronectin III domains in the muscle protein titin measured by atomic force microscopy. Biophys. J. 75:3008–3014. [DOI] [PMC free article] [PubMed] [Google Scholar]
- 38.Oberhauser, A. F., P. K. Hansma, M. Carrion-Vazquez, and J. M. Fernandez. 2001. Stepwise unfolding of titin under force-clamp atomic force microscopy. Proc. Natl. Acad. Sci. USA. 98:468–472. [DOI] [PMC free article] [PubMed] [Google Scholar]
- 39.Oberhauser, A. F., C. Badilla, and J. M. Fernandez. 2002. The mechanical hierarchies of fibronectin observed with single-molecule AFM. J. Mol. Biol. 319:433–447. [DOI] [PubMed] [Google Scholar]
- 40.Carrion-Vazquez, M., H. Li, H. Lu, P. E. Marszalek, A. F. Oberhauser, and J. M. Fernandez. 2003. The mechanical stability of ubiquitin is linkage dependent. Nat. Struct. Biol. 10:738–743. [DOI] [PubMed] [Google Scholar]
- 41.Johnston, G. I., R. G. Cook, and R. P. McEver. 1989. Cloning of GMP-140, a granule membrane protein of platelets and endothelium: sequence similarity to proteins involved in cell adhesion and inflammation. Cell. 56:1033–1044. [DOI] [PubMed] [Google Scholar]
- 42.Somers, W. S., J. Tang, G. D. Shaw, and R. T. Camphausen. 2000. Insights into the molecular basis of leukocyte tethering and rolling revealed by structures of P- and E-selectin bound to SLe(X) and PSGL-1. Cell. 103:467–479. [DOI] [PubMed] [Google Scholar]
- 43.Kawakami, M., K. Byrne, B. Khatri, T. C. McLeish, S. E. Radford, and D. A. Smith. 2004. Viscoelastic properties of single polysaccharide molecules determined by analysis of thermally driven oscillations of an atomic force microscope cantilever. Langmuir. 20:9299–9303. [DOI] [PubMed] [Google Scholar]
Associated Data
This section collects any data citations, data availability statements, or supplementary materials included in this article.