

Abstract
The mechanical load borne by a molecular motor affects its force, sliding distance, and its rate of energy transduction. The control of ATPase activity by the mechanical load on a muscle tunes its efficiency to the immediate task, increasing ATP hydrolysis as the power output increases at forces less than isometric (the Fenn effect) and suppressing ATP hydrolysis when the force is greater than isometric. In this work, we used a novel ‘isometric’ optical clamp to study the mechanics of myosin II molecules to detect the reaction steps that depend on the dynamic properties of the load. An actin filament suspended between two beads and held in separate optical traps is brought close to a surface that is sparsely coated with motor proteins on pedestals of silica beads. A feedback system increases the effective stiffness of the actin by clamping the force on one of the beads and moving the other bead electrooptically. Forces measured during actomyosin interactions are increased at higher effective stiffness. The results indicate that single myosin molecules transduce energy nearly as efficiently as whole muscle and that the mechanical control of the ATP hydrolysis rate is in part exerted by reversal of the force-generating actomyosin transition under high load without net utilization of ATP.
INTRODUCTION
Optical trap studies of individual molecular motors have contributed to our understanding of the mechanism of muscle contraction and motility of unconventional myosins (1,2). Forces and displacements produced by single myosin molecules (3–8), the effects of mutations and truncations (9–14), and modulation by imposed force (3–5,12,15–18) have all been addressed. For studies of conventional myosin, the “three-bead assay” is particularly effective (3). In this method, an actin filament, suspended between two beads that are held by separate traps, is brought close to a surface that is sparsely coated with motor proteins deposited on pedestals of silica beads.
Previous investigations using the three-bead assay have recorded single myosin II displacements varying from 4 to 11 nm and unitary isometric forces varying from ∼0.8 to 7 pN (3–5,10,12,19,20). Taking a typical average unitary force (F ≅ 3 pN) and unitary displacement (d ≅ 10 nm) from previous single molecule measurements and assuming that the mechanical energy stored in actomyosin is that of a Hookean (linear) spring, the maximum work (W) that can be performed during a single actomyosin interaction is given by W = 1/2 × F × d = 1/2 × 3 pN × 10 nm = 15 × 10−21 J. The measured thermodynamic efficiency of contracting whole muscles measured during contraction was as high as 50%–60% (21–23). Assuming that myosin molecules hydrolyze one ATP molecule per mechanical cycle and that the free energy of ATP hydrolysis (ΔGATP) = 100 × 10−21 J, the maximum mechanical work performed per ATPase cycle in muscle is 50–60 × 10−21 J. Thus, the typical maximal work estimate from single molecule studies (15 × 10−21 J) is only 25%–30% of that observed in living muscles. Possible reasons for this discrepancy are that the myosin's mechanical elasticity is not linear or that the previously measured forces and displacements are lowered by an artifact such as attenuation by the actin-bead or the myosin-bead connection compliance (24,25).
The optical traps used in motility research are typically 2–6% as stiff as the actomyosin complex (stiffness (κam) ≅ 1 pN/nm of displacement). Thus in most optical traps, in this low stiffness/high compliance regime, the displacement caused by an actomyosin interaction is measured under small load. Finer et al. (3,19) used a feedback loop in a three-bead experiment to maintain (clamp) the position of one of the beads, in a fixed place to reduce the motion. The force measured in this experiment for whole conventional myosin molecules averaged 3.5 pN. The actin still moved significantly, however, when myosin attached because the linkage stiffness between the bead and the actin filament is comparable to the actomyosin stiffness. The reduction below the true isometric force that would be measured if the actin movements were prevented is unknown. The bead-actin compliance is highly nonlinear (24,25) and includes the effect of the bead rotating under the tangential force of the filament (24), but it can be reduced by applying high prestretch between the two beads suspending the filament. Linkage stiffness values up to 0.26 pN/nm using a pre-tension of 2 pN have been achieved (5). The linkage stiffness increases further at higher pre-tensions, but this is limited by the adhesion strength of noncovalent bonds and the effect of bead rotation under variable force. Thus high pre-tension does not eliminate the effects of end compliance.
In this work, a different approach is taken to reduce and vary the amount of actin motion occurring when myosin attaches. Based on the three-bead assay electrooptical feedback clamps the actin filament and one of the beads, termed the transducer bead, in position by changing the force on the other, motor, bead. The effective stiffness of the trap is increased, enabling testing of the effect of this stiffness on the developed force. The results indicate that force developed by single actomyosin interactions is considerably increased when the dynamic stiffness of actin presented to the myosin molecule is increased.
The rate of energy liberation during muscle contraction increases above that of an isometric contraction when the load is reduced and the filaments are allowed to slide (26). This observation was important in the development of the cross-bridge theory of contraction (27). The control of biochemical reactions by the external load indicates that a sarcomere does not release a fixed amount of free energy with each contraction. For several types of myosin, the rate of ADP release is dependent on mechanical strain in the expected direction (17,18,28,29). The properties expected for an actomyosin ATPase cycle with strain-dependent, rate-limiting ADP release are high ADP affinity, weak coupling between ADP binding and actomyosin affinity, high duty ratio (a large fraction of each actomyosin cycle attached to actin), and a conformational change associated with ADP release (30). Skeletal muscle myosin does not fit into this pattern because it has a low duty ratio, (<5%) (31–34), strong coupling between ADP binding and actomyosin affinity, weak ADP affinity (35), and no conformational change associated with ADP release (36). Thus other steps in the actomyosin ATPase cycle may be the crucial strain-dependent steps in muscle.
By varying the gain of the feedback loop in the actin clamp system, the dynamic stiffness and loading rate of the myosin attachment can be varied. A high dynamic stiffness is expected to probe actomyosin interactions toward the beginning of the power stroke, and low dynamic stiffness should emphasize interactions toward the end of the power stroke. Surprisingly, these results show that higher dynamic stiffness results in shorter duration actomyosin attachment events. This observation suggests that mechanochemical modulation does indeed take place at the beginning of the power stroke. Some of these results have been presented in abstract form (37–42).
MATERIALS AND METHODS
Optical trap layout
The dual beam laser tweezers (Fig. 1) is based on an inverted microscope (Diaphot 300; Nikon, Tokyo, Japan) equipped with a high numerical aperture (NA) (1.3) objective lens (Nikon, Fluor 100× oil immersion). A single laser beam from an Nd:YAG laser (Spectra Physics, Mountain View, CA) is split into two orthogonally polarized beams to produce two optical traps (43), designated the “motor trap” and the “transducer trap”. The position of the motor trap can be controlled rapidly (∼3 μs) with an acoustooptic deflector (AOD) (Brimrose Corporation of America, Baltimore, MD), and the transducer trap position can be controlled manually.
FIGURE 1.

Optical scheme of the dual-beam optical trap. The optical tweezers setup incorporates a single FCBar Nd-YAG laser diode (λ = 1064 nm, Spectra-Physics Lasers) split into two traps with different polarizations. A two-dimensional AOD (Brimrose Corporation of America) enables rapid (∼3 μs) electronic control of the horizontally polarized trap. Force measurements of the trapped beads are collected using the BFP force detectors (44,47). These detectors are quadrant photodiodes (Current Designs, Inc.) placed at a plane optically conjugate to the BFP of the condenser. The intensity distribution at the quadrant detectors indicates the deflection of the bead relative to the center of the trap and, therefore, proportional to the applied force. Only the vertical polarization (i.e., the motor trap) of the two beams is shown for simplicity on this diagram after PBC. Abbreviations are: M, mirror; DM, dichroic mirror; PBS, polarization beam splitter; PBC, polarization beam combiner; BE, beam expander; O, objective; C, condenser; λ/2 Plate, half-wave plate.
After passing through the polystyrene beads used as handles to manipulate actin at the specimen plane, the scattered beams are collected with a 1.4-NA oil immersion condenser lens (Nikon). The back focal plane (BFP) of the oil condenser is imaged onto a pair of quadrant photodiode detectors (Current Designs, Philadelphia, PA; Light Spot Quadrant Detector System), one each for motor and transducer trap (43,44). Deflections of the optical trap light by the two beads are proportional to the forces on the beads rather than their positions (44–47). The output currents from the four quadrants of the photodiodes are converted to four voltages, which are combined to yield two signals proportional to forces in the x- and y-directions (48).
The sample chamber is mounted on a piezoelectric stage (Queensgate Instruments, Torquay, UK) for fine adjustment of x-, y-, and z-positions.
Preparation of proteins
Myosin
Full-length rabbit skeletal myosin was prepared as described by Margossian and Lowey (49), and modified by Harada et al. (50), stored before use in 50% glycerol and 0.6 M KCl at −20°C, and diluted in a buffered salt solution (0.5 M KCl, 5 mM MgCl2, 0.1 mM EGTA, 10 mM DTT, 10 mM Hepes, pH 7.0) to 0.05 μg/ml for coating the experimental chamber surface.
G-actin
Actin from rabbit skeletal muscle was prepared essentially as described by Pardee and Spudich (51) and further purified by gel filtration (52) using a Superdex 200-pg column (Amersham Biosciences, Piscataway, NJ).
Biotinylated G-actin
Globular (G-) actin was biotinylated with ∼50% efficiency on Cys-374 in 5 mM Tris-Cl, 0.2 mM CaCl2, 0.2 mM NaN3, 0.1 mM Tris(2-carboxyethyl)phosphine (Sigma-Aldrich, St. Louis, MO) with a 10-fold excess of EZ-Link PEO-Iodoacetyl biotin ((+)-Biotinyl-iodoacetamidyl-3, 6-dioxaoctanediamine) (Pierce, Rockford, IL) at 4°C in the dark. After 45 min, the actin was polymerized by addition of 0.1 M KCl and 2 mM MgCl2 and left overnight at 4°C. The biotinylated filamentous (F-) actin was then pelleted by centrifugation at 200,000 × g for 30 min, resuspended in depolymerizing buffer (2 mM Tris-Cl, pH 8.0 at 25°C, 0.2 mM ATP, 0.5 mM DTT, 0.1 mM CaCl2, 1 mM NaN3), dialyzed against depolymerizing buffer for 48 h, gel filtered as for unmodified actin, and stored as frozen aliquots at −80°C.
Preparation of biotinylated F-actin
A total of 20 μM biotinylated F-actin was prepared by mixing G-actin from rabbit skeletal muscle with biotinylated G-actin (1:10 biotin/unlabeled) (6) in polymerization buffer (0.5 M KCl, 10 mM MgCl2, 10 mM EGTA, 100 mM Imidizole, pH 7.0), with an excess of phalloidin-tetramethyl-rhodamine B isothiocyanate (TRITC-Phalloidin) (Fluka Chemicals, Milwaukee, WI). The in vitro motility of actin filaments with 10% biotinylated actin on heavy meromyosin (HMM) was indistinguishable from that of unlabeled actin.
NeutrAvidin-biotinylated polystyrene beads
NeutrAvidin biotin binding protein was used as a cross-linker between the biotin labeled polystyrene beads and the biotin F-actin as previous protocols (6,53). Briefly, 9 μl of 1 μm (diameter) biotin beads (Sigma-Aldrich, 1% vol.) were incubated with 30 μl of 10 mg/ml NeutrAvidin (Pierce) for 1 h. The incubated beads were washed and sedimented (13,000 × g for 5 min) six times in 2 mg/ml BSA (Sigma-Aldrich) in low ionic strength buffer, Buffer A (20 mM KCl, 5 mM MgCl2, 0.1 mM EGTA, 10 mM DTT, 10 mM Hepes, pH 7.0) to reduce nonspecific protein binding and to remove free NeutrAvidin from the supernatant. The NeutrAvidin-biotin beads were resuspended in 300 μl of Buffer A and aspirated using a 27G 1/2″ needle attached to a 1 ml syringe to disrupt aggregates.
Experimental chamber construction
Pedestal coverslips were made as described in Veigel et al. (25). Dehydrated 1.9 μm silica microspheres (Bangs Laboratories, Fishers, IN) were suspended in amyl acetate (Ernest F. Fullum, Latham, NY) and 0.1% “super clean” nitrocellulose solution (Ernest F. Fullum, 11180). The mixture was then “smeared” over a 25 × 40 mm microscope cover glass, using the side of a pipette tip, and air dried. An assay chamber was constructed using a microscope slide, pedestal coverslip, double-sided adhesive tape, and vacuum grease. The constructed chamber volume was ∼20 μl.
The chamber was filled with the following sequence of solutions: 0.05 μg/ml of rabbit skeletal muscle myosin for 10 min, 2 mg/ml BSA in Buffer A for 10 min (×2), sheared actin (5 μM; sheared 10 times using a 27G 1/2″ needle attached to a 1 ml syringe) for 10 min, 1 mM ATP in Buffer A for 3 min (×2), and then Buffer A for 1 min (×4).
In vitro force assay (“three-bead assay”) protocol
Tetramethyl-rhodamine phalloidin-biotinylated F-actin (2 nM) and covalently linked NeutrAvidin beads (Polysciences, Warrington, PA; final content = 0.0015% by volume) were suspended in Buffer A with 10 μM ATP, 2.5 mg/ml glucose, 0.1 mg/ml glucose oxidase (Sigma-Aldrich), 0.02 mg/ml catalase (Sigma-Aldrich), and 20 nM TRITC-phalloidin. The actin-bead mixture was incubated at room temperature for 30 min and then added to the chamber. Bead-actin-bead assemblies were found in the chamber and then trapped using two optical traps. The optical trap forces are calibrated as described below. The trapped actin filament could be pre-tensioned to ∼5 pN for sustained periods (>45 min) with these linkages. The assembly was then lowered near to the surface of a silica bead and several positions at the top of a pedestal sampled for actomyosin interactions by translating the piezoelectric stage. Approximately one out of 10 scanned pedestals yielded actomyosin interactions. Each experimental chamber with the actin-bead mixture was used for up to 2 h.
Trap stiffness and photodiode sensitivity calibration
To convert the voltage signals acquired from the quadrant photodiode detectors into their force and displacement equivalents, calibrations of trap stiffness (κtrap) and detector sensitivity (C) were performed for every bead-actin-bead assembly used to collect actomyosin interactions. After a bead-actin-bead complex was captured by the traps, the tension in the actin filament was reduced to zero, so that the Brownian motions of the two beads became uncorrelated. This calibration was performed at a height near to the top of a silica pedestal. The signals corresponding to the Brownian motion of each bead were collected for 5 s at 20 kHz sampling rate. Trap stiffness (κtrap) and detector sensitivity (C) were calculated from the power spectrum of these fluctuations as previously reported (54). The trap stiffness and photodiode sensitivity calibration are described further in the Supplementary Material.
Isometric force clamp
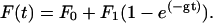
To reduce the effect of end compliance and to apply different loading conditions at the single molecule level, we used the three-bead assay incorporating a novel feedback scheme, the isometric clamp (Fig. 2 a). Rather than clamp a single bead at a fixed position as has been done in the past (3–5), we used a different strategy in which the entire bead-actin-bead assembly was clamped at a fixed length. This increases the effective dynamic stiffness presented to the myosin molecule (38). In this case one of the beads, termed the transducer bead, detected force whereas the other bead, the motor bead, opposed the detected force to maintain the bead-actin-bead assembly at its initial position. The force signal measured from the transducer bead was fed through an analog integrating feedback circuit (designed and assembled in-house) to move the motor trap position using the AOD. The rate at which the motor trap moves depends on the integral gain of the feedback. When the feedback loop settles, the transducer bead and the actin filament are both returned to their preattachment positions. Altering the gain of the feedback loop, thus the settling time of the transducer bead, varies the initial loading rate experienced by the actomyosin interaction.
FIGURE 2.

Step-by-step motion of the isometric clamp. The sequential mechanism of the isometric force clamp with and without an actomyosin attachment can be summarized as follows. Without an actomyosin attachment, as in panel a, the clamp is stable so that the average laser forces on the two beads are equal and opposite. Even without an actomyosin attachment, the clamp responds to Brownian motions by reducing the fluctuations of the transducer bead while increasing the fluctuations of the motor bead. When myosin attaches and undergoes a power stroke, as in panel b, the actin and both beads immediately move toward the pointed end, decreasing the tension between the myosin and the transducer bead and increasing it between the myosin and the motor bead. As an example, the force produced by the myosin is shown as 2 pN in panel b. The amplified integral of the error signal from the transducer detector moves the motor trap to the right, further increasing the tension on the motor bead such that the transducer bead is returned toward its preattachment position, as shown in panel c. When the feedback loop settles, the transducer bead is returned to its preattachment position returning the actin, and therefore the myosin too, to its prepower stroke position. The measurement of the motor bead force (15 pN) is therefore equal to the exact force exerted by the myosin (10 pN) plus the pre-tension (5 pN), which can be subtracted from the measurement since this offset applied to the actin filament is known from the calibration process. Returning the actin to its preattachment position restores the myosin to its isometric condition while effectively eliminating the end compliance at the transducer bead/actin interface. When the myosin detaches, the actin and both beads move rapidly to the right. The amplified negative error signal from the transducer causes the motor trap to move left, decreasing the force on the motor bead and returning it to the state shown in panel a. The darker circles show the current bead position, and the lighter circles with a dashed circumference show the previous bead positions.
Isometric force clamp adjustment
After calibration of the bead forces, each bead-actin-bead complex was stretched to ∼5 pN tension. A command square wave signal was applied to a summing junction of the transducer trap signal, and the integral feedback loop gain was adjusted to set the half-time, τf, for settling of the feedback error signal to 1 or 10 ms (Fig. S2 in the Supplementary Material). The different integral gain settings were used to collect actomyosin interactions under high (τf = 1 ms) and moderate (τf = 10 ms) dynamic stiffness.
Zero crossing data analysis
Interactions with the feedback operating were selected using zero crossing analysis, whereby interactions were scored as episodes when the motor force did not cross zero for longer than a minimum duration threshold, usually 1 ms. The peak amplitude for each episode was calculated after smoothing groups of five consecutive data points (50 μs sampling interval), and the event duration was defined as the time from the first (positive) zero crossing (Fig. 3, time B) to the time of most negative slope before its subsequent (negative-going) zero crossing (Fig. 3, time C).
FIGURE 3.

Expanded view of a single actomyosin interaction (τf = 1 ms; 10 μM ATP). Force and duration of unitary actomyosin interactions are detected using a zero crossing analysis method. Positive force episodes are defined as the period when the force trace is above zero, and negative episodes as those that are below zero, for more than 1 ms. Each positive episode starts at a negative-to-positive zero crossing of the force on the motor bead (B). The peak of the episode is determined by fitting a quadratic curve to five consecutive data points. After the force peak the force rapidly declines. The time between the start (B) and the point at which the rate of force decline is fastest (C) is defined as the duration of an episode.
Recording without feedback and covariance data analysis
Displacement produced by myosin was also measured under low loads in experiments performed without using feedback.
Actomyosin events, collected without feedback, were analyzed using a covariance threshold, similar to the analysis method used by Mehta et al. (55). The average covariance (cov) of the motor, Fm, and transducer, Ft, force signals was calculated for a time window centered on each data point of the force traces using the equation
 |
(1) |
where 〈 〉 is an average over the time window. The means of Ft, Fm, and FtFm are given by
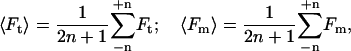 |
(2) |
and
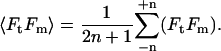 |
(3) |
The covariance is large in the absence of a myosin linkage and decreases during attachment of myosin and actin.
The histogram of the covariance is bimodal with one peak centered about a high average covariance, representing the detached state, and another peak with a low average covariance, representing the attached state (Fig. S3 in the Supplementary Material). To determine durations and amplitudes of actomyosin events, a covariance threshold to separate the noise from events was determined from the covariance histogram. Any instance where the variance decreased by more than two standard deviations away from the high variance peak of the detached state was scored as the start of an event. The end of the event was determined as the subsequent time point when the covariance increased back to the detached state peak.
RESULTS
Actomyosin interactions under varying dynamic load
Fig. 4, a and b, illustrates typical force and displacement measurements of unitary actomyosin interactions using the isometric clamp at high and moderate dynamic stiffness and with feedback turned off, allowing actin displacement. The Brownian fluctuations in bead forces (or positions) were smaller during events than the fluctuations in the intervals between events or in the absence of myosin (not shown). The amplitudes of actomyosin force greatly increased and the durations of actomyosin interactions decreased as the rate of loading was increased (Fig. 4, a and b, no feedback: green, τf = 10 ms: red, τf = 1 ms: blue). Peak forces ranged up to 17 pN for high gain feedback and up to 10 pN for moderate gain feedback. These forces are markedly greater than those in earlier reports (3–5,20). Both positive and negative force events were observed for all three loads. However, the events were predominantly in one direction for each actin filament tested. Actin filaments with predominantly positive force events, assumed to be bound to the motor bead at their barbed ends, were analyzed further.
FIGURE 4.

Unitary actomyosin interactions under varying dynamic loads. (a) 2.5 s of raw data and (b) raw data of typical single events. Forces on motor beads (dark colors) and the transducer beads (lighter colors) during actomyosin interactions collected with the feedback gain of the isometric clamp at τf = 1 ms (blue), τf = 10 ms (red), and with the feedback turned off (green). The forces on beads for individual interactions were extracted from panel a, shown on an expanded timescale. Data collected with 10 μM ATP.
With the transducer bead feedback, both beads exhibited an initial step (Fig. 3, time B) before the integral feedback moved the motor trap and bead. Thereafter, the motor bead force rose, whereas the transducer bead force declined. At time C (Fig. 3) the forces returned to the pre-tension baselines in two phases. The first phase corresponds to the rapid motion of the beads with a time constant defined by the trap stiffness and beads' viscous drag. The second phase corresponds to slower motion of beads as the feedback loop restored the transducer signal to zero. The initial steps and initial slopes of the bead forces varied widely as the myosin and actin bound over a range of relative axial positions. In most events the transducer bead signal failed to reach the zero force before time C. An interpretation of the bead forces and motions in terms of actin and myosin forces and motions are discussed later.
Without feedback (traps fixed in position), the motions of the two beads (Fig. 4, a and b, green traces) were the same as each other and their positions were constant during the actomyosin interaction apart from Brownian noise, as previously reported (3–5).
Synchronized dynamic load actomyosin interactions
To clarify the details of the mechanical events under high dynamic load (τf = 1 ms), the forces and variances of the actomyosin interactions with durations >5 ms were ensemble averaged by synchronizing interactions at their beginnings (Fig. 5 a) and ends (Fig. 5 b) (29) (nepisodes = 1870). As with individual events, the averaged motor bead forces suddenly increased at the start of the event. The average motor force increased by 0.627 ± 0.004 pN and the transducer bead force fell by 0.421 ± 0.003 pN at the beginning of the events, equivalent to an average displacement of the actin filament by 7.46 ± 0.06 nm and 7.02 ± 0.06 nm respectively, comparable to the previously reported myosin power stroke (3–6,20,25). The force of the motor bead in the averaged trace was still rising at 4.52 ± 0.003 pN at the end of the event (Fig. 5 b). Just before detachment, the transducer bead position was restored to 3.50 ± 0.03 nm, 50% of its initial deflection. The stiffness of the average single myosin molecule is thus 4.52 pN ÷ (7.02–3.50 nm) ≅ 1.3 ± 0.02 pN/nm. This stiffness includes the compliance between the molecule and the substrate but not the bead-actin series compliance. The averaged variances of the motor and transducer signals, and their covariance, all decreased at the start of the event, but not instantaneously. They increased more abruptly at the end of an event, suggesting that actomyosin detachment occurs quickly after force reaches the peak. Assuming that all the mechanical elements are linear over the full range of the interaction, the plateau force extrapolated from the average motor force trace was 7.02 nm × 4.52 pN ÷ (7.02–3.50 nm) = 9.0 ± 0.02 pN. This is lower than the largest individual events of 17 pN, but markedly greater than earlier estimates of myosin II active force production (1–4 pN) (3–5,20).
FIGURE 5.

Synchronized events for τf = 1 ms, (a) beginnings and (b) ends of events including all events longer than 5 ms. (c) Synchronized beginnings of events longer than 50 ms. The average forces and variances on the motor bead (dark blue) and transducer bead (light blue) from individual events that are longer than 5 ms synchronized at the start (a, first zero crossing) and end (b, most negative slope before its subsequent zero crossing) of an interaction (τf = 1 ms and 10 μM ATP). The black trace is the covariance of the motor and transducer bead. Both variances and covariance decrease at the time of attachment and increase at the time of detachment, representing the change in stiffness accompanying actomyosin interactions. (c) Events longer than 50 ms were synchronized to determine the apparent rise time of events under high dynamic load.
The rise time of the events with feedback was determined by fitting a step and an exponential curve to the ensemble average of events whose durations were longer than a minimum threshold of 50 ms (Fig. 5 c; nevents = 30). The minimum event duration of 50 ms for this analysis was long enough that the isometric plateau forces were nearly reached, yet short enough to include sufficient events to give an average with relatively low noise. Ensemble averages for events in the range 30–60 ms gave similar rise times. The time required for the exponential to reach half its maximum, t1/2 = 10 ms, for the exponential portion of the increase in motor bead force is 10 times longer than the calibrated feedback response time (τf = 1 ms), indicating that the response time of the feedback loop is appreciably slowed when myosin attaches to actin. The slowing depends on the stiffness of the optical traps, the actin-bead linkages, and the actomyosin. A model of the isometric clamp (described in the Appendix), based on a simple mechanical model of a single myosin molecule exerting a force on an actin filament (25), produces a comparable force trace when the myosin stiffness = 1.1 pN/nm and trap stiffness = 0.07 pN/nm only if the linkage stiffness ≥1 pN/nm. The isometric plateau force measured from events longer than 50 ms is ∼6.5 pN (Fig. 5 c), smaller than the plateau isometric force extrapolated from shorter events (Fig. 5 a), suggesting that the process leading to termination of events is hastened by an increased load or smaller displacement.
Analysis of actomyosin interactions under varying external load
In the absence of feedback, interactions were scored by the decrease of the covariance of the transducer and motor bead force fluctuations (55). This method proved unreliable for brief (<20 ms) isometric interactions. Instead, isometric interactions were selected using the zero crossing analysis, whereby interactions were scored as episodes when the motor force did not cross zero for longer than a minimum duration threshold of 1 ms (Fig. 3) (38). The duration of 1 ms was chosen to be short enough to include many episodes due to Brownian noise.
Episodes were compiled into histograms of durations and peak forces (Fig. 6). Event termination rates were determined from the duration histograms. Histograms of durations of force episodes (Fig. 6 a) were fit with two exponential components. The rate constant for the faster of these exponentials was independent of dynamic load and was nearly the same as that for Brownian noise acquired in the absence of interactions or with the actin filament moved 100 nm away from the site of the actomyosin interaction (Fig. 6, a and b). The rate constant for the slower exponential component was strongly dependent on dynamic load (Fig. 6 a). The durations at intercepts of the fast and slow exponentials were ∼7 ms and ∼15 ms for the high and moderate feedback gains, respectively. Episodes with durations shorter then the values of the intercepts are noise, and episodes with longer durations are interpreted to be actomyosin interactions. The termination rates at 10 μM ATP for high gain feedback actomyosin interactions was 129.5 ± 4.6 s−1 (nepisodes = 106,384, npedestal = 12), for moderate gain feedback, 65.9 ± 1.9 s−1 (nepisodes = 80,729, npedestal = 10), and no feedback, 46.8 ± 1.6 s−1 (nepisodes = 1402, npedestal = 9) (mean ± SD), confirming the earlier observation that the rates are load dependent. A small fraction (<1%) of long duration events for both load settings did not fit on the double exponential curve and may represent an additional termination process.
FIGURE 6.

(a) Duration and (b) peak force histograms compiled using experimental data of unitary actomyosin interaction under varying dynamic loads. Histograms are compiled using the data analyzed by the zero crossing analysis. The histogram of actomyosin interactions (solid symbols) is plotted together with the histogram compiled using data collected away from pedestals (in the absence of myosin), which represent the Brownian fluctuations (open symbols). (a) The curve-fit for the duration histogram for actomyosin events was calculated by adding two exponential curves—the first representing the Brownian noise and the second the probable actomyosin events limited by a single rate-limiting step. (b) The peak force histogram for actomyosin events appeared to have a merged Gaussian and exponential profile. The initial part (i.e., lower forces) of the peak force histogram was curve fit by two Gaussian curves. A narrow Gaussian curve, which accounts for the 1-ms duration threshold for episodes, was subtracted from a broader Gaussian curve, which accounts for the Brownian noise, both centered about zero. The higher peak forces of the histogram were modeled with an exponential curve, assuming that the myosin detachment is limited by a single rate-limiting step.
The histograms of peak motor forces with the isometric clamp could also be fit with two probability distributions. The high force components were approximately fit by single exponentials that extended to 17 pN and 10 pN for the high and moderate force feedback, respectively (Fig. 6 b). The lower force components were well fit by a Gaussian peak centered on zero force with a narrow depression at zero force due to the exclusion of brief, <1 ms, episodes. This peak was identical to the distribution due to Brownian noise obtained in the absence of interactions. If the Gaussian curves represent Brownian noise, then episodes with peak forces greater than the force at the intercept of the Gaussian and exponential curves, 2.5 pN and 3.5 pN for the high and moderate force feedback respectively, are likely due to actomyosin interactions.
DISCUSSION
Actomyosin mechanics
The most striking feature of the results with the isometric clamp is that interactions at high feedback are significantly shorter and reach higher peak forces than interactions with moderate or no feedback. The change in interaction duration is almost certainly a consequence of the effect of force on the kinetics of the actomyosin ATPase and is discussed below. The actomyosin isometric force, 9.0 pN, is higher than previous measurements (3–5,20), probably a consequence of the reduction in end compliance by the feedback in the isometric clamp in addition to high actin pre-tension. Our single molecule isometric force measurement is close to that estimated from a recent high-resolution fiber mechanics study (10 pN) by Piazzesi et al. (56), with both results indicating that the isometric force of single myosin head is greater than previous estimates. The estimated myosin power stroke length, 7.0 nm, was comparable to that previously reported (1,2).The average actomyosin stiffness was 1.3 pN/nm, ∼2–10 times larger than previously reported for double-headed myosins in optical trap measurements (20,25,57,58) but at the low end of the 1–5 pN/nm range determined from muscle fibers under isometric conditions (56,59,60). The single molecule and fiber stiffness may differ for at least two reasons. First myosin attached to a nitrocellulose surface may have a lower stiffness than when incorporated into a thick filament. A second possibility is that the stiffness may change during the power stroke. A myosin head in an isometric fiber remains near the beginning of its power stroke. However even at the highest dynamic load in these experiments, the myosin is pulled on average only half of the way back to the beginning of the power stroke. If the stiffness decreases by a factor of two halfway through the power stroke then the extrapolated isometric force would be higher.
The energy transduced into mechanical work per molecular interaction is in the range of W = 1/2 × F × d = 31.5 × 10⁻²¹ J (Force (F) = 9.0 pN; Displacement (d) = 7 nm). W is higher if the stiffness is higher near the beginning of the power stroke. Assuming actomyosin interactions performing work hydrolyze one ATP molecule, liberating 80–100 10−21 J (23) on average, these estimates of single molecule work capacity are closer to the 50–60% thermodynamic efficiency of intact muscle (61).
The isometric force produced by a skinned rabbit fiber at 20°C is ∼200 kN/m2 of cross sectional area (62). Vertebrate thick filaments contain ∼300 myosin heads on each side of the M-line, and there are ∼4.8 × 10¹⁴ filaments/m2 in skinned rabbit psoas fibers. These values give the average force per head as ∼1.4 pN in the rabbit fiber if all of the heads are attached within the half sarcomere and producing the same force throughout the cycle. A unitary force of 9.0 pN implies that ∼16% of the heads in muscle are attached and contributing to the force during isometric contraction, at the lower end of previous estimates (63–65).
Actomyosin kinetics
The change in the duration of events observed in the raw data and the event termination rates determined from the duration histograms are direct reflections of the change in the kinetics of actomyosin at differing dynamic loads. The event durations decreased as the dynamic load was increased (Figs. 4 a and 6 a), contrary to the results for smooth muscle myosin in which the release of ADP from the actomyosin-ADP complex was delayed at moderate load (18). The termination rate without feedback yields the second order rate constant for ATP binding of ∼4.7 × 10⁶ M−1s−1, similar to the value found for acto-S1 ATPase in solution (4.0 × 10⁶ M−1s−1) (66) in earlier single skeletal myosin molecule studies and skinned isometric fiber studies (3,5,6,10,20,25,67).
If each event requires binding of ATP at the end of the interaction to detach the myosin, the application of dynamic load would speed the binding of ATP. However, this interpretation contradicts the Fenn effect (26) and measurement of ATP hydrolysis in isometrically or eccentrically contracting muscles (21). An alternative interpretation is that under the influence of external force, myosin detachment from actin can be independent of ATP binding. Two possibilities are that after generation of force, myosin is forcibly detached from actin before the end of its enzymatic cycle and, second, that the actomyosin power stroke is reversed by the load and myosin then detaches at the beginning of its power stroke without performing net work.
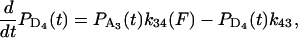
Kinetic modeling
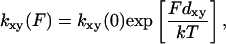
To analyze the duration and force histogram data further, histograms generated with several kinetic schemes were numerically modeled and compared to the data. The models were based on variations of a general scheme shown below. Two detached states (D1 and D4) and two attached force-producing states (A2 and A3) are considered. The first attached state (A2) is a short-lived intermediate and the second (A3) is a longer-lived state (at low [ATP]). The first detached state (D1) represents myosin that has completed the biochemical cycle with bound ATP or ADP and inorganic phosphate, and the second (D4) represents myosin that has been forcibly detached from actin and has ADP or no nucleotide bound. The two “lumped” force-producing states can be associated with the biochemical states of actomyosin and product release after ATP hydrolysis in several possible ways. Experiments performed to discriminate among these possibilities will be described in a forthcoming publication. Schemes with a single force-producing state did not fit the data as well as those with two force-producing states. The predominant mechanical cycle for unloaded events is D1, A2, A3, then back to D1. Since the event durations were dependent on dynamic load, one or more of the transition rates in the model depend on load (68). For example, the transition rate for forcible detachment from the long-lived state A3 under load, F, to the detached state, D4, is
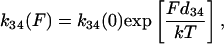 |
(4) |
where k34(0) is the detachment rate in the absence of load and d34 is the distance in the direction of the applied force between the minimum free energy of attached state A3 and the maximum free energy of the transition state between A3 and D4 (69).
The differential equations which express the changes in the probabilities of finding a cross-bridge in one of the states were used to model the data in two ways (discussed in detail in the Appendix). In the first, a time sequence of randomly occurring actomyosin events was generated with a Monte Carlo simulation (Fig. 7, a and b), using the model in the Appendix. The advantage of the Monte Carlo method is that it generates simulated data with Brownian noise that could be analyzed using the zero crossing method and directly compared with the analysis of the experimental data. In the second method of simulation, the differential equations were solved numerically to determine the probability distribution of events (Fig. 8, a and b). The direct solutions of the probability densities could be generated far faster than with the Monte Carlo method so that model parameters were iteratively optimized to best fit the experimental data. The models incorporated values of parameters such as the trap stiffness and the feedback time responses, with and without myosin attached as determined in the Results section. The variance of the Brownian motion of the bead-actin-bead assembly determined from the data recorded in the absence of interactions was 8 nm. It was assumed that myosin could bind to five monomers within a target zone along the filament with relative binding probabilities as described in Steffen et al. (70). The duration and force histograms were computed for each of the monomer positions and for a range of the relative actomyosin strains before attachment and then averaged. The rate constants, transition distances, power stroke, and actomyosin stiffness were globally adjusted (i.e., kept the same for all three feedback settings) so that the sum of the reduced  terms for the individual force and duration traces for both feedback time constants and no feedback was minimized using a conjugant gradient algorithm in MathCad (MathSoft Engineering and Education, Cambridge, MA).
FIGURE 7.

Theoretical Markov simulation of unitary actomyosin interactions under varying dynamic loads. (a) 2.5 s of simulated events and (b) typical single simulated events. A time sequence of randomly occurring actomyosin events under varying dynamic load was generated with a Monte Carlo simulation using the model in the Appendix and was plotted as in Fig. 4. Similarly, forces on motor beads (dark colors) and the transducer beads (lighter colors) during actomyosin interactions simulated with the feedback gain of the isometric clamp at τf = 1 ms (blue), τf = 10 ms (red), and with the feedback turned off (green). The forces on beads for individual interactions were extracted from panel a and shown on an expanded timescale.
FIGURE 8.

Simulated (a) duration and (b) peak force distributions at two different feedback gains and no feedback using load-dependent k21 and k23. The differential equations included in the Appendix were solved numerically to determine the probability distribution of events for a load-dependent model.
Models were also tested in which either none of the transition rates, single transition rates from among k21, k23, k32, k31, and k34, or combinations of the transition rates were allowed to depend on load. The best global agreement to the peak force and duration histograms at both high and moderate feedback gain was found with both rates k21 and k23 dependent on load (Fig. 8 and Table 1). The next best fits were obtained with model variants in which either the rate k34 or k21 depended on load. A model in which both rates k34 and k21 depend on load did not improve the fits over that with only k21 dependent on load. The fit parameters for different models and the sum of  for these models are listed in Table 1. These results suggest that reversal of the power stroke is the predominant load-dependent step in the muscle cross-bridge cycle at high forces and that the application of load slows down the transition into the later states of the actomyosin ATPase cycle. However since kinetic schemes that include forced detachment fit the data with reasonable fidelity, this mechanism may also play a role in determining the actomyosin interaction kinetics.
TABLE 1.
Best fit parameters for load-independent and -dependent models
| Scheme | k21 s−1 | k23 s−1 | k31 s−1 | k34 s−1 | Power stroke, d (nm) | Stiffness,κ (pN/nm) | Σχ2 |
|---|---|---|---|---|---|---|---|
| Load-independent rates | 145.2 | 10.79 | 40.51 | 0 | 5.17 | 0.60 | 30.47 |
| k23 dependent on load | 119.1 | 13.23 e(−0.71F(pN)) | 33.51 | 0 | 6.67 | 0.62 | 23.91 |
| k34 dependent on load | 123.0 | 6.63 | 29.06 | 1.036e(0.57F(pN)) | 5.67 | 0.68 | 21.80 |
| k21 dependent on load | 52.41e(0.18F(pN)) | 0.26 | 10.73 | 0 | 8.31 | 0.74 | 22.03 |
| k21 and k23 dependent on load | 51.87e(0.22F(pN)) | 4.27e(−0.81F(pN)) | 23.64 | 0 | 9.17 | 0.75 | 17.53 |
A kinetic model with no load-dependent rate constants predicts that the durations of the events at high (τf = 1 ms) and moderate (τf = 10 ms) dynamic loads are equal but the peak forces differ by 10-fold. The measured peak forces for the high and moderate loads do not differ that much (twofold difference). Permitting k21 to be load dependent improves the fitting because at high dynamic load (fast feedback), the predominant force-bearing state (short-lived A2) is early in the working stroke, but at moderate load, the reaction tends to progress farther to the longer-lived state A3. Dependence of k21 on load reduces the peak force in state A2, thus bringing the simulated forces at moderate and high feedback closer together, as observed. The load dependency of k21 can be interpreted as an increased rate of reversal of force production and detachment under high load without utilization of ATP. The load dependency of k23 can be interpreted as a mechanism to populate the earlier parts of the actomyosin ATPase cycle, rather than the latter, such that the reversal of force production could occur frequently. This reversal of work would be an effective method for muscle to increase its energy efficiency during isometric contraction and contribute to the Fenn effect.
Comparison to other studies
The force (load) and strain on individual actomyosin heads can be changed by several means: passively or actively changing trap stiffness (5,12); taking advantage of the natural variability of attachment due to Brownian motion before the interaction (17); moving the stage (or the traps) before or after an interaction (18); or as here, by positioning a trap under servo control (3,19,37). The advantage of the method here is that the load is automatically adjusted to restore the position of the actomyosin to the beginning of its power stroke, mimicking an isometric contraction in muscle. However, the load is not applied instantaneously. By altering the gain of the feedback, we can probe the active actomyosin interaction during different stages of the actomyosin cycle. At the higher dynamic load, the actomyosin spends ∼10 ms near the end of its power stroke before it is pulled back toward the beginning, whereas at moderate load the actomyosin spends ∼100 ms near the end of its power stroke; thus transitions that preferentially take place near the end of the power stroke are more likely to occur under moderate dynamic load than at higher feedback, and transitions that preferentially take place at the beginning of the power stroke are more likely to occur at higher dynamic load. The isometric clamp thus allows probing of the strain- and load-dependent kinetics of the enzymatic cycle of motor proteins while at the same time increasing the effective stiffness of the trap.
If the myosin power stroke is rapid compared to the dynamics of the feedback loop, as is the case with skeletal myosin II used here, then most of the stroke takes place before the feedback loop responds and the optical traps pull the actin back toward its original position. This suggests that the traps are doing the work rather than the myosin. But the feedback never pulls the actin back farther than its original position and, assuming that an individual interaction is maintained during the restoration of position, then the final position of the actin and the structural state of the myosin will be the same as if the myosin generated its impulse on to an immovable actin. Thus the work done on compliances (either internal ones, e.g., subfragment 2, or external, e.g., attachment to the substrate) is the same as myosin would do in the isometric situation.
We conclude that the single myosin molecules transduce energy nearly as efficiently as whole muscle and that the control of ATPase activity by the mechanical load on a single myosin tunes its efficiency specific to its immediate task.
SUPPLEMENTARY MATERIAL
An online supplement to this article can be found by visiting BJ Online at http://www.biophysj.org.
Supplementary Material
Acknowledgments
We thank the members of the Goldman and Shuman laboratories, as well as the P.M.I., especially Dr. E. M. Ostap for discussions, Dr. D. Safer for actin purification and labeling, and Dr. E. M. De La Cruz for suggestions on F-actin polymerization and handling.
This work was supported by grants from the National Institutes of Health.
APPENDIX
Model for isometric clamp feedback loop
The equations describing the motion of a bead-actin-bead assembly held in two traps were modified from Veigel et al. (25) to include the movement of the motor trap under the control of an integral gain feedback loop.
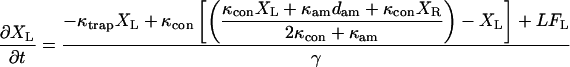 |
(A1) |
 |
(A2) |
 |
(A3) |
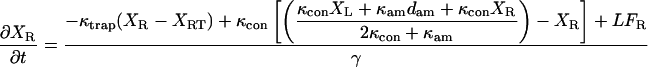
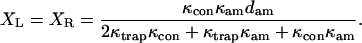
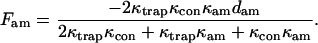
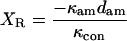
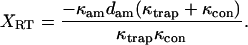
where XL is the position of the transducer (left) bead, XR is the position of the motor (right) bead, XRT is the position of the motor (right) trap, the position of the left trap is zero, κtrap is the stiffness of each trap, κcon is the actin to bead connection stiffness, κam is the actomyosin stiffness, dam is the power stroke of the actomyosin, LFL and LFR are random Langevin forces that lead to the Brownian motion, γ is the viscous drag for each bead, and fI is the unity gain frequency for integral gain of the feedback loop. Initially, before attachment, the beads and traps positions are on average
 |
(A4) |
After myosin attachment and completion of the power stroke, the two beads move rapidly in the absence of feedback or before the feedback loop has time to act to new positions expressed as
 |
(A5) |
The force imposed on the actomyosin by the static traps is
 |
(A6) |
After the feedback loop acts and settles to its steady-state position, the bead and right-hand (motor) trap positions are
 |
(A7) |
 |
(A8) |
 |
(A9) |
The forces on the right-hand (motor) bead and on actomyosin are
 |
(A10) |
The forces on the myosin and the beads settle after the power stroke with a single exponential time constant as long as all the mechanical elements are independent of load,
 |
(A11) |
The force borne by the actomyosin is approximately
 |
(A12) |
where g is the smallest eigenvalue of Eqs. A1–A3.
For κtrap = 0.07 pN/nm, κcon ≥ 1 pN/nm, κam = 1.1 pN/nm, dam = 7 nm, γ = 1 × 10⁻⁵ pN s/nm, and fI = 1300/s, the settling rate is g = 69/s with bound actomyosin and g = 690/s in the absence of an attachment in agreement with the rates measured in Fig. 6.
In this model, we assume that when myosin generates force under load it deforms an internal series elastic component with stiffness κam, i.e., by either stretching S2 or bending the lever arm. Other compliant elements such as those that may arise from the myosin-nitrocellulose linkage that are in series with the myosin head would reduce the measured stiffness. Our measurements of unitary actomyosin stiffness, step size, isometric force, and work are likely underestimates of their true values.
Kinetic model for duration of actomyosin events
The equations governing the time dependence of probabilities for finding the actomyosin in each of the states in Scheme 1 are
 |
(A13) |
 |
(A14) |
 |
(A15) |
 |
(A16) |
where any or all of k21 k23, k32, k31, and k34 might depend on the force, F, acting on the actomyosin. The explicit form for force dependence is
 |
(A17) |
where dxy is a characteristic distance.
SCHEME 1.

Minimal kinetic scheme for numerical model. The models were based on variations of a general scheme with detached states (D1 and D4) and two attached force-producing states (A2 and A3), whereby the first attached state, A2, is a short-lived intermediate and the sequential state, A3, is a longer-lived state, for example at low [ATP].
Mathematical approximation of the event distribution
To estimate the event distributions at differing mechanical parameters, feedback gains, and strain-dependent transition rates, the sets of equations governing the feedback loop and actomyosin must be solved simultaneously. Two methods were used to derive force and duration histograms from Eqs. A1–A3 and A13–A16.
Monte Carlo simulation
The first, a Monte Carlo method, calculates the discrete time sequence of forces and actomyosin states directly from a numerical solution of the stochastic differential equations. The time sequence of events was then analyzed with the zero crossing routine used for data analysis. The stochastic differential equations were transformed to an intrinsic form of difference equations (71) and solved numerically for a sequence of time points, ti . The values of the Langevin forces, LF, acting on the beads were determined at each time point, ti, from two independent Gaussian distributed pseudorandom number generators each with zero mean and variance that is determined from γ, the Stokes drag coefficient of the bead. The time points at which the actomyosin bound and changed states were determined by comparing the probabilities of transitions between states, (ti+1 – ti)kxy(F(ti)) to a random number uniformly distributed between 0 and 1, generated at each time point. The stochastic model to simulate individual events was programmed using a LabVIEW 5.1 (National Instruments, Austin, TX) environment.
The solutions to differential equations A1–A3 and A13–A16 for κtrap = 0.06 pN/nm, κcon = 0.4 pN/nm, κam = 0.75 pN/nm, dam = 9.2 nm, γ = 1 × 10⁻⁵ pN s/nm, and three feedback gains fI = 1300/s, 130/s, and 0/s are shown in Fig. 7 and compared with experimental data (Fig. 4).
Numerical probability distribution
In the second method the probability density for the durations of events is determined by directly solving the differential equations Eqs. A13–A16 modified to exclude transitions from unattached (D) to attached force-producing states (A) for the sum  +
+  with initial probabilities
 ,
,  = 1, and
  = 0. This assumes that the beginning of an event corresponds to the binding of actin to myosin in A2 and ends when myosin detaches from either A2 or A3. The probabilities incorporating duration and the load-dependent transition rates are given by
 |
(A18) |
 |
(A19) |
where the load borne by the actomyosin changes with time as described in Eqs. A12 and A20. The transition rates, kxy, are the unloaded transition rates (units = s−1). δxy (units = pN−1) = dxy/kT and express the load- (or strain-)dependent change in transition rates. To make the model more realistic, it also incorporates the probabilities that myosin attaches randomly to the actin filament at target sites spaced at 5.5-nm repeat distance (70). The time-dependent force borne by the actomyosin is
 |
(A20) |
where B is a random variable that incorporates the distance along the filament between the myosin and its binding site. The probability distributions,  and
and  , are solved with the differential equation solver Stiffr of Mathcad 2001 Professional (Mathsoft Engineering and Education) for each value of the relative actin and myosin position, B. The total probability for finding bound actomyosin after time t, P(t), is computed from a weighted sum of
  +
+  over the distribution of B. The force histogram is obtained from the duration histogram since the force is dependent on duration.
Yasuharu Takagi's present address is Laboratory of Molecular Physiology, National Heart, Lung and Blood Institute, National Institutes of Health, Bldg. 10, Rm. 202, Bethesda, MD 20892-1762.
References
- 1.Knight, A. E., C. Veigel, C. Chambers, and J. E. Molloy. 2001. Analysis of single-molecule mechanical recordings: application to acto-myosin interactions. Prog. Biophys. Mol. Biol. 77:45–72. [DOI] [PubMed] [Google Scholar]
- 2.Tyska, M. J., and D. M. Warshaw. 2002. The myosin power stroke. Cell Motil. Cytoskeleton. 51:1–15. [DOI] [PubMed] [Google Scholar]
- 3.Finer, J. T., R. M. Simmons, and J. A. Spudich. 1994. Single myosin molecule mechanics: piconewton forces and nanometre steps. Nature. 386:113–119. [DOI] [PubMed] [Google Scholar]
- 4.Molloy, J. E., J. E. Burns, J. Kendrick-Jones, R. T. Tregear, and D. C. S. White. 1995. Movement and force produced by single myosin head. Nature. 378:209–212. [DOI] [PubMed] [Google Scholar]
- 5.Guilford, W. H., D. E. Dupuis, G. Kennedy, J. Wu, J. B. Patlak, and D. M. Warshaw. 1997. Smooth muscle and skeletal muscle myosins produce similar forces and displacements in the laser trap. Biophys. J. 72:1006–1021. [DOI] [PMC free article] [PubMed] [Google Scholar]
- 6.Ishijima, A., H. Kojima, T. Funatsu, M. Tokunaga, H. Higuchi, H. Tanaka, and T. Yanagida. 1998. Simultaneous observation of individual ATPase and mechanical events by a single myosin molecule during interaction with actin. Cell. 92:161–171. [DOI] [PubMed] [Google Scholar]
- 7.Tanaka, H., A. Ishijima, M. Honda, K. Saito, and T. Yanagida. 1998. Orientation dependence of displacements by a single one-headed myosin relative to the actin filament. Biophys. J. 75:1886–1894. [DOI] [PMC free article] [PubMed] [Google Scholar]
- 8.Baker, J. E., C. Brosseau, P. B. Joel, and D. M. Warshaw. 2002. The biochemical kinetics underlying actin movement generated by one and many skeletal muscle myosin molecules. Biophys. J. 82:2134–2147. [DOI] [PMC free article] [PubMed] [Google Scholar]
- 9.Lauzon, A.-M., M. J. Tyska, A. S. Rovner, Y. Freyzon, D. M. Warshaw, and K. M. Trybus. 1998. A 7-amino-acid insert in the heavy chain nucleotide binding loop alters the kinetics of smooth muscle myosin in the laser trap. J. Muscle Res. Cell Motil. 19:825–837. [DOI] [PubMed] [Google Scholar]
- 10.Tyska, M. J., D. E. Dupuis, W. H. Guilford, J. B. Patlak, G. S. Waller, K. M. Trybus, D. M. Warshaw, and S. Lowey. 1999. Two heads of myosin are better than one for generating force and motion. Proc. Natl. Acad. Sci. USA. 96:4402–4407. [DOI] [PMC free article] [PubMed] [Google Scholar]
- 11.Molloy, J. E., J. Kendrick-Jones, C. Veigel, and R. T. Tregear. 2000. An unexpectedly large working stroke from chymotryptic fragments of myosin II. FEBS Lett. 480:293–297. [DOI] [PubMed] [Google Scholar]
- 12.Warshaw, D. M., W. H. Guilford, Y. Freyzon, E. Krementsova, K. A. Palmiter, M. J. Tyska, J. E. Baker, and K. M. Trybus. 2000. The light chain binding domain of expressed smooth muscle heavy meromyosin acts as a mechanical lever. J. Biol. Chem. 275:37167–37172. [DOI] [PubMed] [Google Scholar]
- 13.Purcell, T. J., C. Morris, J. A. Spudich, and H. L. Sweeney. 2002. Role of the lever arm in the processive stepping of myosin V. Proc. Natl. Acad. Sci. USA. 99:14159–14164. [DOI] [PMC free article] [PubMed] [Google Scholar]
- 14.Sakamoto, T., F. Wang, S. Schmitz, Y. Xu, Q. Xu, J. E. Molloy, C. Veigel, and J. R. Sellers. 2003. Neck length and processivity of myosin V. J. Biol. Chem. 278:29201–29207. [DOI] [PubMed] [Google Scholar]
- 15.Mehta, A. D., R. S. Rock, M. Rief, J. A. Spudich, M. S. Mooseker, and R. E. Cheney. 1999. Myosin-V is a processive actin-based motor. Nature. 400:590–593. [DOI] [PubMed] [Google Scholar]
- 16.Rief, M., R. S. Rock, A. D. Mehta, M. S. Mooseker, R. E. Cheney, and J. A. Spudich. 2000. Myosin-V stepping kinetics: a molecular model for processivity. Proc. Natl. Acad. Sci. USA. 97:9482–9486. [DOI] [PMC free article] [PubMed] [Google Scholar]
- 17.Veigel, C., F. Wang, M. L. Bartoo, J. R. Sellers, and J. E. Molloy. 2002. The gated gait of the processive molecular motor, myosin V. Nat. Cell Biol. 4:59–65. [DOI] [PubMed] [Google Scholar]
- 18.Veigel, C., J. E. Molloy, S. Schmitz, and J. Kendrick-Jones. 2003. Load-dependent kinetics of force production by smooth muscle myosin measured with optical tweezers. Nat. Cell Biol. 5:980–986. [DOI] [PubMed] [Google Scholar]
- 19.Finer, J. T., A. D. Mehta, and J. A. Spudich. 1995. Characterization of single actin-myosin interactions. Biophys. J. 68:291S–296S. [PMC free article] [PubMed] [Google Scholar]
- 20.Molloy, J. E., J. E. Burns, J. C. Sparrow, R. T. Tregear, J. Kendrick-Jones, and D. C. S. White. 1995. Single-molecule mechanics of heavy meromyosin and S1 interacting with rabbit or Drosophila actins using optical tweezers. Biophys. J. 68:298S–303S. [PMC free article] [PubMed] [Google Scholar]
- 21.Woledge, R. C., N. A. Curtin, and E. Homsher. 1985. Energetic aspects of muscle contraction. Monogr. Physiol. Soc. 41:1–357. [PubMed] [Google Scholar]
- 22.Cooke, R. 1997. Actomyosin interaction in striated muscle. Physiol. Rev. 77:671–697. [DOI] [PubMed] [Google Scholar]
- 23.Howard, J. 2001. Mechanics of Motor Proteins and the Cytoskeleton. Sinauer Associates, Sunderland, MA.
- 24.Dupuis, D. E., W. H. Guilford, J. Wu, and D. M. Warshaw. 1997. Actin filament mechanics in the laser trap. J. Muscle Res. Cell Motil. 18:17–30. [DOI] [PubMed] [Google Scholar]
- 25.Veigel, C., M. L. Bartoo, D. C. S. White, J. C. Sparrow, and J. E. Molloy. 1998. The stiffness of rabbit skeletal actomyosin cross-bridges determined with an optical tweezers transducer. Biophys. J. 75:1424–1438. [DOI] [PMC free article] [PubMed] [Google Scholar]
- 26.Fenn, W. O. 1923. A quantitative comparison between the energy liberated and the work performed by the isolated sartorius muscle of the frog. J. Physiol. (Lond.). 58:175–203. [DOI] [PMC free article] [PubMed] [Google Scholar]
- 27.Huxley, A. F. 1957. Muscle structure and theories of contraction. Prog. Biophys. Biophys. Chem. 7:255–318. [PubMed] [Google Scholar]
- 28.De La Cruz, E. M., A. L. Wells, S. S. Rosenfeld, E. M. Ostap, and H. L. Sweeney. 1999. The kinetic mechanism of myosin V. Proc. Natl. Acad. Sci. USA. 96:13726–13731. [DOI] [PMC free article] [PubMed] [Google Scholar]
- 29.Veigel, C., L. M. Coluccio, J. D. Jontes, J. C. Sparrow, R. A. Milligan, and J. E. Molloy. 1999. The motor protein myosin-I produces its working stroke in two steps. Nature. 398:530–533. [DOI] [PubMed] [Google Scholar]
- 30.Nyitrai, M., and M. A. Geeves. 2004. Adenosine diphosphate and strain sensitivity in myosin motors. Philos. Trans. R. Soc. Lond. B Biol. Sci. 359:1867–1877. [DOI] [PMC free article] [PubMed] [Google Scholar]
- 31.Uyeda, T. Q. P., S. J. Kron, and J. A. Spudich. 1990. Myosin step size. Estimation from slow sliding movement of actin over low densities of heavy meromyosin. J. Mol. Biol. 214:699–710. [DOI] [PubMed] [Google Scholar]
- 32.Harris, D. E., and D. M. Warshaw. 1993. Smooth and skeletal muscle myosin both exhibit low duty cycles at zero load in vitro. J. Biol. Chem. 268:14764–14768. [PubMed] [Google Scholar]
- 33.Hopkins, S. C., C. Sabido-David, J. E. T. Corrie, M. Irving, and Y. E. Goldman. 1998. Fluorescence polarization transients from rhodamine isomers on the myosin regulatory light chain in skeletal muscle fibers. Biophys. J. 74:3093–3110. [DOI] [PMC free article] [PubMed] [Google Scholar]
- 34.De La Cruz, E. M., and E. M. Ostap. 2004. Relating biochemistry and function in the myosin superfamily. Curr. Opin. Cell Biol. 16:61–67. [DOI] [PubMed] [Google Scholar]
- 35.Dantzig, J. A., M. G. Hibberd, D. R. Trentham, and Y. E. Goldman. 1991. Cross-bridge kinetics in the presence of MgADP investigated by photolysis of caged ATP in rabbit psoas muscle fibres. J. Physiol. 432:639–680. [DOI] [PMC free article] [PubMed] [Google Scholar]
- 36.Gollub, J., C. R. Cremo, and R. Cooke. 1996. ADP release produces a rotation of the neck region of smooth myosin but not skeletal myosin. Nat. Struct. Biol. 3:796–802. [DOI] [PubMed] [Google Scholar]
- 37.Takagi, Y., Y. E. Goldman, and H. Shuman. 2000. Single molecule force of myosin II measured with a novel optical trap system that eliminates linkage compliance. Biophys. J. 78:235a. (Abstr.). [Google Scholar]
- 38.Takagi, Y., E. E. Homsher, Y. E. Goldman, and H. Shuman. 2001. Analysis of isometric force measurements of myosin II using a modified mean-variance analysis. Biophys. J. 80:78a. (Abstr.). [Google Scholar]
- 39.Takagi, Y., E. E. Homsher, Y. E. Goldman, and H. Shuman. 2002. Probing the transduction mechanism of rabbit skeletal myosin II under isometric condition using an optical trap. Biophys. J. 82:373a. (Abstr.). [Google Scholar]
- 40.Takagi, Y., Y. E. Goldman, and H. Shuman. 2003. Mechanics of rabbit skeletal actomyosin in an isometric force clamp near rigor. Biophys. J. 84:247a. (Abstr.). [Google Scholar]
- 41.Takagi, Y., E. E. Homsher, Y. E. Goldman, and H. Shuman. 2004. ATP and phosphate dependence of single rabbit skeletal actomyosin interactions under differing loads. Biophys. J. 86:54a. (Abstr.). [Google Scholar]
- 42.Takagi, Y., Y. E. Goldman, and H. Shuman. 2005. A Markov process model to predict the mechanics and kinetics of single rabbit skeletal isometric actomyosin interactions. Biophys. J. 88:634a. (Abstr.). [Google Scholar]
- 43.Visscher, K., S. P. Gross, and S. M. Block. 1996. Construction of multiple-beam optical traps with nanometer-resolution position sensing. IEEE J. Select. Topics Quant. Electr. 2:1066–1076. [Google Scholar]
- 44.Smith, S. B., Y. Cui, and C. Bustamante. 1996. Overstretching B-DNA: the elastic response of individual double-stranded and single-stranded DNA molecules. Science. 271:795–799. [DOI] [PubMed] [Google Scholar]
- 45.Block, S. M., L. S. Goldstein, and B. J. Schnapp. 1990. Bead movement by single kinesin molecules studied with optical tweezers. Nature. 348:348–352. [DOI] [PubMed] [Google Scholar]
- 46.Gittes, F., and C. F. Schmidt. 1998. Signals and noise in micromechanical measurements. Methods Cell Biol. 55:129–156. [DOI] [PubMed] [Google Scholar]
- 47.Allersma, M. W., F. Gittes, M. J. deCastro, R. J. Stewart, and C. F. Schmidt. 1998. Two-dimensional tracking of ncd motility by back focal plane interferometry. Biophys. J. 74:1074–1085. [DOI] [PMC free article] [PubMed] [Google Scholar]
- 48.Simmons, R. M., J. T. Finer, S. Chu, and J. A. Spudich. 1996. Quantitative measurements of forces and displacement using an optical trap. Biophys. J. 70:1813–1822. [DOI] [PMC free article] [PubMed] [Google Scholar]
- 49.Margossian, S. S., and S. Lowey. 1982. Preparation of myosin and its subfragments from rabbit skeletal muscle. Methods Enzymol. 85:55–71. [DOI] [PubMed] [Google Scholar]
- 50.Harada, Y., K. Sakurada, T. Aoki, D. D. Thomas, and T. Yanagida. 1990. Mechanochemical coupling in actomyosin energy transduction studied by in vitro movement assay. J. Mol. Biol. 216:49–68. [DOI] [PubMed] [Google Scholar]
- 51.Pardee, J. D., and J. A. Spudich. 1982. Purification of muscle actin. Methods Cell Biol. 24:271–289. [DOI] [PubMed] [Google Scholar]
- 52.MacLean-Fletcher, S., and T. D. Pollard. 1980. Identification of a factor in conventional muscle actin preparations which inhibits actin filament self-association. Biochem. Biophys. Res. Commun. 96:18–27. [DOI] [PubMed] [Google Scholar]
- 53.Rock, R. S., M. Rief, A. D. Mehta, and J. A. Spudich. 2000. In vitro assays of processive myosin motors. Methods. 22:373–381. [DOI] [PubMed] [Google Scholar]
- 54.Svoboda, K., and S. M. Block. 1994. Biological applications of optical forces. Annu. Rev. Biophys. Biomol. Struct. 23:247–285. [DOI] [PubMed] [Google Scholar]
- 55.Mehta, A. D., J. T. Finer, and J. A. Spudich. 1997. Detection of single-molecule interactions using correlated thermal diffusion. Proc. Natl. Acad. Sci. USA. 94:7927–7931. [DOI] [PMC free article] [PubMed] [Google Scholar]
- 56.Piazzesi, G., L. Lucii, and V. Lombardi. 2002. The size and the speed of the working stroke of muscle myosin and its dependence on the force. J. Physiol. 545:145–151. [DOI] [PMC free article] [PubMed] [Google Scholar]
- 57.Nishizaka, T., H. Miyata, H. Yoshikawa, S. Ishiwata, and K. Kinosita Jr. 1995. Unbinding force of a single motor molecule of muscle measured using optical tweezers. Nature. 377:251–254. [DOI] [PubMed] [Google Scholar]
- 58.Nishizaka, T., R. Seo, H. Tadakuma, K. Kinosita Jr., and S. Ishiwata. 2000. Characterization of single actomyosin rigor bonds: load dependence of lifetime and mechanical properties. Biophys. J. 79:962–974. [DOI] [PMC free article] [PubMed] [Google Scholar]
- 59.Huxley, A. F., and S. Tideswell. 1996. Filament compliance and tension transients in muscle. J. Muscle Res. Cell Motil. 17:507–511. [DOI] [PubMed] [Google Scholar]
- 60.Barclay, C. J. 1998. Estimation of cross-bridge stiffness from maximum thermodynamic efficiency. J. Muscle Res. Cell Motil. 19:855–864. [DOI] [PubMed] [Google Scholar]
- 61.Kushmerick, M. J., and R. E. Davies. 1969. The chemical energetics of muscle contraction. II. The chemistry, efficiency and power of maximally working sartorius muscles. Proc. R. Soc. Lond. B. Biol. Sci. 174:315–353. [DOI] [PubMed] [Google Scholar]
- 62.Hibberd, M. G., J. A. Dantzig, D. R. Trentham, and Y. E. Goldman. 1985. Phosphate release and force generation in skeletal muscle fibers. Science. 228:1317–1319. [DOI] [PubMed] [Google Scholar]
- 63.Matsubara, I., and G. F. Elliott. 1972. X-ray diffraction studies on skinned single fibres of frog skeletal muscle. J. Mol. Biol. 72:657–669. [DOI] [PubMed] [Google Scholar]
- 64.Cooke, R., M. S. Crowder, and D. D. Thomas. 1982. Orientation of spin labels attached to cross-bridges in contracting muscle fibres. Nature. 300:776–778. [DOI] [PubMed] [Google Scholar]
- 65.Huxley, A. F. 2000. Cross-bridge action: present views, prospects, and unknowns. J. Biomech. 33:1189–1195. [DOI] [PubMed] [Google Scholar]
- 66.White, H. D., and E. W. Taylor. 1976. Energetics and mechanism of actomyosin adenosine triphosphatase. Biochemistry. 15:5818–5826. [DOI] [PubMed] [Google Scholar]
- 67.Goldman, Y. E. 1987. Kinetics of the actomyosin ATPase in muscle fibers. Annu. Rev. Physiol. 49:637–654. [DOI] [PubMed] [Google Scholar]
- 68.Bell, G. I. 1978. Models for the specific adhesion of cells to cells. Science. 200:618–627. [DOI] [PubMed] [Google Scholar]
- 69.Eisenberg, E., T. L. Hill, and Y. Chen. 1980. Cross-bridge model of muscle contraction. Quantitative analysis. Biophys. J. 29:195–227. [DOI] [PMC free article] [PubMed] [Google Scholar]
- 70.Steffen, W., D. Smith, R. Simmons, and J. Sleep. 2001. Mapping the actin filament with myosin. Proc. Natl. Acad. Sci. USA. 98:14949–14954. [DOI] [PMC free article] [PubMed] [Google Scholar]
- 71.Press, W. H., S. A. Teukolsky, W. T. Vetterling, and B. P. Flannery. 1992. Numerical Recipes in C: The Art of Scientific Computing, 2nd Ed. Cambridge University Press, New York.
Associated Data
This section collects any data citations, data availability statements, or supplementary materials included in this article.