Abstract
We describe a novel procedure for generating and optimizing pattern descriptors that can be used to find structural motifs in DNA or RNA sequences. This combines a pattern-description language (based primarily on secondary structure alignment and conservation of some key nucleotides) with a scoring function that relies heavily on estimated folding free energies for the secondary structure of interest. For the cloverleaf secondary structure characteristic of tRNA, we show that a fairly simple pattern descriptor can find almost all known tRNA genes in both bacterial and eukaryotic genomes, and that false positives (sequences that match the pattern but that are probably not tRNAs) can be recognized by their high estimated folding free energies. A general procedure for optimizing descriptors (and hence for finding new structural motifs) is also described. For six bacterial, four eukaryotic, and four archaea genome sequences, our results compare favorably with those of the more complex and specialized tRNAscan-SE algorithm. Prospects for using this general approach to find other RNA structural motifs are discussed.
Keywords: Nearest neighbor energy, secondary structure, introns
INTRODUCTION
The art and science of drawing connections between sequence and structure tend to be very different for RNA from what they are for proteins. There are several reasons for this. First, the presence of a 20-letter “alphabet” for protein sequences means that frequency counts or simple pattern matching can often be a useful strategy for identifying secondary structure or searching for similarities among sequences; these strategies are much less useful with the four-letter alphabet of nucleic acids. Second, there are many more proteins than RNA fragments whose structure has been determined, so that much more is known about sequence–structure relations. Even at the secondary structure level, it is most often the case that RNA hydrogen-bond (base-pairing) patterns have to be inferred from analysis of sequence covariation among related members of some family, rather then being observed directly in crystal or NMR structures, as is often the case in proteins.
Nevertheless, interest in identifying structural similarities in RNA from sequence is strong, and there are an increasing number of cases in which enough is known to make at least secondary structure identification a plausible goal. The approach taken here involves encoding secondary structure patterns into a “profile” or “motif,” and searching through genome databases to find sequences that have the capability of adopting the given secondary structure pattern. This is the analog of the protein “threading” or “inverse folding” problem, in which sequences are checked for compatibility with a given, known fold (Mirny et al. 2000; Panchenko et al. 2000; Skolnick et al. 2001). The simplest level of “compatibility” for RNA is just to require complementary (e.g., Watson-Crick) base pairs in the duplex regions of a secondary structure model. This model, however, would be overwhelmed by false positives in a genome-wide search for all but the most complex secondary structures, and it assumes that any mismatch within a stem region is fatal.
More than a decade ago, Gautheret and coworkers created rnamot, a program to allow sequence searches to be carried out against a descriptor that combines secondary structure information with simple pattern matching for conserved nucleotides (Gautheret et al. 1990; Laferrire et al. 1994). Macke et al. (2001) later extended this idea in the program RNAMotif, which provides an expanded syntax for describing motifs, along with an implementation of nearest-neighbor rules and other schemes for ranking hits (Mathews et al. 1999; Zuker et al. 1999; Zuker 2000). The RNAMotif program is very useful in finding instances of a pattern in a genome sequence, but a general procedure for creating and optimizing profiles has not been available. In practice, larger RNA motifs (>100–200 nt) are typically identified by straightforward sequence similarity searches, and smaller motifs by specialized models that are trained on known examples (Durbin et al. 1998). It has proved difficult to design “physical” and understandable profiles that find structural motifs without simultaneously matching large numbers of false positives; and in the absence of large numbers of RNA crystal structures, it has been even more difficult to know what to look for in the first place. Here we describe an approach to both of these problems, showing that existing estimates of folding free energies are in fact very useful as threading potentials, and presenting a heuristic for generating threading motifs starting from just a few examples. To illustrate this, we show how a nearly complete catalog of tRNA genes can be extracted from the genome sequences of 14 organisms, starting just from generalizations assembled 25 years ago about the cloverleaf secondary structure of bacterial tRNAs.
Transfer RNAs form an interesting, but somewhat unusual, set of structures (Wolin and Matera 1999). They form a structural and functional family that is present in many copies (up to 500 in higher organisms), and much is known about them (Hani and Feldmann 1998; Marck and Grosjean 2002). Detailed algorithms have been created and trained on known sets of tRNA sequences that provide a putatively complete catalog of tRNA genes. The most advanced of these is called tRNAscan-SE (Lowe and Eddy 1997), which combines three separate algorithms: (1) tRNAscan (Fichant and Burks 1991) uses base-pairing rules; (2) the Pavesi algorithm (Pavesi et al. 1994) searches for linear sequence signals in the form of eukaryotic RNA polymerase III promoters and terminators; and (3) covariance models use stochastic context-free grammars from multiple sequence alignments (Eddy and Durbin 1994). The presence of introns, of course, complicates the search for tRNA genes (as for other genes), but it appears that the location and nature of introns in tRNA genes are very limited, and they are handled in this work in an ad hoc fashion (described below) that may be difficult to extend to more complex problems. Nevertheless, the availability of a known catalog of tRNA genes for a variety of organisms (see http://rna.wustl.edu/GtRDB) allows us to test alternative methods by which such information might be found.
RESULTS
General descriptor
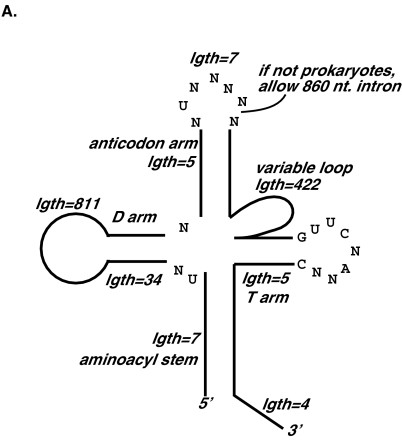
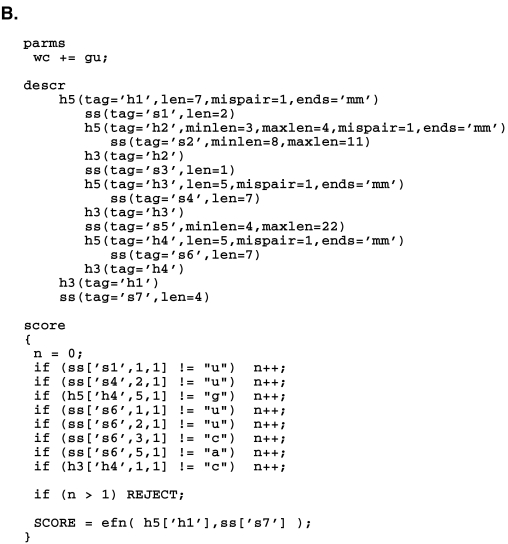
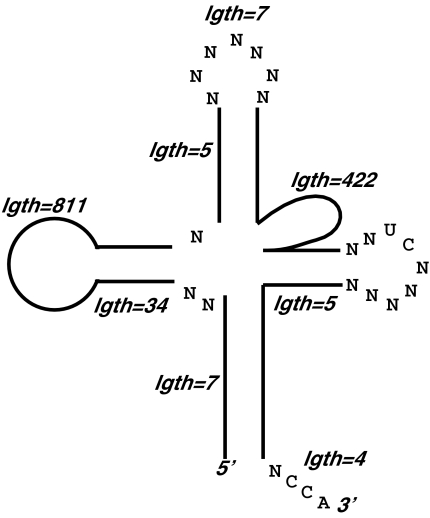
Figure 1 ▶ shows an RNAMotif descriptor that was applied to all the genomes studied. (Our procedure for constructing this descriptor is described below.) The cloverleaf-like secondary structure, including the required lengths of various stems and loops, is depicted in Figure 1A ▶. Figure 1A ▶ also shows eight of the conserved nucleotides used in the descriptor, and one mismatch of these nucleotides in each sequence was allowed. Furthermore, a mispair in each stem was allowed. In eukaryotic and archaea genomes, an intron of 8–60 nt was allowed between the sixth and seventh nucleotides of the anticodon loop, similar to the structural requirement in the original tRNAscan program (Fichant and Burks 1991). Figure 1B ▶ shows the actual RNAMotif descriptor in text format used to describe this particular structure (without the intron).
FIGURE 1.
RNAMotif descriptor used to search for potential tRNA genes in bacterial, eukaryotic, and archaea genomes in graphic form (A) and in text form (B).
This general descriptor was not systematically optimized to provide the most correct hits or lowest false-positive rates across various organisms. In fact, more specific rules for mispairs, sequence conservation, and lengths of regions could conceivably be included to provide better statistics. However, this simple descriptor provides a straightforward depiction of the structural motif we are looking for, and serves to illustrate the use of nearest-neighbor energies as an additional scoring function, as is discussed below.
Applications to bacteria
The results of RNAMotif searches for sequences in the bacterial genomes that matched the general descriptor in Figure 1 ▶ are summarized in Table 1 ▶, including comparisons to results using tRNAscan-SE. Overall, 99.3% of the potential tRNA genes coding for standard amino acids found by tRNAscan-SE were also found by RNAMotif. Those that were missed by RNAMotif had multiple mispairs or bulges in a stem.
TABLE 1.
RNAMotif results for bacterial genomes
| Organism | No. std tRNAa | No. psdgb | No. SeCc | No. undetd | No. false pos. w/ introne | No. false pos. w/o intronf |
| E. coli K-12 | 85/86 | 0/1 | 1/1 | 0/0 | N/A | 15 |
| E. coli O157:H7 | 95/95 | 0/1 | 1/1 | 0/0 | N/A | 20 |
| B. subtilis | 86/87 | 0/0 | 0/0 | 0/0 | N/A | 18 |
| A. aeolicus | 43/43 | 0/0 | 0/1 | 0/0 | N/A | 4 |
| H. influenzae Rd | 56/56 | 0/1 | 1/1 | 0/0 | N/A | 7 |
| M. pneumoniae | 35/36 | 0/0 | 1/1 | 0/0 | N/A | 6 |
If two numbers are reported, the left number corresponds to the number of sequences found by tRNAscan-SE that are also found by RNAMotif, and the right number corresponds to the total number found by tRNAscan-SE.
atRNA genes coding for standard amino acids.
bPseudogenes.
cSelenocysteine tRNA genes.
dtRNA-like genes with undetermined anticodons.
eNumber of hits found by RNAMotif only that contained introns.
fNumber of hits found by RNAMotif only that did not contain introns.
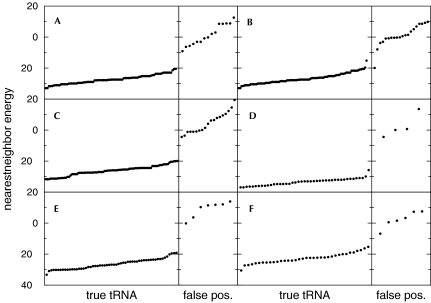
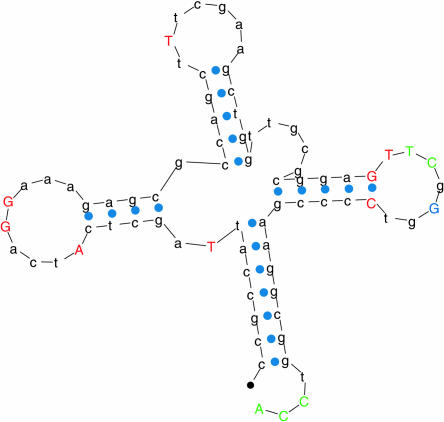
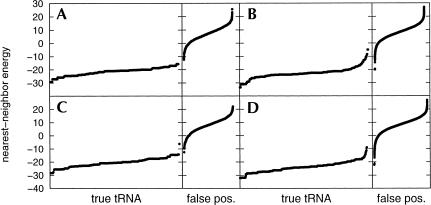
Upon initial examination of Table 1 ▶, it appears that a significant number of sequences were found using RNAMotif that were not considered tRNA genes by tRNAscan-SE. This was expected from the generality of the descriptor used to pick out these sequences. However, the nearest-neighbor energies for almost all of these false positives were noticeably higher than the other sequences (Fig. 2 ▶). One false positive in the E. coli O157:H7 genome stands out as an exception (Fig. 2B ▶), with a relatively low nearest-neighbor energy of −19.9. In addition to having a low nearest-neighbor free energy, this sequence, whose corresponding cloverleaf structure is shown in Figure 3 ▶, has the potential of being a true tRNA gene that was missed by tRNAscan-SE for the following reasons: (1) Several nucleotides whose sequences were not included in the descriptor nevertheless followed the conserved patterns (Fig. 3 ▶, shown in red). (2) The anticodon sequence is TCG, which codes for arginine. (3) Its sequence spans a region of the genome (bases 5995–6077 of the NCBI entry AE005323) sandwiched between two tRNA genes spanning bases 5912–5987 and 6085–6161. (There is, however, no TTTT terminator sequence between this tRNA gene and the next tRNA gene.) This may not have been found by tRNAscan-SE because the fifth position of the TPC loop is a G instead of the conserved A, or because of an A–A mispair in the aminoacyl stem and an A–C mispair in the TPC stem.
FIGURE 2.
Nearest-neighbor energies of sequences found by RNAMotif as they adopt the secondary structure in Figure 1 ▶, for the following bacterial genomes: (A) Escherichia coli K-12, (B) E. coli O157:H7, (C) Bacillus subtilis, (D) Aquifex aeolicus, (E) Haemophilus influenzae Rd, and (F) Mycoplasma pneumoniae. (true tRNA) Sequences corresponding to those that were also found by tRNAscan-SE; (false pos.) sequences corresponding to those that were not found by tRNAscan-SE.
FIGURE 3.
A sequence (and the corresponding cloverleaf structure) found by RNAMotif in the Escherichia coli O157:H7 genome that was not found by tRNAscan-SE. (Green) Conserved nucleotides included in the RNAMotif descriptor; (red) conserved nucleotides that were not included in the RNAMotif descriptor but were matched by this sequence; (blue) a conserved nucleotide that is violated by this sequence.
The RNAMotif descriptor could be further optimized for a particular species. For example, the descriptor in Figure 4 ▶ was optimized for the K-12 and O157:H7 strains of E. coli, such that the same tRNA genes were found as in the general descriptor, but the only false positive observed was the one in the O157:H7 strain with low (−19.9) nearest-neighbor energy (see above). A main difference between this descriptor and the general descriptor in Figure 1 ▶ is that the G–U base pairs are not allowed in the E. coli descriptor. The E. coli tRNAs (including those predicted by tRNAscan-SE) do not use G–U base pairs, although such G–U base pairs are found in the tRNAs of many other organisms. Although a descriptor with the same secondary structure as Figure 1 ▶ without any requirements in conserved nucleotides (and allowing a mispair in each stem) gave >25,000 false positives in the E. coli genomes when G–U base pairs were allowed, the number of false positives was reduced to ∼80 when G–U base pairs were not allowed. Some of the requirements for conserved nucleotides are also different (cf. Figs. 1 and 4 ▶ ▶). It was found that all of the E. coli tRNAs predicted by tRNAscan-SE contained CCA at the 3′ end. Not all of the tRNAs for other prokaryotic organisms studied here contained this sequence; in fact, this sequence was present in only 80% of the Bacillus subtilis tRNAs. In organisms that do not encode the 3′-terminal CCA (eukaryotes, some archaea, and many eubacteria), the CCA-adding enzyme, ATP(CTP):tRNA nucleotidyltransferase, catalyzes the synthesis and regeneration of the 3′-terminal CCA sequence of tRNA (Sprinzl and Cramer 1979; Deutscher 1982; Shi et al. 1998). This sequence was therefore not included in the general descriptor.
FIGURE 4.
An optimized descriptor for the Escherichia coli genomes (both K-12 and O157:H7 strains).
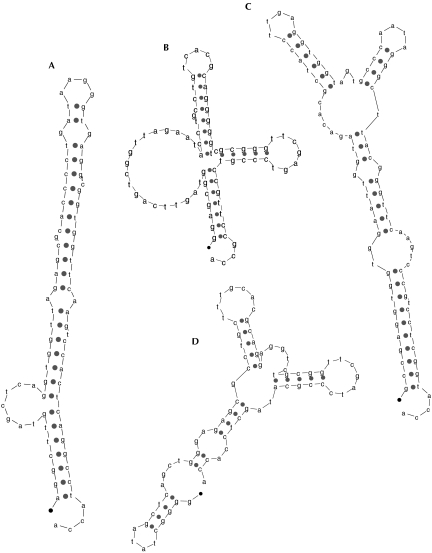
All 95 tRNA sequences in the E. coli O157:H7 genome, found both by tRNAscan-SE and RNAMotif, were folded using the program mfold (Zuker 1989; Mathews et al. 1999) to find the secondary structures with minimum nearest-neighbor energy. Of these 95 sequences, 32 folded to correct cloverleaf structures. Figure 5 ▶ illustrates a few of the alternate minimum-energy structures for the other 63 structures. Three of the examples in this figure have correctly folded aminoacyl arms, which was true in 85 of the 95 structures. The structure in Figure 5B ▶ is an example of one that almost looks like a cloverleaf, with both the aminoacyl and TPC arms correctly folded. Conversely, the structure in Figure 5A ▶ forms a double helix with bulges, and has completely lost the cloverleaf resemblance.
FIGURE 5.
Examples of lowest nearest-neighbor energy secondary structures from mfold, for sequences found by both RNAMotif and tRNAscan-SE.
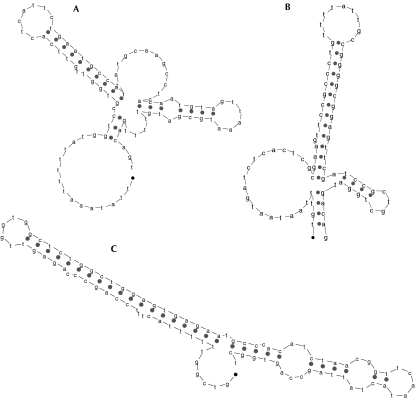
Besides the true tRNA sequences, 70 false-positive sequences obtained using the general descriptor in Figure 1 ▶ for all six bacterial genomes (Table 1 ▶) were subjected to mfold. In other words, these are sequences that could potentially fold into the secondary structural motif depicted in Figure 1 ▶. Of these 70 sequences, none folded to the canonical secondary structures of a cloverleaf. A few examples of minimum-energy structures for these sequences are shown in Figure 6 ▶.
FIGURE 6.
Examples of lowest nearest-neighbor energy secondary structures from mfold, for sequences found only by RNAMotif.
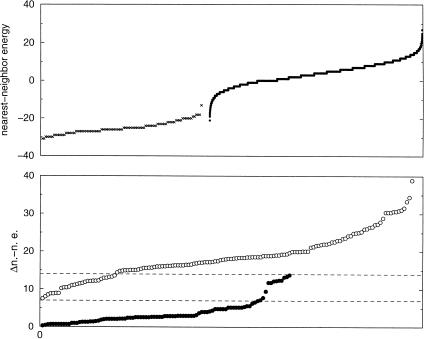
Use of a descriptor with the same secondary structure as in Figure 1 ▶, but that lacked any sequence requirements and allowed one mispair in each of the stems, produced >25,000 false positives. Several of these false positives had low nearest-neighbor energies that overlapped with a subset of the true tRNAs’ energies (Fig. 7 ▶). From this collection of false positives, 150 lowest-energy sequences were subjected to mfold; none of these folded to the canonical cloverleaf structure. We also examined the differences in nearest-neighbor energies between the cloverleaf motif and the minimum-energy secondary structure for each of these 150 sequences, as well as for the 95 true tRNA sequences in E. coli O157:H7 (Fig. 7 ▶, bottom). Although this difference is overall larger for the false-positive sequences, there is a region of overlap between the false positives and true tRNAs. Hence, the nearest-neighbor cloverleaf energy (Fig. 7 ▶, top) serves as a good discriminator of false positives, whereas the energy gap between the cloverleaf structure and the minimum energy structure (Fig. 7 ▶, bottom) does not.
FIGURE 7.
(Top) Plot of the nearest-neighbor energies of sequences in Escherichia coli O157:H7 that were found by both tRNAscan-SE and RNAMotif (crosses), and sequences that were found only by RNAMotif (dots), as they adopt the secondary structure in Figure 1 ▶. (Bottom) The difference in nearest-neighbor energies between a sequence in cloverleaf structure and in its lowest-energy secondary structure, plotted for true tRNAs (filled circles) and false positives (open circles). The overlapping region is enclosed in dotted lines.
Applications to eukaryotes
The results of RNAMotif searches for sequences in the eukaryotic genomes that matched the tRNA general descriptor are summarized in Table 2 ▶. The descriptor used here differs from that of the bacterial genomes only by allowing an 8–60-nt intron between the sixth and seventh nucleotides of the anticodon loop. Of the potential tRNA genes coding for standard amino acids found by tRNAscan-SE, 96.4% were also found by RNAMotif. Furthermore, of the 220 tRNA genes with introns that were predicted by tRNAscan-SE, 218 were found by RNAMotif.
TABLE 2.
RNAMotif results for eukaryotic genomes
| Organism | No. std tRNAa | No. psdgb | No. SeCc | No. undetd | No. false pos. w/ introne | No. false pos. w/o intronf |
| S. cerevisiae | 270/273 | 0/0 | 0/0 | 2/2 | 1238 | 63 |
| S. pombe | 186/200 | 0/0 | 0/0 | 0/0 | 1254 | 61 |
| A. thaliana | 401/409 | 1/409 | 0/0 | 0/1 | 9212 | 549 |
| C. elegans | 558/586 | 0/586 | 1/1 | 2/3 | 10363 | 562 |
If two numbers are reported, the left number corresponds to the number of sequences found by tRNAscan-SE that are also found by RNAMotif, and the right number corresponds to the total number found by tRNAscan-SE.
atRNA genes coding for standard amino acids.
bPseudogenes.
cSelenocysteine tRNA genes.
dtRNA-like genes with undetermined anticodons.
eNumber of hits found by RNAMotif only that contained introns.
fNumber of hits found by RNAMotif only that did not contain introns.
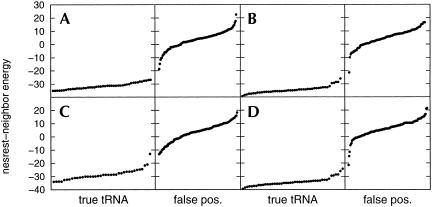
The number of false positives increased dramatically with the inclusion of an intron in the descriptor, as the number of false positives with introns is 15–20 times larger than the number of false positives without introns (Table 2 ▶). Examination of the nearest-neighbor energies (Fig. 8 ▶) shows that true tRNAs still gave generally lower energies than false positives. However, regions of overlapping energies occur, especially in Arabidopsis thaliana and Caenorhabditis elegans. Most of the low-energy false positives are sequences with introns. In fact, none of the false positives without introns has nearest-neighbor energies below −10.8 kcal/mole.
FIGURE 8.
Nearest-neighbor energies of sequences found by RNAMotif as they adopt the secondary structure in Figure 1 ▶, for the following eukaryotic genomes: (A) Saccharomyces cerevisiae, (B) Arabidopsis thaliana, (C) Schizosaccharomyces pombe, and (D) Caenorhabditis elegans.
Several tRNA sequences found by tRNAscan-SE have nearest-neighbor energies above around −15 kcal/mole, relatively higher than most other true tRNA sequences (Fig. 8 ▶). These tRNA structures contain multiple G–U base pairs, and sometimes a mispair in each stem. Comparison of the tRNAs in prokaryotes and eukaryotes (predicted by tRNAscan-SE) shows that the tRNAs in eukaryotes are more likely to contain deviations such as mispairs, insertions, bulges, and mismatches to conserved nucleotides. This is the main cause for a larger percentage of tRNA genes in eukaryotes found by tRNAscan-SE, but missed by RNAMotif, relative to bacteria. Some of these deviations are systematic for a particular tRNA in a particular organism. For example, 4 of the 15 methionine tRNAs in A. thaliana have a cytosine instead of the conserved uracil in the second nucleotide of the anticodon loop. Similarly, in 11 of the 14 alanine tRNAs in Schizosaccharomyces pombe, the TPC loop is closed by an A–T base pair instead of the conserved G–C base pair. The reasons for the evolution of these variations may shed light on functions for these nucleotides specific for a particular organism.
Applications to archaea
The results of RNAMotif searches for sequences in the archaea genomes that matched the tRNA general descriptor are summarized in Table 3 ▶. Of the potential tRNA genes coding for standard amino acids found by tRNAscan-SE, 98.3% were also found by RNAMotif. The descriptor used for the archaea genomes included a potential intron, as in the descriptor for the eukaryotic genomes. None of the genes found by tRNAscan-SE but missed by RNAMotif contained introns.
TABLE 3.
RNAMotif results for archaea genomes
| Organism | No. std tRNAa | No. psdgb | No. SeCc | No. undetd | No. false pos. w/ introne | No. false pos. w/o intronf |
| S. fulgidus | 46/46 | 0/0 | 0/0 | 0/0 | 108 | 6 |
| M. thermoautotrophicum | 37/39 | 0/0 | 0/0 | 0/0 | 113 | 7 |
| P. abyssi | 46/46 | 0/0 | 0/0 | 0/0 | 101 | 2 |
| P. furiosus | 45/46 | 0/0 | 0/0 | 0/0 | 128 | 2 |
If two numbers are reported, the left number corresponds to the number of sequences found by tRNAscan-SE that are also found by RNAMotif, and the right number corresponds to the total number found by tRNAscan-SE.
atRNA genes coding for standard amino acids.
bPseudogenes.
cSelenocysteine tRNA genes.
dtRNA-like genes with undetermined anticodons.
eNumber of hits found by RNAMotif only that contained introns.
fNumber of hits found by RNAMotif only that did not contain introns.
The nearest-neighbor energies for false positives and true tRNA sequences with the cloverleaf structures are plotted in Figure 9 ▶. In general, the true tRNA sequences tend to have overall higher nearest-neighbor energies than the false positives, with energies below −20 kcal/mole. However, one sequence in Methanobacterium thermoautotrophicum that was found both by tRNAscan-SE and RNAMotif had a relatively high nearest-neighbor energy of −12.93 kcal/mole. On examination of the results, it was found that tRNAscan-SE had predicted 68 nt in the intron for this sequence, 8 more than the maximum length of the intron in the RNAMotif descriptor. RNAMotif found this sequence, nevertheless, because of alternate base-pairing schemes and increased length of the variable loop in the RNAMotif secondary structure relative to the tRNAscan-SE secondary structure. Using the same secondary structure predicted by tRNAscan-SE (with the 68-nt intron) gave a lower nearest-neighbor energy of −19.6 kcal/mole.
FIGURE 9.
Nearest-neighbor energies of sequences found by RNAMotif as they adopt the secondary structure in Figure 1 ▶, for the following archaea genomes: (A) Archaeoglobus fulgidus, (B) Pyrococcus abyssi, (C) Methanobacterium thermoautotrophicum, and (D) Pyrococcus furiosus.
The inclusion of introns, as discussed above and seen in Tables 2 and 3 ▶ ▶, increases the number of false positives. Furthermore, it decreases the reliability of using nearest-neighbor energies to assess the possibility that a sequence truly adopts a particular fold. One such example is the lowest-energy false-positive sequence found by RNAMotif in the Pyrococcus abyssi genome, with a nearest-neighbor energy of −21.34 kcal/mole. RNAMotif predicts that this sequence has a 45-nt intron and a 20-nt variable loop, spanning bases 578160–578296 of the genome. However, two true tRNAs were found by both RNAMotif and tRNAscan-SE that overlap with the false-positive sequence, spanning bases 578139–5781215 for one and 578219– 578296 for the other. This serves as a warning for using nearest-neighbor energies for assessing the folds, especially when a lengthy insertion sequence (with unknown secondary structural features of its own) is used as part of the descriptor.
DISCUSSION
Use of nearest-neighbor energy as a scoring function
The results in this study illustrate that nearest-neighbor energies can potentially be used as a novel scoring function for these secondary structure pattern-matching programs, and can be used alone or in conjunction with scoring functions based on sequence conservation. Although these energies appear to be robust in distinguishing between false-positive and true tRNAs in bacteria as well as in eukaryotes and archaea, this trend should not be considered a set rule. Nearest-neighbor energies are only rough estimates of the thermodynamics of secondary structural formation, and do not take into account tertiary interactions. Furthermore, the fact that a particular secondary structure adopted by a sequence has low energy does not indicate how close this secondary structure is to the global minimum-energy structure.
The results from mfold show that only about a third of the true tRNA sequences adopt cloverleaf structures as their lowest-energy configurations. (This fraction may be somewhat improved if a more sophisticated approach is used for modified nucleotides; see Mathews et al. 1999). This points to limitations in the nearest-neighbor energy function, and indicates that the function could be further improved by examination of resulting mfold structures for a variety of sequences. The lowest-energy structures often appear to adopt as long of a continuous double-helical stem as possible, and this could be remedied if the energy function also had the ability to include known tertiary interactions specified by the user. In addition to tertiary interactions, the efn2 nearest-neighbor energy function presently cannot be used for pseudoknot structures. Because several biologically important RNA segments have been found to adopt pseudoknot structures (Hilbers et al. 1998; McCarthy 2000), including the ability of mfold and RNAMotif to assess these structural motifs provides an exciting future direction (Rivas and Eddy 1999; Diamond et al. 2001; Mathews and Turner 2002).
A major advantage of using nearest-neighbor energies as a scoring function lies in its generality to all standard secondary structural motifs, such that it can be used even when no alignments or sequence profiles for a target RNA structure exist. In terms of a well-studied family such as the tRNAs, it can be used as an additional stage of assessment. For example, the sequences found by tRNAscan-SE and RNAMotif with high nearest-neighbor energies pose a warning, and should be examined in more detail. Conversely, the sequences missed by tRNAscan-SE (but found by RNAMotif owing to their low nearest-neighbor energies) should also be given special attention, because they have a higher probability of being true tRNAs missed by tRNAscan-SE. Most of the high-energy tRNA structures found in this study contained mispairs and numerous G–U base pairs, and the lowest-energy structures were mainly characterized by large G–C base-pair content. In addition, the energy function includes more subtle rules for stacking, base-pairing, and loop formation. These energy rules therefore provide a more universal and systematic scoring function than a simple count of G–U base-pair and mispair frequencies.
Generation of motifs
The tRNA structures and sequence profiles are perhaps the most well-studied among RNAs; hence, they are appropriate for method validation and testing of descriptors. However, the procedures for optimizing RNAMotif descriptors should be able to apply more generally to RNAs in which less information is available.
We propose here a general procedure for optimizing RNAMotif descriptors in the absence of sequence profiles. First, a descriptor of the secondary structure is created from a crystal/NMR structure or other experimental evidence of base-pairing schemes and lengths of loops. This initial descriptor does not include any sequence requirements or mispairs. Searches with this descriptor are expected to miss those sequences that contain some variability in the lengths of secondary structural elements, or those that contain mispairs. These searches may also find false positives because of the lack of sequence requirements, and those are more likely to give high nearest-neighbor energies. Alignment of only those sequences with low nearest-neighbor energies, which are thus the best candidates, may be used to discover conserved nucleotides, which can be included in the descriptor for the next round of searches. The next descriptor is made stricter from the sequence requirements, but can also be relaxed structurally at the same time (increase the range of lengths of secondary structure elements or allow mispairs) to find the more structurally divergent sequences. These steps can be repeated and optimized. Of course, in the absence of experimental data for comparison, it is difficult to quantitate when one has reached the optimal descriptor that cannot be improved further, or what is the definitive cut-off value for the nearest-neighbor energies in distinguishing between true and false positives (as this cutoff will be different for different motifs). This procedure, however, provides a means of finding sequences that are most likely to form a specified structure, and has the potential of discovering information on sequence conservation in the absence of a pre-existing family of sequences.
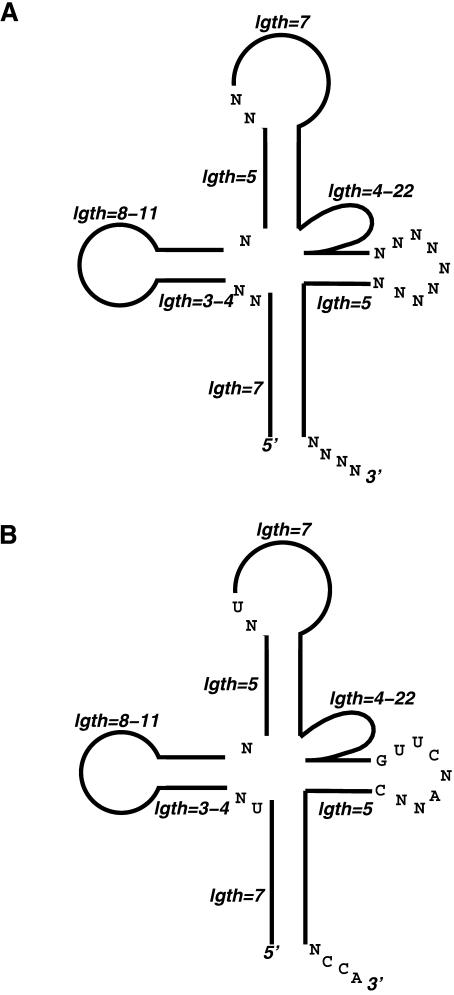
To test this procedure on the search for tRNA in the E. coli O157:H7 genome, we started with the descriptor shown in Figure 10A ▶. This descriptor contains no sequence requirements, and no mispairs are allowed. It corresponds closely to what was known about bacterial tRNAs in the late 1970s (Jack et al. 1976; Kim 1979), and hence serves as an example of how fragmentary initial information might be bootstrapped into a more complete description.
FIGURE 10.
Examples illustrating the process of optimizing the descriptors, starting from a descriptor without sequence requirements (A) to a descriptor with sequence requirements but allowing a mispair in each stem (B).
Using this descriptor, 26 tRNAs found by tRNAscan-SE were missed by RNAMotif, and 5 tRNAs found by RNAMotif were false positives. These 5 false positives all had nearest-neighbor energies of 1.1, −6.3, −10.8, −12.7, and −18.0 kcal/mole, higher than the other true tRNAs (with nearest-neighbor energies ≤−21.7 kcal/mole). Next, the 50 sequences giving the lowest nearest-neighbor energies were aligned, resulting in 11 nucleotides that are 100% conserved. These are then included in the next round of searches, with the descriptor shown in Figure 10B ▶. This descriptor also allows a mispair in each helix. The resulting sequences produced no false positives because of the conserved nucleotide requirements, and the number of tRNAs found by tRNAscan-SE and missed by RNAMotif was dropped from 26 to 2 because of the allowance of mispairs. This example is a simple test case for this optimization procedure. Naturally, other motifs may encounter additional difficulties as the variation of lengths of structural elements may be less known, and many more rounds of optimization with different ranges in lengths, mispairs, and strictness in sequence conservation may be needed. Even in those cases, the nearest-neighbor energy function provides a universally applicable means of assessing the probability that a sequence folds into a particular secondary structure.
Conclusions
This sort of application tests the efn2 function in new ways. A good folding function must favor the correct fold over others, which often have nearly similar secondary structures; in contrast, a good threading potential for inverse folding should penalize bad sequences (for a given secondary structure), but the amount of the penalty is not important, provided that it is large enough to provide a discrimination between good and bad sequences. As a forward-folding potential, efn2 is only moderately successful with known tRNA sequences: About one-third of the sequences examined were predicted to fold to the correct secondary structure, and ∼70% of base-pairings were correctly predicted. The results below show much better performance of efn2 as a threading potential: It is able with high fidelity to identify sequences that should not fold into a tRNA-like secondary structure.
The model of tRNAs used here is deliberately a very simple one. We have concentrated on finding sequences that can adopt a cloverleaf secondary structure within given ranges of stem and loop lengths. We have not attempted to identify or make use of promoter sequences, and our model for introns is very simple and depends on prior knowledge that could not be readily obtained just from scanning genomic sequences. It would clearly be possible to extend our tRNA model in various directions, and to examine the biological implications of the results in greater detail, as, for example, in the analysis of Marck and Grosjean (2002). However, the broader implications of our results lie in the generality of the threading potential, which is based on estimates of folding free energies that are not specific to tRNA. This implies that the good discrimination against false positives seen here may be repeated for other motifs. The upshot should be that relatively simple descriptors can be usefully scanned against genome sequences. Even though such searches will often produce many hits, false positives can be eliminated by means of the threading potential that has a sound physical basis. Because the nearest-neighbor potentials were developed from the observed thermodynamics of small RNA fragments, and have nothing specific about tRNA in their parameterization, this indicates that the general procedure outlined here should be useful in a variety of applications. We will report results on searches for ribosomal RNA genes elsewhere.
MATERIALS AND METHODS
We used version 2.2 of RNAMotif (Macke et al. 2001; http://www.scripps.edu/case/rnamotif.me), with a series of descriptors for the cloverleaf secondary structure of tRNA. The algorithms used by RNAMotif to locate subsequences in a genome that satisfy the restraints from the descriptor have been described in detail (Macke et al. 2001), and the specific descriptors used are discussed above. We have placed example inputs and outputs for the Escherichia coli O157:H7 strain on an anonymous ftp server, ftp://ftp.scripps.edu/case/Ecoli.trna.example.tar.gz. For the tRNA descriptors used here, the computation time is very nearly linear in the size of the genomic sequences being analyzed. The E. coli example takes ∼6 min on a 195-MHz SGI R10000 computer.
Searches were carried out for six prokaryotic genomes (E. coli K-12, E. coli O157:H7, Bacillus subtilis, Aquifex aeolicus, Haemophilus influenzae Rd, and Mycoplasma pneumoniae), four eukaryotic genomes (Saccharomyces cerevisiae, Schizosaccharomyces pombe, Chromosomes 1, 2, and 4 of Arabidopsis thaliana, and Caenorhabditis elegans), and four archaea genomes (Pyrococcus abyssi, Archaeoglobus fulgidus, Methanobacterium thermoautotrophicum, and Pyrococcus furiosus). The genomic sequences were obtained from the NCBI (National Center for Biotechnology Information) for all organisms except the following: S. pombe (Sanger Centre, UK), P. abyssi (Genscope, France), A. fulgidus (The Institute for Genomic Research), and P. furiosus (Utah Genome Center).
It is important to remember that sequences matching a particular profile only have the possibility of forming the given structure, that is, they satisfy base-pairing constraints in the stem regions and length restrictions in loops. The sequences thus identified can be fed to scoring functions (or threading potentials) to further assess the fit of the sequence to the proposed secondary structure. Here we use the efn2 parameters of the Mathews group (Mathews et al. 1999; Zuker et al. 1999) as a threading potential. This function is based largely on the observed thermodynamics of small RNA fragments (Xia et al. 1998), and estimates the folding free energy of a given sequence and secondary structure through an additive model based on nearest-neighbor sequence interactions. It has been widely used, with some success, to find the lowest-energy secondary structure for a given sequence, in conjunction with programs such as mfold (Zuker 2000) or pknots (Rivas and Eddy 1999). Here we are testing efn2 for inverse folding, that is, for assessing the fit of a sequence to a predetermined (cloverleaf) secondary structure.
For many of the candidate tRNA sequences, we also used Version 3.1 of the mfold program (Zuker 1989), with parameters from Mathews et al. (1999), to determine the secondary structure with lowest nearest-neighbor energy. These energies could then be compared with those obtained for the efn2 function when the secondary structure is forced to adopt the tRNA-like cloverleaf pattern.
Acknowledgments
We thank Dave Mathews for helpful comments on the nearest-neighbor energy functions, ISIS Pharmaceuticals for financial support in the development of the RNAmotif program, and NIH Grant RR12255 for support of this application.
The publication costs of this article were defrayed in part by payment of page charges. This article must therefore be hereby marked “advertisement” in accordance with 18 USC section 1734 solely to indicate this fact.
Article and publication are at http://www.rnajournal.org/cgi/doi/10.1261/rna.2193703.
REFERENCES
- Deutscher, M.P. 1982. tRNA nucleotidyltransferase. The Enzymes 15: 183–215. [Google Scholar]
- Diamond, J.M., Turner, D.H., and Mathews, D.H. 2001. Thermodynamics of three-way multibranch loops in RNA. Biochemistry 40: 6971–6981. [DOI] [PubMed] [Google Scholar]
- Durbin, R., Eddy, S., Krogh, A., and Mitchison, G. 1998. Biological sequence analysis. Probabilistic models of proteins and nucleic acids. Cambridge University Press, Cambridge, UK.
- Eddy, S.R. and Durbin, R. 1994. RNA sequence analysis using covariance models. Nucleic Acids Res. 22: 2079–2088. [DOI] [PMC free article] [PubMed] [Google Scholar]
- Fichant, G.A. and Burks, C. 1991. Identifying potential tRNA genes in genomic DNA sequences. J. Mol. Biol. 220: 659–671. [DOI] [PubMed] [Google Scholar]
- Gautheret, D., Major, F., and Cedergren, R. 1990. Pattern searching/alignment with RNA primary and secondary structures: An effective descriptor for tRNA. CABIOS 6: 325–331. [DOI] [PubMed] [Google Scholar]
- Hani, J. and Feldmann, H. 1998. tRNA genes and retroelements in the yeast genome. Nucleic Acids Res. 26: 689–696. [DOI] [PMC free article] [PubMed] [Google Scholar]
- Hilbers, C.W., Michiels, P.J.A., and Heus, H.A. 1998. New developments in structure determination of pseudoknots. Biopolymers 48: 137–153. [DOI] [PubMed] [Google Scholar]
- Jack, A., Ladner, J.E., and Klug, A. 1976. Crystallographic refinement of yeast phenylalanine transfer RNA at 2.5 Å resolution. J. Mol. Biol. 108: 619–649. [DOI] [PubMed] [Google Scholar]
- Kim, S.H. 1979. Crystal structure of yeast phenylalanine tRNA and general structural features of other tRNAs. In Transfer RNA structure, properties and recognition (eds. P.R. Schimmel et al.), pp. 83–100. Cold Spring Harbor Laboratory, Cold Spring Harbor, NY.
- Laferrire, A., Gautheret, D., and Cedergren, R. 1994. An RNA pattern matching program with enhanced performance and portability. CABIOS 10: 211–212. [DOI] [PubMed] [Google Scholar]
- Lowe, T.M. and Eddy, S.R. 1997. tRNAscan-SE: A program for improved detection of transfer RNA genes in genomic sequence. Nucleic Acids Res. 25: 955–964. [DOI] [PMC free article] [PubMed] [Google Scholar]
- Macke, T.J., Ecker, D.J., Gutell, R.R., Gautheret, D., Case, D.A., and Sampath, R. 2001. RNAMotif, an RNA secondary structure definition and search algorithm. Nucleic Acids Res. 29: 4724–4735. [DOI] [PMC free article] [PubMed] [Google Scholar]
- Marck, C. and Grosjean, H. 2002. tRNomics: Analysis of tRNA genes from 50 genomes of Eukarya, Archaea, and Bacteria reveals anticodon-sparing strategies and domain-specific features. RNA 8: 1189–1232. [DOI] [PMC free article] [PubMed] [Google Scholar]
- Mathews, D.H. and Turner, D.H. 2002. Experimentally derived nearest-neighbor parameters for the stability of RNA three- and four-way multibranch loops. Biochemistry 41: 869–880. [DOI] [PubMed] [Google Scholar]
- Mathews, D.H., Sabina, J., Zuker, M., and Turner, D.H. 1999. Expanded sequence dependence of thermodynamic parameters improves prediction of RNA secondary structure. J. Mol. Biol. 288: 911–940. [DOI] [PubMed] [Google Scholar]
- McCarthy, J.E.G. 2000. Translation initiation: Insect virus RNA rewrites the rule book. Curr. Biol. 10: R715–R717. [DOI] [PubMed] [Google Scholar]
- Mirny, L.A., Finkelstein, A.V., and Shakhnovich, E.I. 2000. Statistical significance of protein structure prediction by threading. Proc. Natl. Acad. Sci. 97: 9978–9983. [DOI] [PMC free article] [PubMed] [Google Scholar]
- Panchenko, A., Marchler-Bauer, A., and Bryant, S. 2000. Combination of threading potentials and sequence profiles improves fold recognition. J. Mol. Biol. 296: 1319–1332. [DOI] [PubMed] [Google Scholar]
- Pavesi, A., Conterio, F., Bolchi, A., Dieci, G., and Ottonello, S. 1994. Identification of new eukaryotic tRNA genes in genomic DNA databases by a multistep weight matrix analysis of transcriptional control regions. Nucleic Acids Res. 22: 1247–1256. [DOI] [PMC free article] [PubMed] [Google Scholar]
- Rivas, E. and Eddy, S.R. 1999. A dynamic programming algorithm for RNA structure prediction including pseudoknots. J. Mol. Biol. 285: 2053–2068. [DOI] [PubMed] [Google Scholar]
- Shi, P.-Y., Maizels, N., and Weiner, A.M. 1998. CCA addition by tRNA nucleotidyltransferase: Polymerization with translocation? EMBO J. 17: 3197–3206. [DOI] [PMC free article] [PubMed] [Google Scholar]
- Skolnick, J., Kolinski, A., Kihara, D., Betancourt, M., Rotkiewicz, P., and Boniecki, M. 2001. Ab initio protein structure prediction via a combination of threading, lattice folding, clustering, and structure refinement. Proteins 45: 149–156. [DOI] [PubMed] [Google Scholar]
- Sprinzl, M. and Cramer, F. 1979. The -C-C-A end of tRNA and its role in protein biosynthesis. Prog. Nucleic Acid Res. Mol. Biol. 22: 1–69. [DOI] [PubMed] [Google Scholar]
- Wolin, S.L. and Matera, A.G. 1999. The trials and travels of tRNA. Genes & Dev. 13: 1–10. [DOI] [PubMed] [Google Scholar]
- Xia, T., SantaLucia, J., Burkard, M.E., Kierzek, R., Schroeder, S.J., Jiao, X., Cox, C., and Turner, D.H. 1998. Thermodynamic parameters for an expanded nearest-neighbor model for formation of RNA duplexes with Watson-Crick base pairs. Biochemistry 37: 14719–14735. [DOI] [PubMed] [Google Scholar]
- Zuker, M. 1989. On finding all suboptimal foldings of an RNA molecule. Science 244: 9408–9412. [DOI] [PubMed] [Google Scholar]
- ———. 2000. Calculating nucleic acid secondary structure. Curr. Opin. Struct. Biol. 10: 303–310. [DOI] [PubMed] [Google Scholar]
- Zuker, M., Mathews, D.H., and Turner, D.H. 1999. Algorithms and thermodynamics for RNA secondary structure prediction: A practical guide. NATO Sci. Ser. 370: 11–43. [Google Scholar]


