Abstract
High-density DNA microarrays have been used to explore the genomic profiling of gene expression of a defective Escherichia coli strain with a temperature-sensitive mutation in the protein component of RNase P. A novel gene cluster was discovered in which two of the genes are known substrates of RNase P. The expression pattern of essential genes and gene discovery from intergenic regions, for which other new transcripts are found, are also discussed.
Keywords: RNase P, substrates, intergenic RNAs, RNase E
INTRODUCTION
DNA microarrays have been used extensively to study the profiles of gene expression in Escherichia coli. This technology has been shown to be a powerful tool in investigating the patterns of global gene expression of E. coli under various growth conditions such as oxidative stress (Oh et al. 2002), heat shock and IPTG induction (Richmond et al. 1999), tryptophan metabolism alteration (Khodursky et al. 2000), and log phase versus stationary phase (Selinger et al. 2000; Tani et al. 2002). Although several effects of specific genes on genomic expression have been reported (Hung et al. 2002; Lehnen et al. 2002; Oshima et al. 2002; Schembri et al. 2002), no microarray data on the phenotype of a single, temperature-sensitive gene in bacteria yet exist.
RNase P is an essential enzyme that generates the mature 5′ end of tRNAs in all organisms, as well as in some mitochondria and chloroplasts (Gopalan et al. 2002). E. coli RNase P is a ribonucleoprotein consisting of a single protein component (C5) and a single RNA subunit (M1), the latter being the catalytic subunit (Guerrier-Takada et al. 1983). This enzyme is known to process various RNAs in addition to precursor tRNAs. Some of these other RNAs are precursors to 4.5S RNA, tmRNA, and to phages P1 and P7 antisense C5 RNA, and the hisG-I operon mRNA (Alifano et al. 1994; Gopalan et al. 2002). The versatile character of E. coli RNase P suggests that this enzyme plays multiple roles in cellular metabolism.
In this study we explore the function of RNase P using a temperature-sensitive (ts) strain of E. coli. This strain contains a single mutation in the chromosomal gene rnpA that changes an arginine to a histidine at position 46 of the C5 protein. This point mutation (R46H) results in a ts phenotype. When the ts strain (called A49) is incubated at 43°C, the mutant C5 protein R46H does not assemble well with M1 RNA to generate an active RNase P complex (Baer et al. 1989). The resultant phenotype is cell death at the higher temperature. The A49 strain, together with its wild-type cognate (see Materials and Methods; Kirsebom et al. 1988), provides a perfect model system for studying changes in the global gene expression study of a single crucial enzyme. Expression changes resulting from defects in RNase P may also reveal previously unknown substrates and further our understanding of the multifunctional role of RNase P in cell metabolism.
This report first summarizes the effects of the ts mutation in C5 protein on DNA microarray analysis and documents various general categories of metabolic functions that are affected at the restrictive temperatures. Specific effects of RNase P and RNase E function on certain gene transcripts that are elevated at the restrictive temperature are then described.
RESULTS
Design strategy
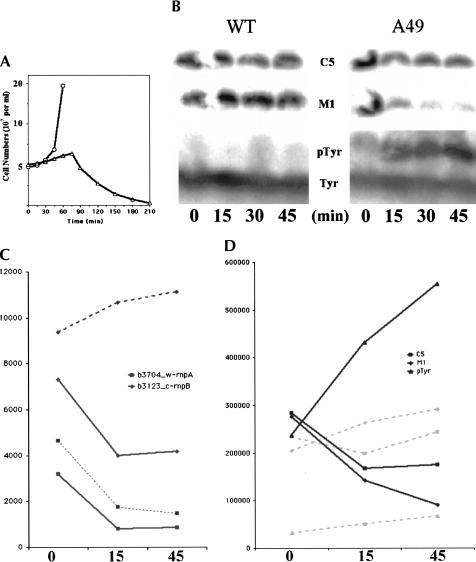
The growth of A49 was significantly inhibited at 43°C compared to 30°C (Fig. 1A ▶). A Northern blot analysis revealed that precursor to tRNATyr (pTyr) accumulated to high levels in A49 after less than 1 h at 43°C. This confirms that RNase P activity in A49 is inhibited at the restrictive temperature (Fig. 1B ▶).
FIGURE 1.
Growth curve and analysis of M1 RNA, C5 protein and precursor to tRNATyr (pTyr RNA) of wild type (WT), and A49 strains. (A) Time course of strains WT and A49 at 43°C. The y-axis stands for the number of living cells in the media. (○) Wild type (WT); (▵) A49. (B) Northern blot of M1 RNA, C5 protein, and pTyr. The same nylon membrane was probed by different oligonucleotides complementary to the M1 RNA, C5 protein, and pTyr RNA sequences, respectively. (C) Lines with marks indicate graphic representation of M1 RNA and C5 protein from the microarray. The solid lines denote samples from A49, and the dashed lines are those from the WT strain (squares, rnpA; diamonds, rnpB). It should be noted the singlet tRNATyr gene is not present in the genome of E. coli K-12 strain MG1655 on which the Affymetrix chips were based. Therefore, there is no probe in the array for the precursor sequence to this tRNA. The y-axis is the scaled average value (the signal) of each probe after normalization and scaling from the arbitrary fluorescence units. The signal could be regarded as the relative amount of each transcript. (D) Graphic representation of M1 RNA, C5 protein, and pTyr RNA from B (solid lines, A49; dashed lines, WT; squares, C5 protein; diamonds, M1 RNA; triangles, pTyr RNA). The y-axis is the calibrated radioactivity value of bands in the gel as determined by Image Gauge 3.3 (Fuji film).
Because A49 displays the ts phenotype rapidly after being placed at 43°C, we examined gene expression at several times after the shift to the higher temperatures. Wildtype cultures were grown under identical conditions and checked at the same time points. The corresponding samples are referred to as A0, A15, A45, and W0, W15, W45.
Overview of the microarray expression data
Duplicate samples from the same culture for each time point were hybridized to high-density DNA microarrays (12 samples total). The data from these duplicates showed very high consistency with correlation coefficients (R2) values ranging from 0.97 to 0.99 (Table 1 ▶). More than 2200 of the 4335 genes were detected by the array of all 12 samples (Table 1 ▶). The data were normalized using a set of prelabeled control genes to adjust for variations in individual array intensity (see Materials and Methods). Because the variation between duplicates was very low (R2 was greater than 0.97), duplicate expression results were averaged for the following analyses. For all the expression values less than zero (i.e., transcript was not detectable), we treated the average difference as “1” for convenience of analysis.
TABLE 1.
Summary of absolute callsa of 4335 ORFs and RSQb values of the data sets
| W0 | W15 | W45 | |
| Absolute call | 2281/75/1979 | 2720/84/1531 | 2790/88/1457 |
| (P/M/A) | 2224/146/1965 | 2499/147/1689 | 2452/132/1751 |
| RSQ | 0.98 | 0.97 | 0.98 |
| A0 | A15 | A45 | |
| aAbsolute calls (decision on presence, absence, etc., of signals based on analysis of data from microarrays). P, present; M, marginal: A, absent, undetected. Duplicate samples for each strain and time point. | |||
| bRSQ value means the square of the Pearson product moment correlation coefficient through data points in two parallel duplicate experiments. In this experiment, the RSQ values of the whole data sets (9788 probes) and those of the 4335 genes are very close to each other as shown in the table. Duplicate samples are shown for absolute calls. | |||
| Absolute call | 2643/95/1597 | 2555/72/1708 | 2633/105/1597 |
| (P/M/A) | 2235/160/1940 | 2558/103/1674 | 2594/110/1631 |
| RSQ | 0.97 | 0.99 | 0.99 |
Expression levels of C5 mRNA in wild type decreased about twofold when the cells were transferred from 30°C to 43°C and the level of M1 RNA increased slightly (<40%). However, the levels of both C5 and M1 RNAs decreased approximately twofold in A49 at the higher temperature (Fig. 1C ▶). Northern blot data (Fig. 1D ▶) suggest a similar pattern. The relatively minor changes in expression of M1 RNA and C5 mRNA indicate that A49 is temperature sensitive because it is unable to assemble enough active enzyme, rather than simply because of an insufficient supply of an essential component, as with many other ts strains (Baer et al. 1989).
Gene function groups
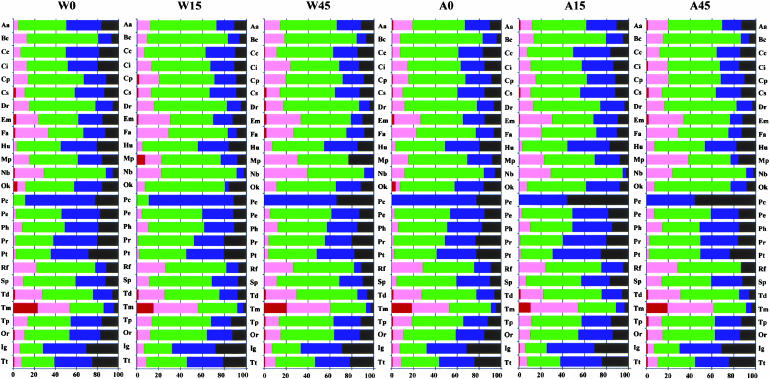
An overview of the expression density of the major gene functional groups proposed by Blattner et al. (1997) obviously changes in significant ways in this study: The group of “translation, post-translational modification” shows the highest expression, whereas that of the group of “putative chaperones” the lowest (Fig. 2 ▶; Table 2 ▶). It should be noted that intergenic regions are also moderately expressed and their expression level is higher than some of the functional groups (e.g., hypothetical, unclassified, unknown, putative chaperones, enzymes, regulatory proteins, and transport proteins whose functions are not well defined).
FIGURE 2.
Schematic representation of the gene expression of different functional groups. The abbreviations of functional groups are shown in Table 2 ▶. Red bar denotes percentage of genes whose signals are >10,000; pink between 1000 and 10,000; green between 100 and 1000; blue between 10 and 100; and black, <10.
TABLE 2.
| Function group | Abbreviation |
| Amino acid biosynthesis and metabolism | Aa |
| Biosynthesis of cofactors, prosthetic groups and carriers | Bc |
| Carbon compound catabolism | Cc |
| Cell processes (incl. adaptation, protection) | Cp |
| Cell structure | Cs |
| Central intermediary metabolism | Ci |
| DNA replication, recombination, modification, repair | Dr |
| Energy metabolism | Em |
| Fatty acid and phospholipid metabolism | Fa |
| Hypothetical, unclassified, unknown | Hu |
| Membrane proteins | Mp |
| Nucleotide biosynthesis and metabolism | Nb |
| Other known genes | Ok |
| Phage, transposon, or plasmid | Ph |
| Putative chaperones | Pc |
| Putative enzymes | Pe |
| Putative regulatory proteins | Pr |
| Putative transport proteins | Pt |
| Regulatory function | Rf |
| Structural proteins | Sp |
| Transcription, RNA processing and degradation | Td |
| Translation, post-translational modification | Tm |
| Transport and binding proteins | Tp |
| Total genes known ORFs (Blattner et al. 1997) | Or |
| Intergenic Regions | Ig |
| Total probes | Tt |
For each wild type:wild type, A49:A49, or wild type:A49 comparison, ∼40% of the known ORFs changed more than twofold with each other, although it is unclear how many of these changes have biological significance (Fig. 3 ▶). If wild type is heat shocked for 15 min, 31% of the total genes show an increase and 10% show a decrease (W15 versus W0). The groups of “amino acid biosynthesis and metabolism” and related gene function clusters show significant increase (>35% of the genes are elevated). “Membrane proteins” and putative chaperones show no decrease in expression. If heat shocked longer (45 min), the trends remain the same except that membrane proteins and putative chaperones show some decrease (W45 versus W0).
FIGURE 3.
Pair comparison of gene expression between W15 and W0, W45 and W0, W45 and W15, A15 and A0, A45 and A0, A45 and A15, and A0 and W0. Red bar denotes the percentage of genes increased more than twofold comparing W15 with W0 (or other pairs), while green is a decreasing percentage.
If A49 is heat shocked for 15 min, 18% of the total genes show increased expression and 22% show decreased expression (A15 versus A0). About 36% of the genes in “nucleotide biosynthesis and metabolism” and “phage, transposon, or plasmid” show a significant increase, whereas “putative enzymes” and “transport and binding protein” show strong decreases. If heat shocked longer (45 min), 25% of the total genes show increased expression and 15% show decreased expression (A45 versus A0).
The largest gene expression increases between A49 and WT at 30°C are found in the “amino acid biosynthesis and metabolism” group, which includes the hisG-I operon (discussed below).
Essential and nonessential genes
Essential genes are defined as those genes that cannot be deleted from the chromosome without causing cell death (Peluso et al. 2000). There are 232 essential and 2373 nonessential genes characterized in E. coli (from the “Profiling E. coli Chromosome” Web site www.shigen.nig.ac.jp/ecoli/pec). The genes in this database are characterized as essential or nonessential based largely on experimental (null mutations) evidence, whereas a much smaller number of genes were designated based on their known function (Peluso et al. 2000). Although the essentiality of 1804 genes are still undetermined, the information currently available is enough to make some useful analyses.
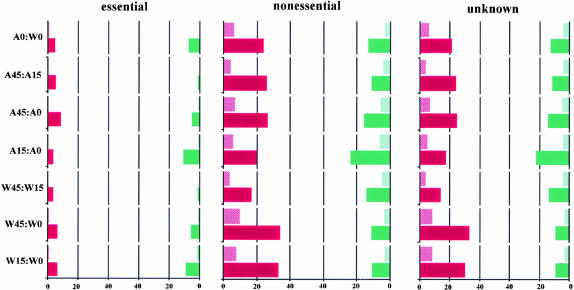
Only 55 essential genes show more than a twofold change in either of expression pair comparisons between A49 and WT. In our study, none of the 59 genes that show the most significant expression changes (more than a 50-fold change, with an average difference >1000) is classified as an essential gene. Essential genes show fewer changes than nonessential genes, both in terms of numbers of genes and percentage of these genes changed (Fig. 4 ▶).
FIGURE 4.
Essential gene analysis. A comparison of A0 with W0 (or other pairs). The solid red bar denotes the percentage of genes whose signals have increased more than twofold, and the adjacent hatched red bar means more than 10-fold increase, while the facing green ones are for decreasing percentage.
One explanation for the lethality of the A49 ts mutation is that impaired RNase P fails to process an essential gene precursor RNA. The essential gene, ffs, the gene encoding 4.5S RNA, shows an increase of 12-fold (A45 versus A0). The build-up of 4.5S RNA suggests that this RNA is not being processed correctly for its functional form, although the probe does measure precursor as well as mature 4.5S RNA. Another essential gene with high expression level changes encodes tRNALeu (leuW [4.4-fold; A45 versus A0]). tmRNA increases only slightly in A49 at 43°C. Precursors to these RNAs are substrates of RNase P.
The death of A49 at restrictive temperatures could be caused by a build-up of several nonessential gene products that overwhelm cell metabolism. These gene products may be substrates for RNase P or, hypothetically, may require RNase P products to function properly. In this study, only ffs as an essential gene shows significant expression increases (e.g., >fivefold: A45 versus A0). Two hundred fifty-three of the nonessential genes (11% of the total nonessential genes) had expression levels increased by more than fivefold (A45 versus A0). The highest expression level increase of one nonessential gene is dmsA (encoding anerobic dimethyl sulfoxide reductase subunit A), which showed a 1400-fold increase in A49 after 45 min at the restrictive temperature and is not known to be an RNase P substrate.
Gene clustering reveals novel RNase P substrates
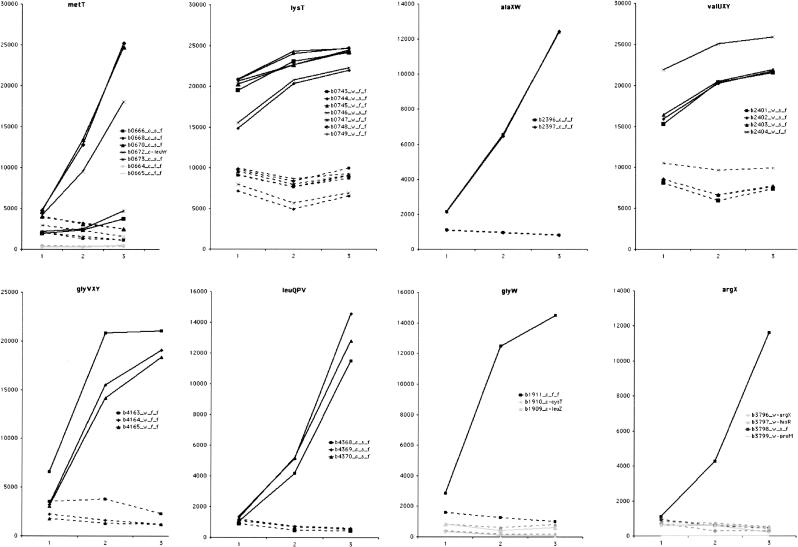
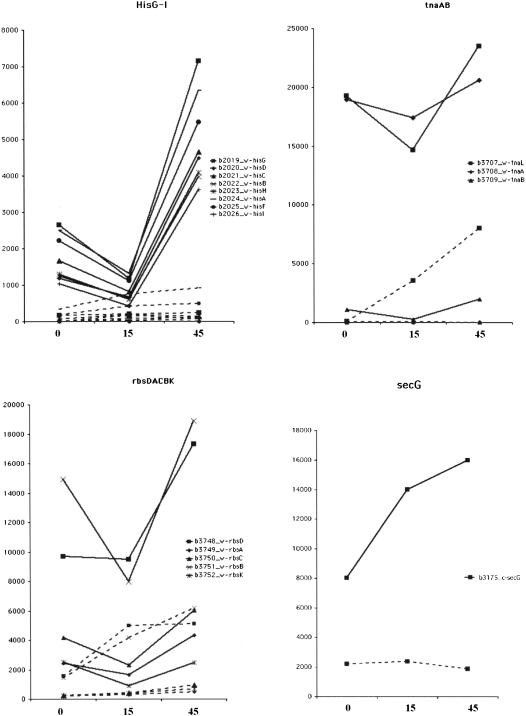
Hierarchical clustering of the expression data was generated by the program Cluster 2.1 and viewed by Tree View (Eisen et al. 1998). A cluster of genes that are expressed at a constant low level in wild type but dramatically increase in A49 under heat shock conditions (Figs. 5, 6 ▶ ▶) was revealed. This cluster of A49 genes contains at least two of the known substrates of RNase P. One substrate is the hisG-I polycistronic mRNA, the other is a group of tRNAs (the high sequence homology of some isoacceptor tRNAs prevents their precise identification by DNA microarray [Figs. 5, 6 ▶ ▶]). This cluster contains 17 genes that encode proteins: eight from the hisG-I operon, three from the tnaAB operon, five from the rbsDACBK operon and secG. Two hypothetical transcripts, b0669 and b0671 (Fig. 6A ▶) are also enclosed in this cluster.
FIGURE 5.

Gene cluster representation generated by Cluster 2.1 (Eisen et al. 1998): red for higher expression, green for lower expression. 1–6 denotes data for W0, W15, W45, A0, A15, and A45.
FIGURE 6.
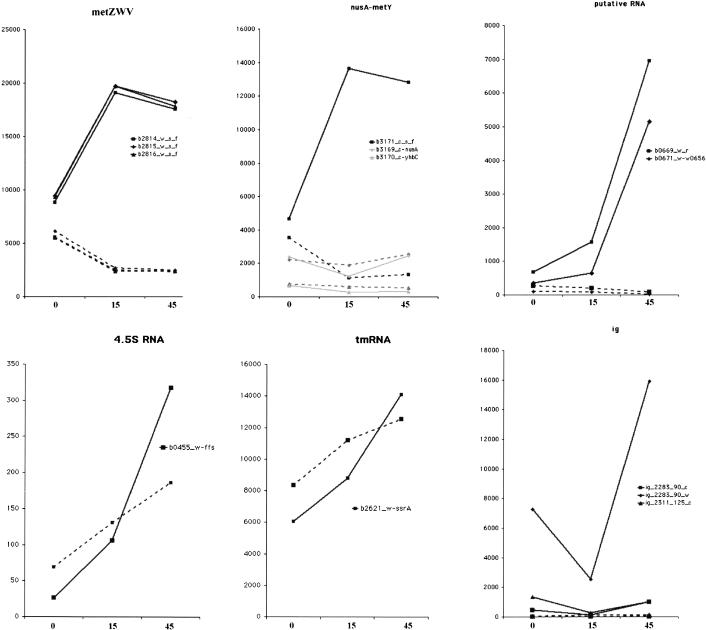
Graphic representation of gene expression in various gene clusters. Different genes are labeled by different symbols: solid line, A49; dashed line, WT. The symbols in each panel represent the species followed. Two known RNase P substrates (4.5S RNA and tmRNA) are also shown here, although they are not part of these clusters.
For the hisG-I operon, all eight genes (hisG, hisD, hisC, hisB, hisH, hisA, hisF, and hisI) show similar patterns: they are expressed at low levels in wild type and at higher levels in strain A49. At 30°C (A0) his operon expression is moderately elevated in A49 relative to wild type, but expression is dramatically increased when A49 is shifted to 43°C for 45 min (A45). A strikingly similar pattern could be found in tnaAB and rbsDACBK operons (Fig. 6C ▶), as well as some intergenic regions such as ig_2283_90_w (Fig. 6A ▶).
The latter cluster also contains 29 tRNAs that belong to 10 polycistronic operons (metT, metZWV, nusA-metY, glyVXY, glyW, lysT, alaXW, valUXY, leuQPV, argX). It should be noted that all six genes of methionine tRNA (metT [Fig. 7 ▶] and metU in the metT operon, metZ, metW, metV in the metZWV operon, and metY in the nusA-metY operon) in the E. coli are in this cluster. tRNAMet is the only type of tRNA for which all genes of the isoacceptors are in this expression cluster. The probe measures precursor tRNAMet as well as mature tRNAMet so the results show that maturation of tRNAs by RNase P may be tightly coordinated with translation initiation. There is only one essential gene in this gene cluster: b0672_c_leuW in the metT operon (Fig. 6B ▶), which is the only copy of tRNALeu with the anticodon UAG in the chromosome.
FIGURE 7.
The metT operon region of the E. coli chromosome (starting at 695,653 and ending at 696,356). The chromosome is shown as a double stranded line. The genes are shown as lines with arrowheads and the arrows point to the transcription start orientation. The starting and ending nucleotides of each gene are shown by the last three digits of the real numbers.
Unknown small RNA species related to RNase P
In addition to covering >4000 known genes (ORFs), the high-density DNA microarrays we used in this study contain probes that interrogate ∼5000 intergenic regions of the E. coli genome. This comprehensive coverage provides an efficient method for detecting the expression of unknown genes encoding either proteins or small RNAs (Tjaden et al. 2002).
Some intergenic regions are shown in Table 3 ▶. The expression of these regions changed >50-fold between any two samples of wild type and A49, and have an average difference of at least 1000 at one of the time points. We included the intergenic data sets for gene clustering analysis. We found the probe for ig_2283_90_w was in the same gene cluster as the hisG-I operon (Fig. 6A ▶). In addition to ig_2283_90_w, there are five intergenic region probes that show highly elevated expression in at least one time point in A49 (e.g., ig_2282_205_c, ig_2282_205_w, ig_2283_90_c, ig_2311_125_c, and ig_2492_242_w). Using a Northern blot analysis, we have confirmed that the expression of ig_2283_90_w is highly expressed in A49 but is not detectable in wild type (see Fig. 8 ▶, as discussed below), although the exact length of this intergenic transcript is still unknown.
TABLE 3.
Signal amounts for intergenic region sequences as determined by microarray analysis
| Intergenic regionsa | W0 | W15 | W45 | A0 | A15 | A45 |
| ig_1591_304_c | 44 | 70 | 1471 | 3 | 802 | 611 |
| ig_2001_47_c | 15 | 1857 | 18 | 183 | 280 | 32 |
| ig_2002_78_c | 94 | 7912 | 136 | 1252 | 1065 | 365 |
| ig_2157_63_c | 1 | 87 | 1429 | 12 | 30 | 331 |
| ig_2158_103_c | 22 | 2277 | 18309 | 24 | 474 | 8823 |
| ig_2158_103_w | 22 | 451 | 3968 | 1 | 71 | 1882 |
| ig_2160_798_w | 1 | 346 | 6050 | 36 | 387 | 3231 |
| ig_2161_338_w | 34 | 200 | 3872 | 75 | 169 | 1394 |
| ig_2282_205_c | 21 | 229 | 459 | 2622 | 1103 | 4345 |
| ig_2282_205_w | 22 | 2126 | 3961 | 17674 | 11475 | 24984 |
| ig_2283_90_c | 16 | 12 | 1 | 440 | 110 | 1002 |
| ig_2283_90_w | 15 | 14 | 39 | 7283 | 2527 | 15923 |
| ig_2311_125_c | 51 | 116 | 117 | 1331 | 252 | 1002 |
| ig_2489_153_c | 1175 | 23 | 1838 | 9054 | 58 | 83 |
| ig_2492_242_c | 136 | 1 | 324 | 1623 | 5 | 1 |
| ig_2492_242_w | 721 | 13 | 1632 | 5576 | 24 | 30 |
| ig_2547_77_c | 1 | 27 | 1618 | 1 | 1 | 274 |
| ig_2671_64_c | 4 | 1112 | 20 | 22 | 90 | 13 |
| ig_2672_1146_c | 12 | 2893 | 14 | 49 | 148 | 19 |
| ig_327_59_w | 3 | 38 | 601 | 1 | 7 | 3518 |
| ig_407_69_w | 14 | 806 | 1228 | 133 | 702 | 2437 |
| ig_611_184_w | 38 | 99 | 2033 | 1 | 1 | 552 |
| ig_927_155_c | 7 | 203 | 5534 | 22 | 20 | 1548 |
| ig_927_155_w | 9 | 72 | 1010 | 6 | 12 | 332 |
aConvention according to Affymetrix, Inc.
FIGURE 8.
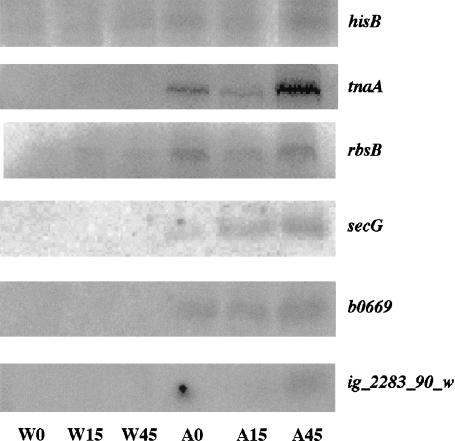
Northern blot analysis of expression of genes from several gene clusters. RNAs, 10 μg from each of six samples (W0, W15, W45, A0, A15, A45), were loaded on a 4% polyacrylamide or a 3% agarose gels and transferred to nylon membranes. The membranes were probed by oligonucleotides complementary to the (putative) mRNA sequences of hisB, tnaA, rbsB, secG and ig_2283_90_w.
Northern blot analysis of the target genes
Northern blot analysis was also used to confirm the gene expression patterns of several genes (hisB, tnaA, rbsB, secG, ig_2283_90_w) that showed elevated expression in strain A49 at restrictive temperatures (Fig. 8 ▶). The results correlate very well with the DNA microarray data that showed elevated expression at the 45-min time point (Fig. 6C ▶). To test whether the hisG-I, tnaAB, and rbsDACBK could be cleaved by RNase P, total RNA from the 45-min time point was incubated alone and supplemented with RNase P. No visible breakdown of these mRNAs was detected by Northern blots in the absence or presence of the enzyme (data now shown). However, when the mRNAs were incubated with both RNase P and RNase E, some bands appeared to be stronger than those cleaved by RNase E alone (Fig. 9 ▶). This result suggested that RNase P might not directly cut the polycistronic mRNAs, but instead works subsequently with RNase E in segmental stabilization or degradation of mRNAs (Alifano et al. 1994).
FIGURE 9.
Northern blot analysis of total RNA incubated with RNase P and RNase E. RNAs (10 μg) from A45 were incubated at 37°C for 15 min with RNase P (0.05 μM M1 RNA and 0.5 μM C5 protein) or with 2.5 μg/mL of RNase E. The reaction was terminated by addition of phenol/9 M urea and applied to a 6% polyacrymide gel. Northern blot analysis was then performed using the oligonucleotides probing for hisB, tnaA and rbsB. (Lane l) control reaction without enzymes; (lane 2) total RNAs with RNase P; (lane 3) total RNAs with RNase E; (lane 4) total RNAs with RNase P and RNase E.
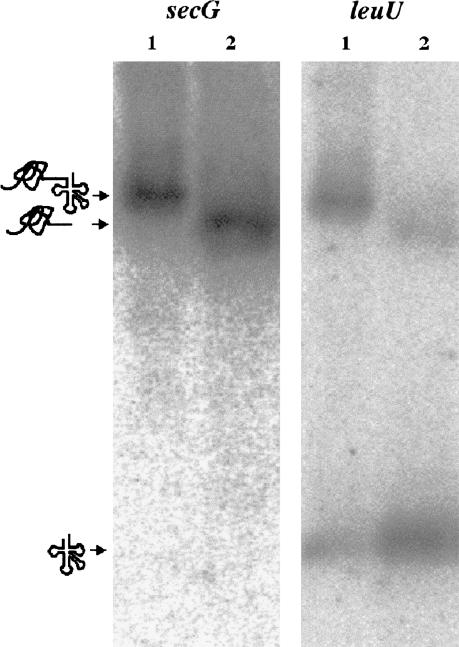
The secG mRNA can be cleaved by RNase P (Fig. 10 ▶). Northern blot analysis with an oligonucleotide downstream probing a leuU (tRNALeu) gene revealed that the cleaved substrate was a precursor tRNA downstream of the secG mRNA. Thus, the secG mRNA is effectively a 5′ leader sequence for the tRNALeu substrate. This example underscores that the elevated levels of some mRNAs and tRNAs in A49 may not result from normal up-regulation of transcription of some genes, but are due to the inability of RNase P to process or degrade those transcripts.
FIGURE 10.
The same transcript contains secG and leuU. RNA (10 μg) from A45 were incubated at 37°C for 15 min without RNase P (lane 1) or with RNase P (lane 2: 0.05 μM M1 RNA, 0.5 μM C5 protein) and then were loaded onto a 3% agarose gel. Northern blot was performed using the oligonucleotides complementary to 26 nucleotides at the 3′ end of the genes coding for secG and leuU, respectively.
The microarray results also showed the increased expression of one intergenic region, b0669 (Fig. 6A ▶), which is on the complementary strand to glnU (Fig. 7 ▶). A Northern blot of total RNA extracted from A49 at the restrictive temperature did show a transcript of length >350 nt that contained b0669 (Fig. 7 ▶) but no indication that this RNA was cleaved by RNase P could be detected. RNase E, however, did appear to cleave this RNA. The intergenic region b0671 was also overexpressed in A49 (Fig. 6A ▶) and is complementary to leuW and metT (Fig. 7 ▶). According to the results of the microarray analysis, there is some uncertainty regarding the reality of the b0671 transcript. Northern blots, to date, have failed to determine that this transcript can easily be detected. A transcript from a cloned fragment that contained b0669 and b0671 (∼300 nt) was also cleaved by RNase E, as did a smaller transcript cloned from a shortened fragment that contained b0669 alone (data not shown).
DISCUSSION
A single nucleotide mutation in the rnpA gene, which codes for the C5 protein subunit of RNase P in E. coli, results in an arginine-to-histidine alteration at position 46 in its protein sequence (R46H; Kirsebom et al., 1988). The strain with this mutation, A49, is unable to grow above 43°C and shows an accumulation of precursor tRNAs when shifted from a permissive to the nonpermissive temperature (Fig. 1 ▶; Schedl and Primakoff 1973). The assembly of the mutant protein with M1 RNA has been reported (Baer et al. 1989), but how the resulting enzyme affects global expression changes in E. coli is unknown. In this report, we have used DNA microarray technology as a useful tool in studying global expression patterns in response to a number of different growth conditions in E. coli A49 (Richmond et al. 1999; Khodursky et al. 2000; Selinger et al. 2000; Hung et al. 2002; Lehnen et al. 2002; Oh et al. 2002; Oshima et al. 2002; Schembri et al. 2002; Tani et al. 2002 ), which is temperature sensitive and defective in RNase P.
After temperature shift from 30°C to 43°C, gene expression patterns in wild type and A49 are quite different. Wild-type cells shifted from 30°C to 43°C showed accelerated cell growth accompanied by increased expression of genes in the amino acid biosynthesis and metabolism and other functional groups. The increased expression of metabolically important genes was possibly a response to rapid cell division that increased requirements for DNA and RNA synthesis. In contrast, the A49 strain at the higher temperature did not show accelerated growth and began to senesce.
The level of 4.5S RNA expression is the most elevated among all essential genes when A49 is transferred to 43°C for 45 min. The 4.5S RNA is part of a ribonucleoprotein complex and is thought to have a catalytic role as well as a regulatory role in protein synthesis (Peluso et al. 2000). Because the precursor to 4.5S RNA is a RNase P substrate, this result supports the notion that cell death of A49 at the restrictive temperature is directly due to the impaired essential catalytic activity of RNase P.
The expression data sets were analyzed with the program Cluster 2.1. This program clusters genes based on similarities in expression patterns and graphically presents the data using dendrograms. Comparison of global expression data from Saccharomyces cerevisiae using this software found that genes having similar function often cluster together (Eisen et al. 1998). Applying this software to our data sets revealed an intriguing gene cluster consisting of 49 genes that were expressed at a constant low level in wild type and were expressed at elevated levels in A49 under heat-shock conditions. This cluster contained several known substrates of RNase P including the hisG-I operon and tRNAs.
All 29 tRNAs in this gene cluster are transcribed as polycistronic operons. The elevated levels of these tRNAs in A49 can be explained by the inability of RNase P to process the tRNA precursors. Because the tRNAs are reverse transcribed into cDNA and fragmented before hybridization, the microarray without oligonucleotides covering the precursor sequence cannot discriminate between precursor tRNA and mature tRNA. Thus, the accumulation of precursor tRNAs initially appears as if strain A49 is overexpressing these genes.
The same principle can be applied to the elevated expression levels we observe for the hisG-I operon. RNase P and RNase E are both thought to be involved in the segmental processing of this polycistronic mRNA (Alifano et al. 1994). These results corroborate the suggestion that RNase P and RNase E work in concert to process this operon and others (tnaAB and rbs DACBK) in E. coli. A recent report suggests that RNase E is also involved in the initiation of tRNA maturation through cleavage of both polycistronic and monocistronic operons of tRNAs (Ow and Kushner 2002).
The accumulation of additional transcripts in strain A49 suggests that RNase P could process many more precursor RNAs than was originally thought. One example is the tnaAB operon. The tnaAB operon consists of three genes: tnaL (a leader peptide), tnaA (tryptophanase), and tnaB. The products of these genes are involved in tryptophan degradation and are usually up-regulated with the addition of tryptophan, which is not the case in this study (Khodursky et al. 2000). In another case, the immediate upstream gene rbsR, the repressor for rbsDACBK operon, did not show significant changes in all six samples, while this polycistronic mRNA accumulated in A49 (Fig. 6C ▶). Northern blot analysis has shown that RNase P may follow cleavage by RNase E in the processing of these operons (Fig. 9 ▶). This observation, along with earlier demonstration of hisG-I operon (Alifano et al. 1994), suggests that RNase P and RNase E may be coordinated in the maturation or degradation of many polycistronic mRNAs and tRNAs. However, we have recently shown that three transcripts of ∼1.1, 1.9, and 3 kb in length from the tnaAB operon, but not including the whole operon, are cleaved by purified RNase E but not by RNase P (data not shown).
Clustering analysis originally identified the mRNA of secG as a putative substrate of RNase P (Fig. 10 ▶). However, there is a tRNA gene, leuU, downstream from secG, the first base of which is just 15 nucleotides away from the stop codon of secG (Blattner et al. 1997). By probing with oligonucleotides against secG and leuU, we found that leuU and secG are in the same operon. They share the same −35 and −10 sequence upstream of secG, and the terminator sequence downstream of leuU. Although there is a −35 and −10 sequence inside the secG coding sequence, a protein essential for the excretion of peptides, which was thought to be a promoter region for leuU, it is quite far upstream (−130) from the starting base of leuU . Although the distance from the promoter sequence to the structural gene of most tRNA genes is ∼35, the promoter sequence to leuU inside secG is the only case where the distance is >60 nucleotides (Komine et al. 1990). It is unlikely that E. coli will use this promoter to transcribe a 87-nucleotide tRNA and a 130-nucleotide 5′ leader. We did not detect the proposed ∼200-nucleotide RNA by Northern blot (Fig. 10 ▶).
The putative RNAs, b0669 and b0671, are complementary to a seven tRNA-containing metT operon. Their RNA structures may contain a negative strand complement of several tRNAs. For b0669, a role in regulating the amount of glnU in the cell seems likely as the amount of RNase P becomes defective. No other function, in the absence of cleavage by RNases P or E, is apparent. The amount of the transcript of b0671 has yet to be determined. Transcripts of several small RNAs that are not cleaved by RNase P may be involved in functions associated with cell death. Such an hypothesis is being investigated.
MATERIALS AND METHODS
Bacteria strains
E. coli NHY312 (Δ(proBlac), ara, gyrA, thi, zic-501::Tn10, rnpA+; referred to as wild type) and NHY322 (Δ(proBlac), ara, gyrA, thi, zic-501;:Tn10, rnpA−; referred to as A49) are derivatives of the same original strain UY211 (Δ(problac), ara gyrA, thi (Kirsebom et al. 1988). The only difference between their genotypes is the gene encoding C5 protein (rnpA) of A49. This gene has a single nucleotide mutation, G → A, leading to an amino acid substitution from arg to his at position 46 of its protein sequence (Kirsebom et al. 1988).
Cell culture
Overnight cultures grown in rich medium (LB) at 30°C were diluted 100-fold into fresh medium and incubated at 30°C with agitation until OD600 nm reached 0.25. (One unit of OD600 nm contains ∼2 × 10⁸ cells/mL of media at 30°C.) Aliquots of cells (6 mL) were shifted to 43°C for different time periods before the addition of an equal volume of phenol for RNA extraction. An aliquot of 100 μL was diluted into cold LB (4°C) and diluted further before spreading onto LB plates for assays of living cells.
RNA preparation
RNAs were extracted from cells by addition of phenol, phenol: chloroform, and chloroform. The RNA was precipitated with ethanol. The pellets were washed with 70% ethanol and resuspended into 100 μL of 1× One-Phor-All buffer (10 mM Tris-acetate at pH 7.5, 10 mM magnesium acetate, and 50 mM potassium acetate, Amersham Pharmacia). DNase I was added to a final concentration of 0.1 units/μL and incubated at 37°C for 15 min to eliminate any chromosomal DNA contamination. The RNA samples were cleaned up with Qiagen RNeasy Mini Kit.
cDNA synthesis and labeling
Synthesis of cDNA was based on a recent protocol (Rosenow et al. 2001). Briefly, 10 μg of total RNA was reverse transcribed using Superscript II system (GIBCO) for the first strand cDNA synthesis with 750 ng of random hexamers in a total volume of 60 μL. RNAs were removed by RNase H and RNase A. The cDNA was then purified by Qiagen cDNA purification kit and fragmented by incubating 5 μg of the cDNA and 0.8 μ DNase I for 10 min at 37°C. The reaction was stopped by incubation at 99°C for 10 min. The majority of fragments were found to be <200 bp by resolving a digest aliquot on a 1% agarose gel. The fragmented cDNA was 3′-end labeled with biotin-N6-ddATP (NEN) by terminal transferase (Roche Molecular Biochemicals). Duplicate reactions were performed for each time point.
Hybridization and staining
Fragmented, labeled cDNA was hybridized to Affymetrix E. coli antisense arrays in 1× GeneChip hybridization solution (100 mM MES, 1 M NaCl, 20 mM EDTA, and 0.01% Tween 20 at pH 6.6). Herring sperm DNA (0.1 mg/mL final concentration; Promega) and acetylated BSA (0.5 mg/mL final concentration; Invitrogen) were added to minimize nonspecific hybridization. Samples were heated to 99°C for 5 min, incubated 5 min at room temperature, and placed into the array cartridge. Hybridization was carried out at 45°C for 16 h with constant rotation. Arrays were washed in an Affymetrix Fluidics Station following standard GeneChip expression protocols. Staining was performed by first adding streptavidin (10 μg/mL) followed by goat IgG (0.1 mg/mL final concentration) and biotinylated antistreptavidin antibody (5 μg/mL final concentration; Vector Laboratories). The final stain contained fluorescent streptavidin-phycoerythrin (SAPE, final concentration 10 μg/mL; Molecular Probes). After staining, the chips were scanned at 570 nm on a confocal laser scanner with 3 μm resolution.
Data processing and analysis
Array data analysis was performed using MicroArray Suite 4.0 software (Affymetrix) as described in the GeneChip expression manual. Variation between individual microarrays was accounted for by adding fragmented and labeled DNA for several control genes (e.g., λ phage gene CreX and HIV gene HXB2) to the hybridization master mix. The intensity of the control genes was averaged for each array and compared to the control average of all arrays to create a scaling factor for each chip. The Average Difference (the average intensity of a probe set containing 15 perfect match and 15 mismatch probe pairs per gene) of each chip was multiplied by the scaling factor to account for any chip-to-chip intensity variation. All scaling factors ranged between 0.8 and 1.1. The expression data for duplicates was averaged into a single value and sorted by the largest fold-expression changes to look for possible RNase P-related genes (see Results). Likely candidate genes were further analyzed by examination of the array image to confirm the accuracy of expression levels.
Acknowledgments
We are grateful to Dr. George Mackie (University of British Columbia) for a gift of RNase E and we thank Dr. L.S. Lerman (MIT) and our colleagues for helpful discussions. We also thank the members of the Keck Facilities Center at Yale University for useful help with microarrays. This work was funded by United States Public Health Service grant GM19422 to S.A.
The publication costs of this article were defrayed in part by payment of page charges. This article must therefore be hereby marked “advertisement” in accordance with 18 USC section 1734 solely to indicate this fact.
Article and publication are at http://www.rnajournal.org/cgi/doi/10.1261/rna.2198203.
REFERENCES
- Alifano, P., Rivellini, F., Piscitelli, C., Arraiano, C.M., Bruni, C.B., and Carlomagno, M.S. 1994. Ribonuclease E provides substrates for ribonuclease P-dependent processing of a polycistronic mRNA. Genes & Dev. 8: 3021–3031. [DOI] [PubMed] [Google Scholar]
- Baer, M.F., Wesolowski, D., and Altman, S. 1989. Characterization in vitro of the defect in a temperature-sensitive mutant of the protein subunit of RNase P from Escherichia coli. J. Bacteriol. 171: 6862–6866. [DOI] [PMC free article] [PubMed] [Google Scholar]
- Blattner, F.R., Plunkett 3rd, G., Bloch, C.A., Perna, N.T., Burland, V., Riley, M., Collado-Vides, J., Glasner, J.D., Rode, C.K., Mayhew, G.F., et al. 1997. The complete genome sequence of Escherichia coli K-12. Science 277: 1453–1474. [DOI] [PubMed] [Google Scholar]
- Eisen, M.B., Spellman, P.T., Brown, P.O., and Botstein, D. 1998. Cluster analysis and display of genome-wide expression patterns. Proc. Natl. Acad. Sci. 95: 14863–14868. [DOI] [PMC free article] [PubMed] [Google Scholar]
- Gopalan, V., Vioque, A., and Altman, S. 2002. RNase P: Variations and uses. J. Biol. Chem. 277: 6759–6762. [DOI] [PubMed] [Google Scholar]
- Guerrier-Takada, C., Gardiner, K., Marsh, T., Pace, N., and Altman, S. 1983. The RNA moiety of ribonuclease P is the catalytic subunit of the enzyme. Cell 35: 849–857. [DOI] [PubMed] [Google Scholar]
- Hung, S.P., Baldi, P., and Hatfield, G.W. 2002. Global gene expression profiling in Escherichia coli K12: The effects of leucine-responsive regulatory protein. J. Biol. Chem. 277: 40309–40323. [DOI] [PubMed] [Google Scholar]
- Khodursky, A.B., Peter, B.J., Cozzarelli, N.R., Botstein, D., Brown, P.O., and Yanofsky, C. 2000. DNA microarray analysis of gene expression in response to physiological and genetic changes that affect tryptophan metabolism in Escherichia coli. Proc. Natl. Acad. Sci. 97: 12170–12175. [DOI] [PMC free article] [PubMed] [Google Scholar]
- Kirsebom, L.A., Baer, M.F., and Altman, S. 1988. Differential effects of mutations in the protein and RNA moieties of RNase P on the efficiency of suppression by various tRNA suppressors. J. Mol. Biol. 204: 879–888. [DOI] [PubMed] [Google Scholar]
- Komine, Y., Adachi, T., Inokuchi, H., and Ozeki, H. 1990. Genomic organization and physical mapping of the transfer RNA genes in Escherichia coli K12. J. Mol. Biol. 212: 579–598. [DOI] [PubMed] [Google Scholar]
- Lehnen, D., Blumer, C., Polen, T., Wackwitz, B., Wendisch, V.F., and Unden, G. 2002. LrhA as a new transcriptional key regulator of flagella, motility and chemotaxis genes in Escherichia coli. Mol. Microbiol. 45: 521–532. [DOI] [PubMed] [Google Scholar]
- Oh, M.K., Rohlin, L., Kao, K.C., and Liao, J.C. 2002. Global expression profiling of acetate-grown Escherichia coli. J. Biol. Chem. 277: 13175–13183. [DOI] [PubMed] [Google Scholar]
- Oshima, T., Wada, C., Kawagoe, Y., Ara, T., Maeda, M., Masuda, Y., Hiraga, S., and Mori, H. 2002. Genome-wide analysis of deoxyadenosine methyltransferase-mediated control of gene expression in Escherichia coli. Mol. Microbiol. 45: 673–695. [DOI] [PubMed] [Google Scholar]
- Ow, M.C. and Kushner, S.R. 2002. Initiation of tRNA maturation by RNase E is essential for cell viability in E. coli. Genes & Dev. 16: 1102–1115. [DOI] [PMC free article] [PubMed] [Google Scholar]
- Peluso, P., Herschlag, D., Nock, S., Freymann, D.M., Johnson, A.E., and Walter, P. 2000. Role of 4.5S RNA in assembly of the bacterial signal recognition particle with its receptor. Science 288: 1640–1643. [DOI] [PubMed] [Google Scholar]
- Richmond, C.S., Glasner, J.D., Mau, R., Jin, H., and Blattner, F.R. 1999. Genome-wide expression profiling in Escherichia coli K-12. Nucleic Acids Res. 27: 3821–3835. [DOI] [PMC free article] [PubMed] [Google Scholar]
- Rosenow, C., Saxena, R.M., Durst, M., and Gingeras, T.R. 2001. Prokaryotic RNA preparation methods useful for high density array analysis: comparison of two approaches Nucleic Acids Res. 29: e112. [DOI] [PMC free article] [PubMed] [Google Scholar]
- Schedl, P. and Primakoff, P. 1973. Mutants of Escherichia coli thermosensitive for the synthesis of transfer RNA. Proc. Natl. Acad. Sci. 70: 2091–2095. [DOI] [PMC free article] [PubMed] [Google Scholar]
- Schembri, M.A., Ussery, D.W., Workman, C., Hasman, H., and Klemm, P. 2002. DNA microarray analysis of fim mutations in Escherichia coli. Mol. Genet. Genomics 267: 721–729. [DOI] [PubMed] [Google Scholar]
- Selinger, D.W., Cheung, K.J., Mei, R., Johansson, E.M., Richmond, C.S., Blattner, F.R., Lockhart, D.J., and Church, G.M. 2000. RNA expression analysis using a 30 base pair resolution Escherichia coli genome array. Nature Biotechnology 18: 1262–1268. [DOI] [PubMed] [Google Scholar]
- Tani, T.H., Khodursky, A., Blumenthal, R.M., Brown, P.O., and Matthews, R.G. 2002. Adaptation to famine: A family of stationary-phase genes revealed by microarray analysis. Proc. Natl. Acad. Sci. 99: 13471–13476. [DOI] [PMC free article] [PubMed] [Google Scholar]
- Tjaden, B., Saxena, R.M., Stolyar, S., Haynor, D.R., Kolker, E., and Rosenow, C. 2002. Transcriptome analysis of Escherichia coli using high-density oligonucleotide probe arrays. Nucleic Acids Res. 30: 3732–3738. [DOI] [PMC free article] [PubMed] [Google Scholar]


