Abstract
We present a new microRNA target prediction algorithm called TargetBoost, and show that the algorithm is stable and identifies more true targets than do existing algorithms. TargetBoost uses machine learning on a set of validated microRNA targets in lower organisms to create weighted sequence motifs that capture the binding characteristics between microRNAs and their targets. Existing algorithms require candidates to have (1) near-perfect complementarity between microRNAs’ 5′ end and their targets; (2) relatively high thermodynamic duplex stability; (3) multiple target sites in the target’s 3′ UTR; and (4) evolutionary conservation of the target between species. Most algorithms use one of the two first requirements in a seeding step, and use the three others as filters to improve the method’s specificity. The initial seeding step determines an algorithm’s sensitivity and also influences its specificity. As all algorithms may add filters to increase the specificity, we propose that methods should be compared before such filtering. We show that TargetBoost’s weighted sequence motif approach is favorable to using both the duplex stability and the sequence complementarity steps. (TargetBoost is available as a Web tool from http://www.interagon.com/demo/.)
Keywords: miRNA target prediction, genetic programming, boosting, machine learning
INTRODUCTION
MicroRNAs (miRNAs) belong to an abundant class of short noncoding RNAs (Lagos-Quintana et al. 2001; Lau et al. 2001; Lee and Ambros 2001) shown to mediate suppression of protein translation (Moss et al. 1997; Olsen and Ambros 1999; Reinhart et al. 2000) and cleavage of mRNA (Zeng et al. 2002; Yekta et al. 2004). Homologs exist across many species (Pasquinelli et al. 2000), which shows that miRNAs’ function as gene regulators has been conserved through evolution. A total of 1340 miRNA genes from 11 species are listed in the 5.0 release of the miRNA registry (Griffiths-Jones 2004). Computational approaches have estimated that about 1% of all predicted genes in the human (Lim et al. 2003a), fruitfly (Lai et al. 2003), and worm (Lim et al. 2003b) genomes are miRNA genes.
It seems that miRNAs function as siRNAs and silence genes by mRNA cleavage when targets with near-perfect complementarity exist (Zeng et al. 2002; Yekta et al. 2004), whereas inhibition of translation occurs when miRNAs are only partially complementary to their targets (Lee et al. 1993; Wightman et al. 1993). MicroRNAs known to induce translational suppression predominantly target 3′ UTRs (Bartel 2004) with neighboring binding sites (Olsen and Ambros 1999; Reinhart et al. 2000), but it has been demonstrated that a siRNA targeting a single coding site with partial complementarity can induce translational suppression as well (Saxena et al. 2003). Regardless, the inhibition of protein synthesis is more effective when targeting multiple sites (Doench et al. 2003).
Several miRNA target prediction algorithms have appeared recently, and results for fruitfly (Enright et al. 2003; Stark et al. 2003; Rajewsky and Socci 2004) and mammals (Lewis et al. 2003; John et al. 2004; Kiriakidou et al. 2004) suggest that about 10% of protein-coding genes are regulated by miRNAs (John et al. 2004). Computational approaches for identifying miRNA targets generally use sequence complementarity, thermodynamic stability calculations, and evolutionary conservation among species to determine whether a miRNA:mRNA duplex is a likely target interaction (Bartel 2004; Lai 2004).
The RNAhybrid algorithm by Rehmsmeier et al. (2004) computes minimum-free energy hybridization sites for miRNAs, while forcing perfect complementarity in nucleotides (nt) 2–7. Potential sites are normalized by the product of a miRNA and its potential target to avoid high-scoring, but unlikely hybridizations to long target sequences. Extreme value statistics similar to that used in sequence-similarity searching is used to determine the likelihood of a candidate site being due to random hits in a large database. The DIANA-microT algorithm also minimizes the duplex-binding energy in its initial step (Kiriakidou et al. 2004). Most of the existing miRNA target prediction algorithms use similar thermodynamic calculations in post-processing steps following a requirement of near-perfect complementarity with the targets in the miRNAs’ 5′ ends.
Rajewsky and Socci (2004) define a binding nucleus of consecutive base pairs, and calculate a weighted sum typically consisting of six to eight addends favoring more hydrogen bonds. The algorithm is referred to as Nucleus throughout this article, and its position-specific weights differ only slightly from the weights of a similar algorithm called miRanda (Enright et al. 2003). In a subsequent post-processing step, Nucleus uses folding-free energy as determined by mfold (Zuker 2003) to make the final predictions. Simpler algorithms that use a seed of perfect complementarity in the miRNA’s 5′ region include TargetScan (Lewis et al. 2003) and an algorithm from EMBL (Stark et al. 2003), but these run the risk of loosing targets that do not exactly meet their seed criteria.
We have developed a machine-learning algorithm called TargetBoost that creates classifiers for predicting miRNA target sites, and this is a novel approach to miRNA target site prediction. The algorithm, which is an adaptation of the boosted genetic programming algorithm of Sætrom (2004), creates weighted sequence motifs that characterize the probable binding characteristics between miRNAs and target sites. That is, given a miRNA and a potential target site, this classifier returns a score that represents the likelihood of the site being targeted by the miRNA. We used our classifiers to predict target sites in a set of genes important for fly body patterning in Drosophila melanogaster.
TargetBoost compares favorably to the algorithms of Rajewsky and Socci (2004) and Rehmsmeier et al. (2004) that were described previously. First, it rediscovers that miRNAs’ 5′ ends bind well to targets. Second, it proves to be a classifier with a high and stable performance across several targets. Third, and most importantly, it discovers more true targets than the aforementioned algorithms. As other known algorithms use variants of the Nucleus and RNAhybrid approaches, the performance of these two algorithms should be representative of the other algorithms’ performance as well.
We have not included additional filters, such as requiring conservation of the target sites or the presence of multiple target sites in the 3′ UTRs, in our algorithm comparisons. The reason is that these filters can be used independently of the initial method used to predict the target sites. Thus, improving the quality of the initial candidates will also improve the final predictions.
In summary, our main contributions are a new algorithm for predicting miRNA target sites, and an objective comparison of its performance to that of existing algorithms.
RESULTS
A machine learning algorithm that predicts miRNA target sites
GPboost is a machine-learning algorithm that, from a training set of positive and negative sequences, creates a sequence-based classifier that recognizes the positive sequences (Sætrom 2004). The classifier is the sum of several differentially weighted sequence patterns, where each pattern answers either yes (1) or no (−1) as to whether the pattern matches a given sequence or not. We have previously used variants of GPboost to predict the efficacy of short interfering RNAs (Sætrom 2004; Sætrom and Snøve Jr. 2004) and noncoding RNA genes in Escherichia coli (P. Sætrom, R. Sneve, K.I. Kristiansen, O. Snøve Jr., T. Grünfeld, T. Rognes, and E. Seeberg, in prep.).
To create the classifier, GPboost combines genetic programming (GP) (Koza 1992) and boosting (Meir and Rätsch 2003). More specifically, GP evolves the individual sequence patterns from a population of candidate patterns, and the boosting algorithm guides GP’s search by adjusting the importance of each sequence in the training set. Then, the boosting algorithm assigns weights to the sequence patterns based on the patterns’ performance in the corresponding training set. The final classifier is the average of several such boosted GP classifiers. Sætrom (2004) gives a more thorough description of the algorithm.
To train the miRNA target site predictors, we use a variant of the GPboost program, called TargetBoost, with two main differences. First, in Sætrom (2004) the patterns were simple queries, but the patterns we use here are template queries. That is, the sequence patterns are general expressions that describe the common properties of miRNA target sites. When using the patterns to search for target sites, we translate the general expressions into queries that are specific for each miRNA. Second, we use a different language to define what patterns are legal solutions. In the Materials and Methods, we give a formal definition of this pattern language along with additional details on how TargetBoost translates the patterns into miRNA-specific queries.
TargetBoost finds a good, stable miRNA target site predictor
To train and test the TargetBoost classifiers, we used a set of 36 experimentally verified target sites as positive data and a larger set of random sequences as negative data (see Materials and Methods for details). We compared TargetBoost’s performance with the performance of Nucleus (Rajewsky and Socci 2004) and RNAhybrid (Rehmsmeier et al. 2004)—two recently published methods for identifying miRNA targets. To test the algorithms, we used 10-fold and leave-one-miRNA-out cross-validation, and used receiver operating characteristics (ROC) analysis to compare the algorithms’ performance; see Materials and Methods for further descriptions.
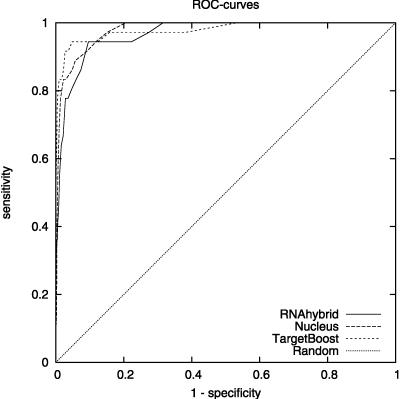
Figure 1 shows the 10-fold cross-validation ROC-curves for TargetBoost, RNAhybrid, and Nucleus. When comparing the curves for the different algorithms, we see that TargetBoost and RNAhybrid are better than Nucleus on high-specificity levels, with TargetBoost slightly better than RNAhybrid on specificity levels above 0.9.
FIGURE 1.
Overall ROC-curves for each algorithm.
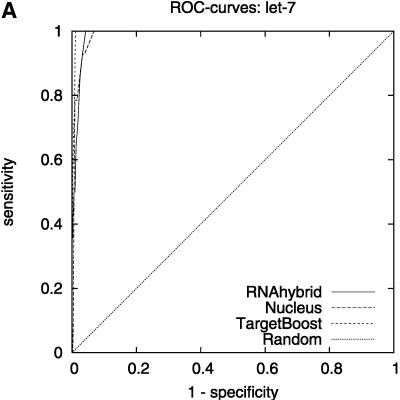
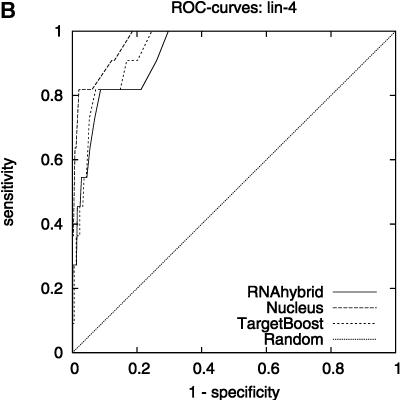
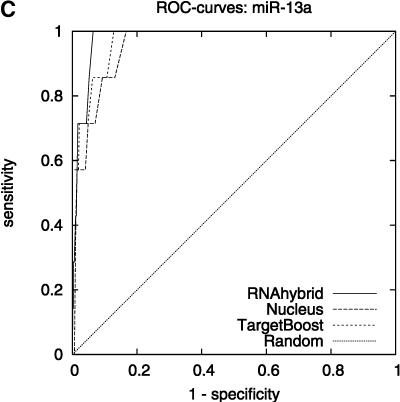
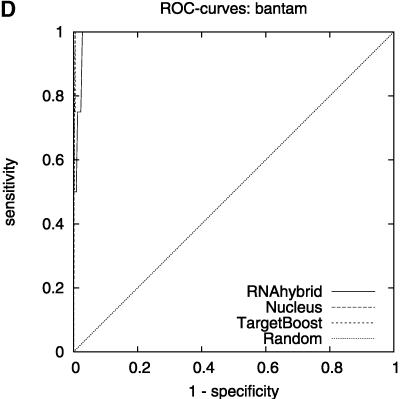
Figure 2 shows the leave-one-miRNA-out cross-validation results as it displays the ROC-curves for Target-Boost, RNAhybrid, and Nucleus for each miRNA in the training set individually. We see that RNAhybrid and TargetBoost have approximately the same ROC-curves for every miRNA, with TargetBoost being slightly better for every miRNA except miR-13a and the high-specificity regions of lin-4. Nucleus has the highest performance for lin-4.
FIGURE 2.
ROC-curves. A–D compare the performance of RNAhybrid, Nucleus, and TargetBoost at predicting the true target sites of let-7, lin-4, miR-13a, and bantam.
To compare the overall performance of the three algorithms, we computed the ROC-score for each algorithm on each miRNA. Then, on each individual miRNA, we tested whether the best algorithm was significantly better than the other algorithms. As Table 1 shows, TargetBoost not only had the best overall ROC-score, it was also the most stable of the three target site predictors, as for each individual miRNA, TargetBoost was either the best algorithm (let-7 and bantam) or as good as the best algorithm (Nucleus for lin-4 and RNAhybrid for miR-13a). Both RNAhybrid and Nucleus, however, were significantly worse than the best algorithm on at least one miRNA.
TABLE 1.
TargetBoost is the most stable algorithm
| Algorithm | let-7 | lin-4 | miR-13a | bantam | All |
| TargetBoost | 0.997 | 0.944 | 0.972 | 0.998 | 0.979 |
| RNAhybrid | 0.989 | 0.931 | 0.979 | 0.991 | 0.967 |
| Nucleus | 0.988 | 0.962 | 0.928 | 0.998 | 0.973 |
ROC-scores that are not significantly different from the highest score on a particular miRNA are in boldface (90% confidence level; see Materials and Methods for details on each algorithm).
Although the overall performance of the classifiers is important, when using a classifier to predict miRNA target sites in genes, the most important characteristics of the classifier is that the top predictions made by the classifier have a high probability of being true target sites. That is, the best classifier has higher sensitivity than the other classifiers when approaching maximal specificity.
The true-positive frequency (TPF) test determines whether there is a significant difference in the sensitivity of two classifiers at a given significance level (see Materials and Methods). For each miRNA, we tested whether the best classifier was significantly more sensitive than the other classifiers (99% confidence level) on specificities 0.995, 0.99, 0.98, 0.97, 0.96, and 0.95. On all specificities, TargetBoost was either the best or as good as the highest-scoring algorithm on all genes. RNAhybrid performed well on all specificities for all miRNAs except lin-4, where the algorithm was significantly less sensitive than Nucleus on all specificities. Nucleus, however, suffered from lower sensitivity in the high-specificity area; TargetBoost was significantly more sensitive than Nucleus for let-7 (specificity 0.995—P-value 0.006) and miR-13a (specificities 0.995 and 0.99—P-values 0.005 and 0.006). Thus, as for the overall ROC-score, TargetBoost was the most stable of the three algorithms.
A possible explanation for RNAhybrid and Nucleus being less stable than TargetBoost is that the different miRNAs have slightly different binding characteristics. For example, lin-4 and its target sites have a lower binding energy compared with the three other miRNAs, but may have other characteristics that the sequence-based methods, TargetBoost and Nucleus, have used to identify the target sites. This can explain RNAhybrid’s poorer performance on this miRNA. The motif-based classifiers of TargetBoost, however, seem to be robust and capture both the thermodynamic and sequence characteristics of the miRNA target sites in our database.
TargetBoost finds more true target sites than do RNAhybrid and Nucleus
When we search for target sites, there will be far more negative than positive target sites. We are therefore interested in a classifier that finds as many positive target sites as possible, before the number of negative target sites in the result set becomes too large. The ROC50-score, which is the area under the ROC curve until 50 false positives are found, reflects this interest, as the score takes into account that a user is seldom concerned with true positives that occur after the first page (about 50) of false positives (Gribskov and Robinson 1996). We ran a ROC50 test on the different algorithms to compare their performance on low frequencies of false positives; Table 2 lists the scores.
TABLE 2.
ROC50 scores for the algorithms on the complete data set
| Algorithm | ROC50-score |
| TargetBoost | 0.0025 |
| RNAhybrid1 | 0.0012 |
| RNAhybrid2 | 0.0017 |
| Nucleus1 | 0.0006 |
| Nucleus2 | 0.0011 |
| Nucleus3 | 0.0014 |
See Materials and Methods for descriptions of the different algorithms.
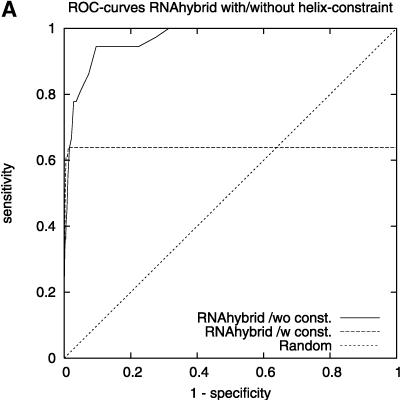
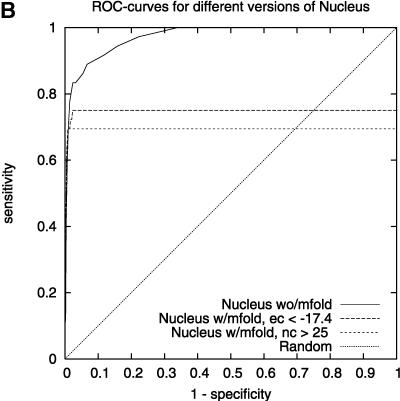
We found that TargetBoost performs better than RNA-hybrid and Nucleus. Both RNAhybrid and Nucleus can be given extra constrains, such as forcing miRNA 5′ helices in RNAhybrid and increasing the free-energy cutoff in Nucleus, to improve their predictive power. Both perform much better when they are given extra constraints, and especially RNAhybrid get a much higher sensitivity for high levels of specificity (see Fig. 3A). The drawback is that the algorithms will miss several miRNA target sites when they are using these constraints. Figure 3 gives the complete ROC-curves for the different versions of RNAhybrid and Nucleus. TargetBoost does not have this problem, as each target site will get a score by TargetBoost and no target site will automatically be discarded. What is more, as Table 2 shows, TargetBoost finds more true target sites, even when the constraints are introduced in RNAhybrid and Nucleus.
FIGURE 3.
ROC-curves comparing different parameter settings on RNAhybrid (A) and Nucleus (B). We can see increased sensitivity for high-specificity values for RNAhybrid in A.
TargetBoost rediscovers that 5′ ends bind with near-perfect complementarity
Earlier methods that identify miRNA target sites have used the property that the miRNA tends to bind perfectly to the target site on the 5′ end of the miRNA. Enright et al. (2003), Kiriakidou et al. (2004), Lewis et al. (2003), and Stark et al. (2003) use this property directly by demanding perfect binding at the 5′ end as a seed. Nucleus (Rajewsky and Socci 2004) uses the property indirectly by demanding a long GC-rich sequence of matches. This sequence will most often appear at the 5′ end of the miRNA. RNAhybrid (Rehmsmeier et al. 2004) can also incorporate this property by demanding that parts of the miRNA have to form a perfect helix. By demanding a perfect helix on nt 2–7 on the 5′ end of the miRNA, better results were observed (see Rehmsmeier et al. 2004; Fig. 3A; Table 2).
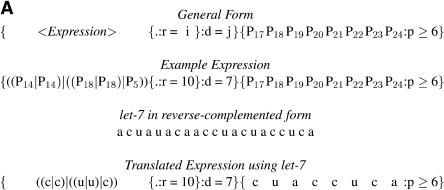
TargetBoost confirmed the tendency of perfect matching in the 5′ end. The production rules used to create the classifiers demand a segment of near-perfect pairing between miRNA and target site, but the position and length of this pairing is not encoded in the production. This is decided entirely by the training process. Almost every individual trained at the first boosting iteration resembled the expression in Figure 4. That is, in most expressions, the consecutive sequence part of the expressions (the rightmost {...} subexpression in Fig. 4) used positions 17–24 in the miRNA counted from the 3′ end. These positions correspond to the first eight bases on the 5′ end. As explained in the Materials and Methods, the P ≥ 6 means that six of the eight bases have to match at the 5′ core, and this indicates that almost every target site in the training set demands a near-perfect match in the 5′ end of the miRNA. This corresponds to experimental evidence in the literature (Doench and Sharp 2004; Kiriakidou et al. 2004).
FIGURE 4.
MicroRNA target query examples. (A) General pattern generated after the first boosting iteration in TargetBoost. This pattern has been translated using the let-7 miRNA in a complemented form. (B) The translated query matched against the lin-14 target site.
Target candidates in Drosophila melanogaster
We searched a set of genes important for fly body patterning in D. melanogaster for candidate target sites. This set is the same as was used in Rajewsky and Socci (2004) and Rehmsmeier et al. (2004). In the search, we used a set of 78 D. melanogaster miRNAs downloaded from the miRNA Registry version 5.0 (Griffiths-Jones 2004). We compared the target sites found in our search with the target sites predicted by Rehmsmeier et al. (2004) and Rajewsky and Socci (2004).
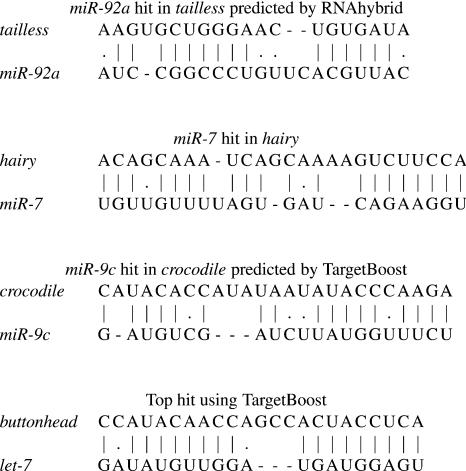
Figure 5 displays target sites predicted by either Target-Boost, RNAhybrid, or both. When comparing our results to the top five hits predicted by Rehmsmeier et al. (2004), we found that TargetBoost did not predict the potential miR-92a site in tailless and the potential miR-210 site in hairy reported by RNAhybrid. This is because of the number of G:U wobbles in the target sites reported by RNAhybrid; for example, the miR-92a target in tailless has three G:U wobbles, two of them residing in the 5′ core (see Fig. 5). The miR-210 site in hairy has five G:U wobbles, with three wobbles in the first eight bases of the 5′ core. As TargetBoost treats G:U wobbles as normal mismatches, we would not find potential target sites with a high number of G:U wobbles; especially if the sites resided in the 5′ core. This may, however, be a strength of our method, as recent experimental results suggest that G:U wobbles may be detrimental to translational repression (Doench and Sharp 2004).
FIGURE 5.
Aligned D. melanogaster target sites.
Although we did not find the same miR-210 site in hairy as did RNAhybrid, TargetBoost did predict that miR-7 has a potential target site in hairy. The target site is the same as the ones predicted by RNAhybrid and Nucleus, and it has only one G:U wobble. Stark et al. (2003) has shown that hairy is a target for miR-7.
Other differences in the predicted target sites come from the constraint used in RNAhybrid. To get better predictions with RNAhybrid, you can demand a perfect helix for nt 2–7 in the 5′ end of the miRNA. TargetBoost does not need this constraint, and therefore a larger set of potential target sites will be considered with TargetBoost. For example, the miR-9c target in crocodile predicted by TargetBoost, shown in Figure 5, have a mismatch in position 5 at the 5′ end. Because of this, the target is automatically disqualified when running RNAhybrid with the perfect helix constraint.
Finally, Figure 5 shows the highest-scoring target site predicted by TargetBoost. let-7 has few mismatches with this buttonhead target site, and the target site also has the characteristics of single miRNA target sites as outlined by Kiriakidou et al. (2004).
DISCUSSION
We have presented a program, TargetBoost, that finds miRNA target sites. We compared the performance of TargetBoost against two recently published algorithms for finding miRNA target sites, and found that the performance of TargetBoost is good and stable compared with the other algorithms. A possible reason for this is that TargetBoost has found a pattern in the miRNA–mRNA binding that predicts target sites better than just looking at the free-energy score and binding in the 5′ core. It is known that by incorporating knowledge of binding in the 5′ core to the free-energy calculation, better classification is achieved (Rehmsmeier et al. 2004). Perhaps by discovering other patterns in the miRNA–mRNA binding and incorporating those, TargetBoost has made a better classifier.
Another potential explanation for TargetBoost’s performance compared with the other algorithms is that Tar-getBoost does not allow G:U wobbles between miRNAs and target sites. Mutation studies of target sites (Doench and Sharp 2004) and miRNAs (Kloosterman et al. 2004) indicate that G:U wobbles in the 5′ region of the miRNA reduces target site activity more than what is expected by their thermodynamic stability. Thus, algorithms that rely on thermodynamic calculations to predict target sites will return more false-positive predictions.
Computational methods that predict miRNA target sites generally use sequence complementarity, thermodynamic stability calculations, evolutionary conservation among species, number of target sites in a mRNA, or a combination of the four. We chose to compare TargetBoost against Nucleus and RNAhybrid because these two algorithms cover both the group of algorithms that uses sequence complementarity and the group of algorithms that uses thermodynamic stability calculations. We have disregarded other methods to further refine the set of candidate sites, as evolutionary conservation and the number of target sites are used as a post-processing step on the more basic methods for finding candidate sites. They can therefore also easily be used as a post-processing step for TargetBoost.
Be aware that all miRNA target prediction algorithms are based on the assumption that all targets share characteristics with the set of experimentally verified targets in lower organisms. There is a possibility that (1) new families of targets with fundamentally different characteristics from the training set exist, and (2) targets in mammalian species differ from those of lower organisms. For example, Smalheiser and Torvik (2004) compared the complementarity interactions between miRNAs and mRNA with that between miRNAs and scrambled controls in humans. They found that the discriminative characteristics of putative targets are longer stretches of perfect complementarity, higher overall complementarity allowing for gaps, mismatches, and wobbles, and multiple proximal sites that are complementary to one or several miRNAs. Note that these results suggest that mammalian miRNA targets may possess other characteristics than do targets from D. melanogaster and Caenorhabditis elegans. Specifically, the stretches of perfect complementarity may be longer, targets in the protein-coding region may be present, and the bias toward perfect complementarity in the miRNA’s 5′ region may be weaker. If this is true, current miRNA target prediction algorithms may have limited value when used to predict targets in mammals.
In summary, we have presented a new algorithm for predicting miRNA target sites. The algorithm uses machine learning to train a sequence-based target site predictor, and this is a novel approach to miRNA target site prediction. Our algorithm compares favorably to other algorithms, both in terms of overall performance and when making highly specific predictions. We believe that our algorithm will be an important tool, not only for finding the target sites of known miRNAs, but also for predicting potential miRNA off-target effects in RNAi experiments (Saxena et al. 2003; Scacheri et al. 2004).
MATERIALS AND METHODS
Algorithm and implementation
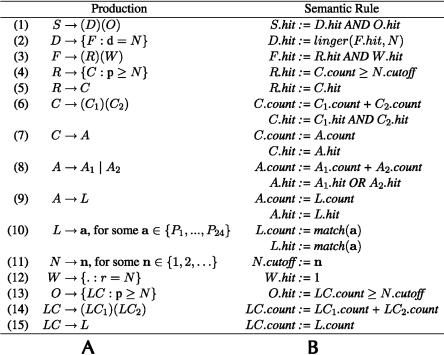
TargetBoost ensures that all patterns evolved in the genetic programming process are valid expressions in a pattern language (Sætrom 2004). Figure 6 shows the grammar and semantics of the pattern language used to create the miRNA target predictors. The grammar is in Backus-Naur form (Knuth 1964) and shows the legal production rules in the language, with nonterminals represented by uppercase letters and terminals represented by boldface letters. Syntactical elements in the language, such as parentheses and operators, are in normal typeface, alternatives are represented as separate productions, adjacent symbols are concatenated, and Pi represents position i in the miRNA-sequence, counted from the 3′ end.
FIGURE 6.
The grammar (A) and semantics (B) of the pattern language used by TargetBoost. The grammar and semantics are explained in the main text.
Figure 6B shows the language’s semantics. A pattern matches a sequence if S.hit is true. match(a) returns 1 if the character in the position indicated by a is identical to the character it is compared with. linger(F.hit, N) is a function that if F.hit is true, F.hit will be returned for N clock-ticks (see Halaas et al. [2004] for details on the linger-function). The production for W creates a sequence of N wild cards. This production will return a hit for any sequence of N characters it is compared with.
Each individual generated by these production rules consists of two parts as follows: an unknown pattern R, and a consecutive sequence O of near perfect matches. The two parts are separated by a variable amount of nucleotides, decided by the displacement D. The number of wild cards in the W-production gives the lower bound of the number of nucleotides, and the number of wild cards, plus the displacement d in the D-production gives the upper bound of the number of nucleotides.
Figure 7 shows two example patterns from our pattern language. In the first query, the unknown pattern and the consecutive sequence are separated by 8–15 nt, and in the second query, by 4–14 nt. As in Sætrom (2004), we use the pattern n-of-m operator (P ≥ N in productions 4 and 13 in Fig. 6) to introduce fuzzy matching. That is, the numeral N in productions 4 and 13 indicates the minimum number of terminals in the C and LC productions that must match. For example, in Q1, only two of six nucleotides must match, but in Q2, all five nucleotides must match. This is also the case for the unknown pattern; the complete expression must match in Q2, as it does not use the pattern n-of-m operator, but only three of four nucleotides must match in Q1.
FIGURE 7.
Two example patterns from our pattern language. Pi denotes nucleotide i in the miRNA counted from the 3′ end.
The terminals in the expressions represent positions in the miRNA-sequence; the expressions are therefore translated before searching. During translation, the terminals that represent positions are replaced with the corresponding complemented nucleotide in the miRNA sequence. The positions in the miRNA are numbered from P1to P24, with P24 corresponding to the 5′ end of the miRNA. Our current implementation translates the miRNAs from 5′ to 3′, but only uses the 21 first nucleotides—P1 to P3 defaults to wild cards that match any nucleotide. TargetBoost evaluates a candidate pattern by using the translated queries to search the training set of positive and negative sequences. It then scores the pattern based on the number of true and false positive/ negative hits and the relative weights the boosting algorithm has assigned to the sequences.
Reference algorithms for comparison
We compared the performance of TargetBoost with the performance of Nucleus (Rajewsky and Socci 2004) and RNAhybrid (Rehmsmeier et al. 2004) (these algorithms are described in the Introduction). Nucleus has two cut-off parameters that can be tuned—the weighted sum cut-off and the free energy cut-off—and when comparing the performance of this algorithm with the performance of our algorithm, we made certain modifications. Nucleus1 does not use mfold, and therefore, has only one cut-off parameter to tune. Nucleus2 has a free-energy cut-off of −17.4, while the weighted sum cut-off is tunable. This was the cut-off recommended in Rajewsky and Socci (2004). Nucleus3 has a weighted sum cut-off of 25, while the free-energy cut-off is tunable. Again, this cut-off was recommended in Rajewsky and Socci (2004).
We ran RNAhybrid in two modes; RNAhybrid1 ran without forcing miRNA 5′ helices, and RNAhybrid2 forced miRNA 5′ helices from position two to seven, as suggested by Rehmsmeier et al. (2004). Throughout this work, RNAhybrid and Nucleus are short for Nucleus1 and RNAhybrid1.
Positive data set
The positive data set consisted of 36 experimentally confirmed target sites for the miRNAs let-7, lin-4, miR-13a, and bantam in C. elegans and D. melanogaster (Boutla et al. 2003; Brennecke et al. 2003; Rajewsky and Socci 2004). Each target site was padded with their respective sequences, such that the length of the sequences was 30 nt. Target sites longer than 30 nt were discarded from the data set.
Negative data set
The negative data set consisted of 3000 random strings, all 30 nt long. The frequencies used in the generation of the random strings were the same as the frequencies used in Rajewsky and Socci (2004), (PA = 0.34, PC = 0.19, PG = 0.18, PU = 0.29), and correspond to the nucleotide composition of D. melanogaster 3′ UTRs.
Cross-validation
Cross-validation is a common method to evaluate the performance of a classifier on data not used to train the classifier. Here, we used 10-fold cross-validation (Breiman et al. 1984) and an approach we call “leave-one-miRNA-out” cross-validation. A 10-fold cross-validation usually gives a good estimate of a classifier’s predictive accuracy (Kohavi 1995). In this case, however, the number of verified target sites for each miRNA varied greatly, so that the miRNA having the most target sites (let-7) had a high chance of being present in both the training and test sets in many of the 10-folds. As this may cause a bias in the classifier performance estimated by the 10-fold cross-validation method, we tried a second cross-validation approach that did not have this bias. In the “leave-one-miRNA-out” cross-validation approach, we used all of the target sites from all of the miRNAs, but one, as training set; we then used the remaining miRNA’s target sites as test set. This gave four training and test sets.
Comparing algorithms
We compared the algorithms by analyzing their receiver operating characteristics (ROC) curves. A ROC-curve describes the relationship between the specificity Sp = TN/(FP + TN) and the sensitivity Se = TP/(TP + FN) of a classifier. Here, TP, FP, TN, and TN are the number of true positives, false positives, true negatives, and false negatives.
We did three analyses on the ROC-curves, i.e., area tests, TPF tests, and ROC50 tests. In the area tests, we calculate the area under the ROC-curve—the ROC-score. An area of 1 indicates a perfect classification, and an area of 0.5 indicates a random classification. In the TPF tests, we calculate the true-positive frequency (TPF = Se) for a classifier for a given false-positive frequency (FPF = 1−Sp), or the amount of correctly classified positive samples given a specified amount of false-positive samples. In the ROC50 tests, we calculate the ROC50 score, which is the area under the ROC-curve plotted until 50 true negative samples are found (Gribskov and Robinson 1996).
We used ROCKIT (Metz et al. 1998) for statistical comparisons of ROC area and TPF values.
Availability
TargetBoost is available as a Web tool from http://www.interagon.com/demo/. Currently, the Web tool searches the 3′ UTRs of C. elegans; other data sets are available for both commercial and strategic academic collaborations.
Acknowledgments
We thank O.R. Birkeland for valuable comments on the manuscript and N. Rajewsky for sharing his data set of miRNA target sites. The work was supported by the Norwegian Research Council, grant 151899/150, and the bioinformatics platform at the Norwegian University of Science and Technology, Trondheim, Norway.
Article published online ahead of print. Article and publication date are at http://www.rnajournal.org/cgi/doi/10.1261/rna.7290705.
REFERENCES
- Bartel, D.P. 2004. MicroRNAs: Genomics, biogenesis, mechanism, and function. Cell 116: 281–297. [DOI] [PubMed] [Google Scholar]
- Boutla, A., Delidakis, C., and Tabler, M. 2003. Developmental defects by antisense-mediated inactivation of micro-RNAs 2 and 13 in Drosophila and the identification of putative target genes. Nucleic Acids Res. 31: 4973–4980. [DOI] [PMC free article] [PubMed] [Google Scholar]
- Breiman, L., Friedman, J.H., Olshen, R.A., and Stone, C.J. 1984. Classification and regression trees. Wadsworth, Belmont, CA.
- Brennecke, J., Hipfner, D.R., Stark, A., Russell, R.B., and Cohen, S.M. 2003. bantam Encodes a developmentally regulated miRNA that controls cell proliferation and regulates the proapoptotic gene hid in Drosophila. Cell 113: 25–36. [DOI] [PubMed] [Google Scholar]
- Doench, J.G. and Sharp, P.A. 2004. Specificity of microRNA target selection in translational repression. Genes & Dev. 18: 504–511. [DOI] [PMC free article] [PubMed] [Google Scholar]
- Doench, J., Petersen, C., and Sharp, P. 2003. siRNAs can function as miRNAs. Genes & Dev. 17: 438–442. [DOI] [PMC free article] [PubMed] [Google Scholar]
- Enright, A.J., John, B., Gaul, U., Tuschl, T., Sander, C., and Marks, D.S. 2003. MicroRNA targets in Drosophila. Genome Biol. 5: R1. [DOI] [PMC free article] [PubMed] [Google Scholar]
- Gribskov, M. and Robinson, N.L. 1996. The use of reciever operator characteristic (ROC) analysis to evaluate sequence matching. Comput. Chem. 20: 25–34. [DOI] [PubMed] [Google Scholar]
- Griffiths-Jones, S. 2004. The microRNA registry. Nucleic Acids Res. 32: D109–D111. [DOI] [PMC free article] [PubMed] [Google Scholar]
- Halaas, A., Svingen, B., Nedland, M., Sætrom, P., Snøve Jr., O., and Birkeland, O.R. 2004. A recursive MISD architecture for pattern matching. IEEE Trans. on VLSI Syst. 12: 727–734. [Google Scholar]
- John, B., Enright, A.J., Aravin, A., Tuschl, T., Sander, C., and Marks, D.S. 2004. Human microRNA targets. PLoS Biol. 2: e363. [DOI] [PMC free article] [PubMed] [Google Scholar]
- Kiriakidou, M., Nelson, P.T., Kouranov, A., Fitziev, P., Bouyioukos, C., Mourelatos, Z., and Hatzigeorgiou, A. 2004. A combined computational-experimental approach predicts human microRNA targets. Genes & Dev. 18: 1165–1178. [DOI] [PMC free article] [PubMed] [Google Scholar]
- Kloosterman, W.P., Wienholds, E., Ketting, R.F., and Plasterk, R.H. 2004. Substrate requirements for let-7 function in the developing zebrafish embryo. Nucleic Acids Res. 32: 6284–6291. [DOI] [PMC free article] [PubMed] [Google Scholar]
- Knuth, D.E. 1964. Backus normal form vs. Backus Naur form. Commun. ACM 7: 735–736. [Google Scholar]
- Kohavi, R. 1995. A study of cross-validation and bootstrap for accuracy estimation and model selection. In Proceedings of the Fourteenth International Joint Conference on Artificial Intelligence, pp. 1137–1143. Morgan Kaufmann Publishers, Montreal, Canada.
- Koza, J.R. 1992. Genetic programming: On the programming of computers by natural selection. MIT Press, Cambridge, MA.
- Lagos-Quintana, M., Rauhut, R., Lendeckel, W., and Tuschl, T. 2001. Identification of novel genes coding for small expressed RNAs. Science 294: 853–858. [DOI] [PubMed] [Google Scholar]
- Lai, E.C. 2004. Predicting and validating microRNA targets. Genome Biol. 5: 115. [DOI] [PMC free article] [PubMed] [Google Scholar]
- Lai, E.C., Tomancak, P., Williams, R.W., and Rubin, G.M. 2003. Computational identification of Drosophila microRNA genes. Genome Biol. 4: R42. [DOI] [PMC free article] [PubMed] [Google Scholar]
- Lau, N.C., Lim, L.P., Weinstein, E.G., and Bartel, D.P. 2001. An abundant class of tiny RNAs with probable regulatory roles in Caenorhabditis elegans. Science 294: 858–862. [DOI] [PubMed] [Google Scholar]
- Lee, R.C. and Ambros, V. 2001. An extensive class of small RNAs in Caenorhabditis elegans. Science 294: 862–864. [DOI] [PubMed] [Google Scholar]
- Lee, R.C., Feinbaum, R., and Ambros, V. 1993. The C. elegans heterochronic gene lin-4 encodes small RNAs with antisense complementarity to lin-14. Cell 75: 843–854. [DOI] [PubMed] [Google Scholar]
- Lewis, B.P., hung Shih, I., Jones-Rhoades, M.W., Bartel, D.P., and Burge, C.B. 2003. Prediction of mammalian microRNA targets. Cell 115: 787–798. [DOI] [PubMed] [Google Scholar]
- Lim, L.P., Glasner, M.E., Yekta, S., Burge, C.B., and Bartel, D.P. 2003a. Vertebrate microRNA genes. Science 299: 1540. [DOI] [PubMed] [Google Scholar]
- Lim, L.P., Lau, N.C., Weinstein, E.G., Abdelhakim, A., Yekta, S., Rhoades, M.W., Burge, C.B., and Bartel, D.P. 2003b. The microRNAs of Caenorhabditis elegans. Genes & Dev. 17: 991–1008. [DOI] [PMC free article] [PubMed] [Google Scholar]
- Meir, R. and Rätsch, G. 2003. An introduction to boosting and leveraging. In Advanced lectures on machine learning (eds. S. Mendelson and A. Smola), Vol. 2600, pp. 118–183. Springer-Verlag, GmbH.
- Metz, C.E., Herman, B.A., and Roe, C.A. 1998. Statistical comparison of two ROC-curve estimates obtained from partially-paired datasets. Med. Decis. Making 18: 110–121. [DOI] [PubMed] [Google Scholar]
- Moss, E.G., Lee, R.C., and Ambros, V. 1997. The cold shock domain protein LIN-28 controls developmental timing in C. elegans and is regulated by the lin-4 RNA. Cell 88: 637–646. [DOI] [PubMed] [Google Scholar]
- Olsen, P.H. and Ambros, V. 1999. The lin-4 regulatory RNA controls developmental timing in Caenorhabditis elegans by blocking LIN-14 protein synthesis after the initiation of translation. Dev. Biol. 216: 671–680. [DOI] [PubMed] [Google Scholar]
- Pasquinelli, A.E., Reinhart, B.J., Slack, F., Martindale, M.Q., Kuroda, M.I., Maller, B., Hayward, D.C., Ball, E.W., Degnan, B., Müller, P., et al. 2000. Conservation of the sequence and temporal expression of let-7 heterochronic regulatory RNA. Nature 408: 86–89. [DOI] [PubMed] [Google Scholar]
- Rajewsky, N. and Socci, N.D. 2004. Computational identification of microRNA targets. Dev. Biol. 267: 529–535. [DOI] [PubMed] [Google Scholar]
- Rehmsmeier, M., Steffen, P., Höchsmann, M., and Giegerich, R. 2004. Fast and effective prediction of microRNA/target duplexes. RNA 10: 1507–1517. [DOI] [PMC free article] [PubMed] [Google Scholar]
- Reinhart, B., Slack, F., Basson, M., Pasquinelli, A., Bettinger, J., Rougvie, A., Horvitz, H., and Ruvkun, G. 2000. The 21-nucleotide let-7 RNA regulates developmental timing in Caenorhabditis elegans. Nature 403: 901–906. [DOI] [PubMed] [Google Scholar]
- Sætrom, P. 2004. Predicting the efficacy of short oligonucleotides in antisense and RNAi experiments with boosted genetic programming. Bioinformatics 20: 3055–3063. [DOI] [PubMed] [Google Scholar]
- Sætrom, P. and Snøve Jr., O. 2004. A comparison of siRNA efficacy predictors. Biochem. Biophys. Res. Commun. 321: 247–253. [DOI] [PubMed] [Google Scholar]
- Saxena, S., Jonsson, Z., and Dutta, A. 2003. Implications for off-target acitivity of small inhibitory RNA in mammalian cells. J. Biol. Chem. 278: 44312–44319. [DOI] [PubMed] [Google Scholar]
- Scacheri, P.C., Rozenblatt-Rosen, O., Caplen, N.J., Wolfsberg, T.G., Umayam, L., Lee, J.C., Hughes, C.M., Selvi Shanmugam, K., Bhattacharjee, A., Meyerson, M., et al. 2004. Short interfering RNAs can induce unexpected and divergent changes in the levels of untargeted proteins in mammalian cells. Proc. Natl. Acad. Sci. 101: 1892–1897. [DOI] [PMC free article] [PubMed] [Google Scholar]
- Smalheiser, N.R. and Torvik, V.I. 2004. A population-based statistical approach identifies parameters characteristic of human microRNA-mRNA interactions. BMC Bioinformatics 5: 139. [DOI] [PMC free article] [PubMed] [Google Scholar]
- Stark, A., Brennecke, J., Russell, R.B., and Cohen, S.M. 2003. Identification of Drosophila microRNA targets. PLoS Biol. 1: E60. [DOI] [PMC free article] [PubMed] [Google Scholar]
- Wightman, B., Ha, I., and Ruvkun, G. 1993. Posttranscriptional regulation of the heterochronic gene lin-14 by lin-4 mediates temporal pattern formation in C. elegans. Cell 75: 855–862. [DOI] [PubMed] [Google Scholar]
- Yekta, S., Shih, I., and Bartel, D.P. 2004. MicroRNA-directed cleavage of HOXB8 mRNA. Science 304: 594–596. [DOI] [PubMed] [Google Scholar]
- Zeng, Y., Wagner, E., and Cullen, B. 2002. Both natural and designed micro RNAs can inhibit the expression of cognate mRNA when expressed in human cells. Mol. Cell. 9: 1327–1333. [DOI] [PubMed] [Google Scholar]
- Zuker, M. 2003. Mfold Web server for nucleic acid folding and hybridization prediction. Nucleic Acids Res. 31: 3406–3415. [DOI] [PMC free article] [PubMed] [Google Scholar]


