


Abstract
The crystal structure of the DNA dodecamer duplex CATGGGCCCATG lies on a structural continuum along the transition between A- and B-DNA. The dodecamer possesses the normal vector plot and inclination values typical of B-DNA, but has the crystal packing, helical twist, groove width, sugar pucker, slide and x-displacement values typical of A-DNA. The structure shows highly ordered water structures, such as a double spine of water molecules against each side of the major groove, stabilizing the GC base pairs in an A-like conformation. The different hydration of GC and AT base pairs provides a physical basis for solvent-dependent facilitation of the A↔B helix transition by GC base pairs. Crystal structures of CATGGGCCCATG and other A/B-DNA intermediates support a ‘slide first, roll later’ mechanism for the B→A helix transition. In the distribution of helical parameters in protein–DNA crystal structures, GpG base steps show A-like properties, reflecting their innate predisposition for the A conformation.
INTRODUCTION
The right-handed B helix is the dominant biological conformation of DNA, but the biological significance of the A helix form has been under-appreciated. In many crystal structures of protein–DNA complexes, the DNA is in an A-like conformation (1–5). The introduction of an α-helix into the major groove of DNA induces broad conformational changes characteristic of a B→A conversion, deepening and narrowing the major groove while widening the minor groove (6,7). Indeed, it is as much the deformability of DNA as its equilibrium structure that determines how DNA interacts with proteins (8).
In particular, a long continuous run of guanines (or a G-tract) has long been known to favor the A-DNA helix conformation and, depending on the local water activity, can induce a B→A transition (9–14). Recently, several crystal structures of DNA oligomers in A/B intermediate conformations have been published (15–20). Of particular interest are the structures from Vargason et al. (19) of brominated and methylated variants of the hexamer GGCGCC spanning the entire A↔B-DNA continuum. However, because hexamers are so short, it is difficult to decide whether observed structural features are derived from the base sequence itself or from unrestrained terminal base pairs (20). The present paper examines the 1.3 Å resolution A/B-DNA intermediate crystal structure of the dodecamer CATGGGCCCATG, hereafter referred to as G3C3 for brevity (15). G3C3 differs from the closely related decamer CATGGCCATG, hereafter referred to as G2C2, only by the addition of two more GC base pairs. Yet G2C2 adopts a B conformation in the crystal (21). Ab initio quantum mechanical and molecular dynamics calculations on G3C3 have helped to understand the origin of the structural dualism of G-tracts (22). Closer examination of the high-resolution G3C3 crystal structure and the unique structural properties exhibited by G3C3 offers insight into the nature of the A↔B-DNA transition and how it is facilitated by G-tracts.
MATERIALS AND METHODS
Helical parameters for G3C3 were calculated with Freehelix (4) and 3DNA (5). Helical parameters for the same 63 crystal structures of protein–DNA complexes previously analyzed by Dickerson (23) were calculated by CURVES (24) with a locally defined helical axis. Atomic coordinates for G3C3 (BD0026), G2C2 (BDJ051) and the 63 complexes (PD0299, PDE001, PDE002, PDE003, PDE009, PDE014, PDE017, PDE025, PDE115, PDR001, PDR002, PDR004, PDR006, PDR008, PDR009, PDR010, PDR011, PDR012, PDR016, PDR018, PDR020, PDR026, PDR027, PDRC01, PDRC03, PDT004, PDT005, PDT006, PDT007, PDT009, PDT011, PDT012, PDT014, PDT015, PDT016, PDT017, PDT019, PDT024, PDT028, PDT030, PDT031, PDT032, PDT033, PDT034, PDT035, PDT036, PDT038, PDT040, PDV001) are available from the Nucleic Acid Database (25). The figures were created with Molscript (26) and Raster3D (27).
RESULTS
Helical parameters
The global structural features of G3C3 were reported in a previous study (15). In summary, G3C3 possesses a normal vector plot, roll, tilt and inclination values typical of B-DNA (4) but has slide, x-displacement, helical twist, phosphate displacement, minor groove width and sugar pucker values more characteristic of A-DNA (Fig. 1 and Tables 1 and 2). Individual base pairs sit roughly perpendicular to the overall helix axis as in B-DNA. But they are displaced significantly off-axis in the minor groove direction. This makes the minor groove shallow and the major groove deep, and induces a large slide from one base pair to the next along their long axes. These latter features are customarily associated with A-DNA. In overall appearance, G3C3 looks like ‘straight’ A-DNA with the expected inclination of individual base pairs removed. All base steps have twist values closer to that of A-DNA (32.7°) than B-DNA (36°). Likewise, for all 11 base steps, the phosphorus atoms are far off center, with Zp values >2 Å, typical of A-DNA (5,13).
Figure 1.

Structures of B-helical CATGGCCATG (left) and the B/A intermediate CATGGGCCCATG (right), viewed (A) perpendicular to the helix axis and (B) down the helix axis. Note the stacking of base pairs at the center in (A), and the A-like central cavity in (B).
Table 1. Helical parameters: base step parameters.
| Base step | Roll (°) | Tilt (°) | Slide (Å) | Twist (°) | Zp (Å) |
|---|---|---|---|---|---|
| C/A | 6.4 | 0.4 | –1.6 | 32.5 | 2.49 |
| A/T | –1.3 | 0.1 | –1.9 | 24.4 | 2.63 |
| T/G | 4.4 | –0.7 | –1.9 | 27.1 | 2.40 |
| G/G | 2.5 | 0.1 | –1.5 | 33.2 | 2.55 |
| G/G | 4.8 | 2.2 | –1.7 | 33.2 | 2.62 |
| G/C | 4.8 | 0.0 | –0.7 | 28.5 | 2.22 |
| C/C | 3.0 | –1.1 | –1.2 | 33.4 | 2.42 |
| C/C | 2.0 | –1.5 | –1.6 | 32.2 | 2.50 |
| C/A | 5.8 | –1.2 | –1.8 | 30.5 | 2.60 |
| A/T | –3.4 | –0.6 | –1.9 | 33.4 | 2.69 |
| T/G | 10.4 | –0.2 | –1.6 | 22.6 | 2.19 |
| Averagea | 2.5 | –0.3 | –1.6 | 30.7 | 2.51 |
| Helix type | 1.B | 1.B | 1.A | 1.A | l.A |
Table 2. Helical parameters: base pair parameters.
| Base pair | Inclination (°) | Propeller (°) | x-displacement (Å) |
|---|---|---|---|
| C/G | 6.5 | –5.6 | –4.1 |
| A/T | 6.8 | –6.6 | –2.7 |
| T/A | 6.1 | –8.7 | –2.0 |
| G/C | 4.0 | –8.4 | –2.6 |
| G/C | 2.9 | –11.3 | –3.2 |
| G/C | 5.2 | –7.4 | –3.2 |
| C/G | 6.2 | –7.2 | –3.6 |
| C/G | 6.8 | –12.5 | –3.0 |
| C/G | 6.2 | –8.9 | –2.7 |
| A/T | 6.0 | –7.9 | –2.6 |
| T/A | 5.3 | –2.0 | –3.4 |
| G/C | 5.8 | 7.1 | –4.9 |
| Averagea | 5.6 | –8.1 | –2.9 |
| Helix type | .B | 10.B | 1.A |
B-DNA is commonly encountered in two distinct variants, a ‘classical’ B and a form with high propeller and narrow minor groove known as A-tract B-DNA or simply as B′-DNA. The latter variant is encountered in runs of four or more consecutive adenines and thymines without a disruptive 5′T–A3′ step. G3C3 exhibits low propeller, with an average value of –8.1° in contrast to the –16° to –18° propeller typically found in A-tracts. Base pairs with large propeller twist have been proposed to lock A-tracts sterically into rigid helices (28). In contrast, the low propeller twist of base pairs in G3C3 evokes a model of stacked flat plates free to slide over each other. Such a model is consistent with computational studies indicating that GpG is energetically the least stable and most deformable of base steps (29–32).
Given the deformability of DNA, the common categorization of right-handed duplexes into mutually exclusive A and B families is functionally inadequate. A and B helix families are but the extreme ends of a multidimensional structural continuum defined by free energy. The structure of G3C3 possesses traits of both A- and B-DNA and is intermediate along that continuum. Sugar pucker alone has often been used to categorize a duplex as belonging to the A or B helix family. By this criterion, G3C3, with 23 out of 24 sugar rings in the C3′-endo conformation, clearly would be an A helix. But such a classification is overly simplistic, and neglects the special features of G3C3 and other duplexes with A/B-DNA intermediate features (15–20,33,34). Sugar pucker can be a particularly misleading arbiter for structural categorization, as the backbone is by far the most flexible component of DNA. Recent work in ultra-high resolution crystallography has revealed that the DNA backbone itself can exhibit multiple conformations, without significantly affecting base stacking geometry (35,36). While the C3′-endo sugar conformation often correlates with an A duplex structure, it is only a consequence, and not the cause, of the A-helical form. This difficulty in differentiating correlation from causality also applies to other helical parameters, and presents a confusing chicken-or-egg problem. Interpretation of DNA structures using all available parameters and tools can lead to a more accurate understanding of DNA as a deformable and dynamic molecule.
Hydration
G3C3 crystals contain a relatively high 60% water content. The volume per base pair (Vbp) is 1283 Å3, which is in the range typical for B-DNA (1175–1462 Å3) and lower than the Vbp for all A-DNA crystal structures (1299–1836 Å3) reported by Heinemann (37). As seen in many A-DNA crystal structures, large discontinuous solvent channels run through the deep major grooves of the helices in the crystal (38). The crystal structure at 113 K shows 93 discrete water molecules at 1.3 Å resolution. Most of the solvent channels are occupied by bulk solvent. No ions or spermine molecules were located in the electron density maps. The dehydrating agent 2-methyl-5-pentane-diol constituted only 20% of the crystallization solution. Such a high water activity is more typical of solutions used to crystallize B-DNA oligonucleotides. However, the hydration pattern of G3C3 resembles that of A-DNA crystal structures and computer simulations, in that the central GC-rich region is more heavily hydrated than the flanking AT-rich base pairs (39–45).
Interduplex crystal contacts lead to only sparse hydration of the minor groove in G3C3, since the terminal base pair of a symmetrically related duplex packs into the minor groove and effectively squeezes out water molecules. Most of the crystallographically localized water molecules lie along the phosphate backbone or in the major groove. Water molecules bridge the phosphate groups of consecutive nucleotides in a manner often seen in A-DNA crystal structures. The interior O2P oxygen atoms are usually bridged by one water molecule while the exterior O1P oxygen atoms are bridged by two (Fig. 2A). Although the O1P-bridging water molecules are exposed to bulk solvent, their positions are presumably restrained by interduplex crystal contacts. The central GGGCCC region of the G3C3 structure reveals striking double spines of water molecules packed against the walls of the major groove (Fig. 2B). Each step along the double spine contains two water molecules aligned with a base pair. One water molecule hydrogen bonds with the N7 of guanine or the N4 of cytosine, and the other water molecule hydrogen bonds with O2P of the preceding 5′ nucleotide. Surprisingly, the internal double water spines and the exterior O1P-bridging water molecules possess comparable thermal B-factors, suggesting an equivalent rigidity of the two water structures. These highly ordered hydration motifs in the G-tract probably contribute to the solvent-dependent stabilization of the A/B-DNA intermediate duplex. Various forms of highly ordered hydration structures are believed to stabilize GC base pairs in the A-DNA conformation in low water environments (45). However, in higher water environments, A-DNA-associated ordered water structures, such as these double spines of hydration, would be less favorable than typical B-DNA hydration patterns that allow for greater interphosphate hydration and electrostatic screening (46). Thus, just as the minor groove water spine is believed to be one of the most important factors in the stabilization and rigidity of the B helix (47–49), ordered water structures in the major groove may turn out to be a fundamental factor determining the deformability of a G-tract duplex along the A↔B helix continuum.
Figure 2.

Stereos showing hydration patterns in G3C3. (A) Water molecules binding to phosphates. Those H-bonded to the outer O1P are yellow, while those bonded to the inner O2P are red. (B) Major groove hydration, with the double spine of water molecules in red, and other ordered water molecules in white.
Crystal packing
Symmetry related interduplex contacts in the G3C3 crystal structure are typical of those observed in A-DNA structures. The terminal base pair of one helix packs into the minor groove of a symmetry related helix (Fig. 3A). The large x-displacement of base pairs in A-DNA and G3C3 creates a wide and shallow minor groove. Hydrophobic interactions favor the packing of an aromatic base pair into the open minor groove (50). In G3C3, this packing is very loose, and the minor groove is only partially occupied. Two very similar base pair-minor groove packing geometries are seen in G3C3. The packing mode shown in Figure 3B has few close interactions between the two helices, with only four atom–atom contacts shorter than 3.5 Å. In contrast, the packing mode shown in Figure 3C has the terminal base pairs more intimately packed in the minor groove, with 21 atom–atom contacts shorter than 3.5 Å. Because of the crystal packing forces involving these contacts, terminal base pair G12:C13 adopts an unusual conformation with a high buckle (Fig. 4). Although this geometry clearly is energetically unfavorable, it is presumably stabilized by crystal packing forces (22). Such forces are known to be weak and actually can serve as useful probes of the deformability of a structure (51). This suggests that the potential energy functions determining duplex geometry are shallower than generally believed.
Figure 3.

Interactions between duplexes in the crystal. (A) Packing of a terminal base pair of one helix against one wall of the minor groove of a neighbor. (B and C) Details of two different packing interactions between the final base pair of one helix (dark lines) and the minor groove of another (light lines).
Figure 4.

Buckle distortion of terminal base pair G12/C13 (bottom) in the G3C3 helix. Base pairs from bottom to top are: C13/G12, G14/C11 and C15/G10. View into the minor groove.
G-tracts and the A↔B helix transition
The shallowness of the potential energy functions determining DNA geometry is consistent with the low estimates of the energy involved in an A↔B-DNA transition. For G-tracts, independent theoretical calculations estimate the thermodynamic barrier between A- and B-DNA to be no more than 0.2 kcal/mol per GpG base step in solution (12,52). In addition to the superior hydration of G-tracts as compared with A/T-rich sequences in A-DNA (39–42), G-tracts also possess special electrostatic properties that favor an A helix. Electrostatic repulsion between stacked GC base pairs in the B-DNA form creates a destabilizing tension that increases cooperatively with G-tract length (22,28–31,53). Tension is increased in a low water activity environment because of decreased solvent screening. This tension can be relieved by sliding bases along their long axes to produce the A form. In vivo, an equivalent phenomenon occurs when DNA approaches a protein, as the protein presents a dramatically lower dielectric environment than does bulk solvent (54). Decreased electrostatic screening by proteins favors the more A-like geometry of DNA observed in many crystal structures of DNA–protein complexes.
To return to the crystal structures, G2C2, with one GpG base step, adopts a B conformation, whereas G3C3, with only one additional GpG base step, adopts a radically different conformation intermediate between that of A- and B-DNA. All sequences in the Nucleic Acids Database containing three or more GpG base steps have been crystallized in the A form. The crystal structures of G-tract containing sequences support the base centered mechanism for A↔B helix transitions proposed by Calladine and Drew (55,56). The B→A helix transition is structurally equivalent to increasing the roll of the B helix from near 0 to +12° and changing the slide from near 0 to –1.5 Å. G3C3 corresponds to the hypothetical intermediate model proposed by Calladine and Drew in which the B helix has changed its slide but not its roll, suggesting a ‘slide first’ mechanism for the B→A transition (Fig. 5). This mechanism is fully consistent with P. Shing Ho’s proposed ordering of crystal structures of GGCGCC variants along the A↔B-DNA continuum (19,20) for which only ‘almost A’ helices have large values for roll. Furthermore, the crystal structure of GGGGCCCC, with a G-tract one guanine longer than G3C3, ‘is intermediate between the Calladine/Drew hypothetical model with high slide and no roll and their model for A-DNA’ (57). The crystal structure of CCCCGGGG possesses similar structural features to that of GGGGCCCC (58). As expected, with increasing lengths of consecutive guanines, crystallized DNA oligomers adopt geometries closer to that of archetypal A- than B-DNA.
Figure 5.
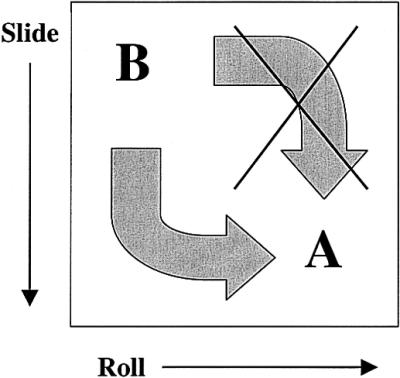
The ‘slide first, roll later’ pathway observed for the B→A transition. CATGGGCCCATG lies somewhere near the center of the non-cancelled curved arrow at lower left.
The special properties of G-tracts are reflected in the distribution of GpG base step parameters in protein–DNA crystal structures (Fig. 6). Protein–DNA crystal structures provide an empirical view into the deformability of DNA base steps because ‘the distortions of DNA brought about by many kinds of proteins effectively cancel one another… [and] after averaging over a large ensemble of complexes, the natural conformational response of DNA will surface’ (6). Thus, proteins effectively probe the limits of DNA flexibility. Such analyses have confirmed the stiffness of ApA base steps and the flexibility of pyrimidine–purine base steps (23). Roll and slide values from CURVES (24) calculations on 63 protein–DNA complexes show that individual GpG steps demonstrate a strong predisposition towards the A helix (Fig. 6). As interaction with proteins generally induces DNA to adopt a more A-like conformation, even relatively rigid ApA base steps demonstrate some A helix tendencies in crystal structures of protein–DNA complexes. In contrast, GpG base steps typically have larger negative values of slide and higher values of roll than ApA steps, reflecting their greater predisposition for the A form. Calculations of the potential energy surfaces for GpG base steps demonstrated their bi-stability in the A and B conformations (31,59). Moreover, GpG steps have a much wider distribution of slide values. The dramatic tolerance of GpG steps for sliding lends additional support to the ‘slide first’ pathway for the B→A transition.
Figure 6.

Distribution of roll and slide parameters for ApA (left) and GpG (right) base steps in 63 crystal structures of protein–DNA complexes. Boldface letters A and B indicate canonical values of roll and slide for A- and B-DNA, respectively. Values for slide in Å; values for roll in degrees.
DISCUSSION
Biological implications
The A↔B deformability of G-tracts provides a possible mode for regulating protein–DNA interactions. For example, crystallographic studies have shown that DNase I can bind to both an A-DNA and a B-DNA sequence but can only cleave the B-DNA sequence (2). Otwinowski et al. (1) concluded that the capability of a particular sequence to adopt an A-DNA-like conformation determines its binding activity for trp repressor. G-tracts occur in many important DNA sequences, including telomeres, the polypurine tract signaling termination of digestion by HIV RNase H (60), the binding site for transcription factor IIIA (61,62), and Sp1 promoter sites, which activate gene expression in the absence of a TATA box (63,64). G-tracts provide a dynamic structural motif for recognition through their unique ability to nucleate a B→A DNA transition when the dielectric environment is lowered in the vicinity of a protein. Protein recognition of A-DNA-like conformations such as G-tracts and RNA–DNA hybrids may be a vestige from an earlier RNA world, as double-stranded RNA invariably adopts the A form (65). Continued structural and computational studies will be useful for further understanding of the special properties of G-tracts and the mechanism of the A↔B-DNA transition.
Acknowledgments
ACKNOWLEDGEMENTS
The authors thank Mary L. Kopka and Jiri Sponer for much stimulating discussion.
REFERENCES
- 1.Otwinowski Z., Schevitz,R.W., Zhang,R.G., Lawson,C.L., Joachimiak,A., Marmorstein,R.W., Luisi,B.F. and Sigler,P.B. (1988) Crystal structure of trp repressor/operator complex at atomic resolution. Nature, 335, 321–329. [DOI] [PubMed] [Google Scholar]
- 2.Weston S.A., Lahm,A. and Suck,D. (1992) X-ray structure of the DNase I–d(GGTATACC)2 complex at 2.3 Å resolution. J. Mol. Biol., 226, 1237–1256. [DOI] [PubMed] [Google Scholar]
- 3.Guzikevich-Guerstein G. and Shakked,Z. (1996) A novel form of the DNA double helix imposed on the TATA-box by the TATA-binding protein. Nature Struct. Biol., 3, 32–37. [DOI] [PubMed] [Google Scholar]
- 4.Dickerson R.E. (1998) DNA bending: the prevalence of kinkiness and the virtues of normality. Nucleic Acids Res., 26, 1906–1926. [DOI] [PMC free article] [PubMed] [Google Scholar]
- 5.Lu X.J. and Olson,W.K. (2000) A-form conformational motifs in ligand-bound DNA structures. J. Mol. Biol., 300, 819–840. [DOI] [PubMed] [Google Scholar]
- 6.Olson W.K., Gorin,A.A., Lu,X.J., Hock,L.M. and Zhurkin,V.B. (1998) DNA sequence-dependent deformability deduced from protein–DNA crystal complexes. Proc. Natl Acad. Sci. USA, 95, 11163–11168. [DOI] [PMC free article] [PubMed] [Google Scholar]
- 7.Jones S., van Heyningen,P., Berman,H.M. and Thornton,J.M. (1999) Protein–DNA interactions: a structural analysis. J. Mol. Biol., 287, 877–896. [DOI] [PubMed] [Google Scholar]
- 8.Dickerson R.E. and Chiu,T.K. (1998) Helix bending as a factor in protein/DNA recognition. Biopolymers, 44, 361–403. [DOI] [PubMed] [Google Scholar]
- 9.Arnott S. (1999) Polynucleotide secondary structures: a historical perspective. In Neidle,S. (ed.), Oxford Handbook of Nucleic Acid Structure. Oxford Science, Oxford, pp. 1–38.
- 10.Ivanov V.I., Minchenkova,L.E., Schyolkina,A.K. and Poletayev,A.I. (1973) Different conformations of double-stranded nucleic acid in solution as revealed by circular dichroism. Biopolymers, 12, 89–110. [DOI] [PubMed] [Google Scholar]
- 11.Ivanov V.I., Minchenkova,L.E., Minyat,E.E., Frank-Kamenetskii,M.D. and Schyolkina,A.K. (1974) The B to A DNA transition of DNA in solution. J. Mol. Biol., 87, 817–833. [DOI] [PubMed] [Google Scholar]
- 12.Minchenkova L.E., Schyolkina,A.K., Chernov,B.K. and Ivanov,V.I. (1986) CC/GG contacts facilitate the B to A transition of DNA in solution. J. Biomol. Struct. Dyn., 4, 463–476. [DOI] [PubMed] [Google Scholar]
- 13.El Hassan M.A. and Calladine,C.R. (1997) Conformational characteristics of DNA: empirical classifications and a hypothesis for the conformational behaviour of dinucleotide steps. Phil. Trans. R. Soc. Lon. Ser. A, 355, 43–100. [Google Scholar]
- 14.Cheatham T.E. III, Srinivasan,J., Case,D.A. and Kollman,P.A. (1998) Molecular dynamics and continuum solvent studies of the stability of polyG–polyC and polyA–polyT DNA duplexes in solution. J. Biomol. Struct. Dyn., 16, 265–280. [DOI] [PubMed] [Google Scholar]
- 15.Ng H.-L., Kopka,M.L. and Dickerson,R.E. (2000) The structure of a stable intermediate in the A↔B-DNA helix transition. Proc. Natl Acad. Sci. USA, 97, 2035–2039. [DOI] [PMC free article] [PubMed] [Google Scholar]
- 16.Malinina L., Fernandez,L.G., Huynh-Dinh,T. and Subirana,J.A. (1999) Structure of the d(CGCCCGCGGGCG) dodecamer: a kinked A-DNA molecule showing some B-DNA features. J. Mol. Biol., 285, 1679–1690. [DOI] [PubMed] [Google Scholar]
- 17.Vargason J.M., Eichman,B.F. and Ho,P.S. (2000) The extended and eccentric E-DNA structure induced by cytosine methylation or bromination. Nat. Struct. Biol., 7, 758–761. [DOI] [PubMed] [Google Scholar]
- 18.Ng H.-L. and Dickerson,R.E. (2001) ‘Mildly eccentric’ E-DNA. Nat. Struct. Biol., 8, 107. [DOI] [PubMed] [Google Scholar]
- 19.Vargason J.M., Henderson,K. and Ho,P.S. (2001) A crystallographic map of the transition from B-DNA to A-DNA. Proc. Natl Acad. Sci. USA, 98, 7265–7670. [DOI] [PMC free article] [PubMed] [Google Scholar]
- 20.Dickerson R.E. and Ng,H.-L. (2001) DNA structure from A to B. Proc. Natl Acad. Sci. USA, 98, 6986–6988. [DOI] [PMC free article] [PubMed] [Google Scholar]
- 21.Goodsell D.S., Kopka,M.L., Cascio,D.C. and Dickerson,R.E. (1993) Crystal structure of CATGGCCATG and its implications for A-tract bending models. Proc. Natl Acad. Sci. USA, 90, 2930–2934. [DOI] [PMC free article] [PubMed] [Google Scholar]
- 22.Sponer J., Florián,J., Ng,H.-L., Sponer,J.E. and Spacková,N. (2000) Local conformational variations observed in B-DNA crystals do not improve base stacking: computational analysis of base stacking in a d(CATGGGCCCATG)2 B↔A intermediate crystal structure. Nucleic Acids Res., 28, 4893–4902. [DOI] [PMC free article] [PubMed] [Google Scholar]
- 23.Dickerson R.E. (1999) Helix structure and molecular recognition by B-DNA. In Neidle,S. (ed.), Oxford Handbook of Nucleic Acid Structure. Oxford Science, Oxford, pp. 145–198.
- 24.Lavery R. and Sklenar,H. (1988) The definition of generalized helicoidal parameters and of axis curvature for irregular nucleic acids. J. Biomol. Struct. Dyn., 6, 63–91. [DOI] [PubMed] [Google Scholar]
- 25.Berman H.M., Olson,W.K., Beveridge,D.L., Westbrook,J., Gelbin,A., Demeny,T., Hsieh,S.-H., Srinivasan,A.R. and Schneider,B. (1992) The nucleic acid database: a comprehensive relational database of three-dimensional structures of nucleic acids. Biophys. J., 63, 751–759. [DOI] [PMC free article] [PubMed] [Google Scholar]
- 26.Kraulis P.J. (1991) MOLSCRIPT: a program to produce both detailed and schematic plots of protein structures. J. Appl. Crystallogr., 24, 946–950. [Google Scholar]
- 27.Merritt E.A. and Bacon,D.J. (1997) Raster3D photorealistic molecular graphics. Methods Enzymol., 277, 505–524. [DOI] [PubMed] [Google Scholar]
- 28.ElHassan M.A. and Calladine,C.R. (1996) Propeller-twisting of base-pairs and the conformational mobility of dinucleotide steps in DNA. J. Mol. Biol., 259, 95–103. [DOI] [PubMed] [Google Scholar]
- 29.Sponer J., Gabb,H.A., Leszczynski,J. and Hobza,P. (1997) Base–base and deoxyribose–base stacking interactions in B-DNA and Z-DNA. A quantum chemical study. Biophys. J., 73, 76–87. [DOI] [PMC free article] [PubMed] [Google Scholar]
- 30.Sponer J., Leszczynski,J. and Hobza,P. (1996) Nature of nucleic acid base stacking—nonempirical ab initio and empirical potential characterization of 10 stacked base dimers—comparison of stacked and H-bonded base pairs. J. Phys. Chem., 100, 5590–5596. [Google Scholar]
- 31.Hobza P. and Sponer,J. (1996) Structure, energetics and dynamics of the nucleic acid base pairs: nonempirical ab initio calculations. Chem. Rev., 99, 3247–3276. [DOI] [PubMed] [Google Scholar]
- 32.Packer M.J., Dauncey,M.P. and Hunter,C.A. (2000) Sequence-dependent DNA structure: dinucleotide conformational maps. J. Mol. Biol., 295, 71–83. [DOI] [PubMed] [Google Scholar]
- 33.Trantírek L., Stefl,R., Vorlicková,M., Koča,J., Sklenár,V. and Kypr,J. (2000) An A-type double helix of DNA having B-type puckering of the deoxyribose rings. J. Mol. Biol., 297, 513–524. [DOI] [PubMed] [Google Scholar]
- 34.Stefl R., Trantírek,L., Vorlicková,M., Koča,J., Sklenár,V. and Kypr,J. (2001) A-like guanine–guanine stacking in the aqueous DNA duplex of d(GGGGCCCC). J. Mol. Biol., 307, 513–524. [DOI] [PubMed] [Google Scholar]
- 35.Kielkopf C.L., Ding,S., Kuhn,P. and Rees,D.C. (2000) Conformational flexibility of B-DNA at 0.74 Å resolution. J. Mol. Biol., 296, 787–801. [DOI] [PubMed] [Google Scholar]
- 36.Schuerman G.S. and Van Meervelt,L. (2000) Conformational flexibility of the DNA backbone. J. Am. Chem. Soc., 122, 232–240. [Google Scholar]
- 37.Heinemann U. (1991) A note on crystal packing and global helix structure in short A-DNA duplexes. J. Biomol. Struct. Dyn., 8, 801–811. [DOI] [PubMed] [Google Scholar]
- 38.Eisenstein M. and Shakked,Z. (1995) Hydration patterns and intermolecular interactions in A-DNA crystal structures. Implications for DNA recognition. J. Mol. Biol., 248, 662–678. [DOI] [PubMed] [Google Scholar]
- 39.Tippin D.B. and Sundaralingam,M. (1997) Comparison of major groove hydration in isomorphous A-DNA octamers and dependence on base sequence and local helix geometry. Biochemistry, 36, 536–543. [DOI] [PubMed] [Google Scholar]
- 40.Feig M. and Pettitt,B.M. (1998) A molecular simulation picture of DNA hydration around A- and B-DNA. Biopolymers, 48, 199–209. [DOI] [PubMed] [Google Scholar]
- 41.Feig M. and Pettitt,B.M. (1999) Modeling high-resolution hydration patterns in correlation with DNA sequence and conformation. J. Mol. Biol., 286, 1075–1095. [DOI] [PubMed] [Google Scholar]
- 42.Elcock A.H. and McCammon,J.A. (1996) Sequence dependent hydration of DNA—theoretical results. J. Am. Chem. Soc., 117, 10161–10162. [Google Scholar]
- 43.Auffinger P. and Westhof,E. (2000) Water and ion binding around RNA and DNA (C,G) oligomers. J. Mol. Biol., 300, 1113–1131. [DOI] [PubMed] [Google Scholar]
- 44.Auffinger P. and Westhof,E. (2001) Water and ion binding around r(UpA)12 and d(TpA)12 oligomers—comparison with RNA and DNA (CpG)12 duplexes. J. Mol. Biol., 305, 1057–1072. [DOI] [PubMed] [Google Scholar]
- 45.Schneider B., Patel,K. and Berman,H.M. (1998) Hydration of the phosphate group in double-helical DNA. Biophys. J., 75, 2422–2434. [DOI] [PMC free article] [PubMed] [Google Scholar]
- 46.Saenger W., Hunter,W.N. and Kennard,O. (1986) DNA conformation is determined by economics in the hydration of phosphate groups. Nature, 324, 385–388. [DOI] [PubMed] [Google Scholar]
- 47.Lan T. and McLaughlin,L.W. (2000) Minor groove hydration is critical to the stability of DNA duplexes. J. Am. Chem. Soc., 122, 6512–6513. [Google Scholar]
- 48.Lan T. and McLaughlin,L.W. (2001) Minor groove functional groups are critical for the B-form conformation of duplex DNA. Biochemistry, 40, 968–976. [DOI] [PubMed] [Google Scholar]
- 49.Drew H.R. and Dickerson,R.E. (1981) Structure of a B-DNA dodecamer. III. Geometry of hydration. J. Mol. Biol., 152, 723–726. [DOI] [PubMed] [Google Scholar]
- 50.Wahl M. and Sundaralingam,M. (1997) Crystal structures of A-DNA duplexes. Biopolymers, 44, 45–63. [DOI] [PubMed] [Google Scholar]
- 51.Dickerson R.E., Goodsell,D.S. and Neidle,S. (1994) The tyranny of the lattice. Proc. Natl Acad. Sci. USA, 91, 3579–3583. [DOI] [PMC free article] [PubMed] [Google Scholar]
- 52.Foloppe N. and MacKerell,A.D.,Jr (1999) Intrinsic conformational properties of deoxyribonucleosides: implicated role for cytosine in the equilibrium among the A, B and Z forms of DNA. Biophys. J., 76, 3206–3216. [DOI] [PMC free article] [PubMed] [Google Scholar]
- 53.Mazur J., Sarai,A. and Jernigan,R.L. (1989) Sequence dependence of the B–A conformational transition of DNA. Biopolymers, 28, 1223–1233. [DOI] [PubMed] [Google Scholar]
- 54.Elcock A.H. and McCammon,J.A. (1996) The low dielectric interior of proteins is sufficient to cause major structural changes in DNA on association. J. Am. Chem. Soc., 118, 3787–3788. [Google Scholar]
- 55.Calladine C.R. and Drew,H.R. (1984) A base-centered explanation of the B-to-A transition in DNA. J. Mol. Biol., 178, 773–782. [DOI] [PubMed] [Google Scholar]
- 56.Calladine C.R. and Drew,H.R. (1997) Understanding DNA: The Molecule and How It Works. Academic Press, San Diego, CA.
- 57.McCall M., Brown,T. and Kennard,O. (1985) The crystal structure of d(GGGGCCCC): a model for poly(dG)·poly(dC). J. Mol. Biol., 183, 385–396. [DOI] [PubMed] [Google Scholar]
- 58.Haran T.E., Shakked,Z., Wang,A.H.-J. and Rich,A. (1987) The crystal structure of d(CCCCGGGG): a new A-form variant with an extended backbone conformation. J. Biomol. Struct. Dyn., 5, 199–216. [DOI] [PubMed] [Google Scholar]
- 59.Sarai A., Mazur,J., Nussinov,R. and Jernigan,R.L. (1989) Sequence dependence of DNA conformational flexibility. Biochemistry, 28, 7842–7849. [DOI] [PubMed] [Google Scholar]
- 60.Palaniappan C., Fuentes,G.M., Rodriguez-Rodriguez,L., Fay,P.J. and Bambara,R.A. (1996) Helix structure and ends of RNA/DNA hybrids direct the cleavage specificity of HIV-1 reverse transcriptase RNase H. J. Biol. Chem., 271, 2063–2070. [PubMed] [Google Scholar]
- 61.Rhodes D. and Klug,A. (1986) An underlying repeat in some transcriptional control sequences corresponding to half a double helical turn of DNA. Cell, 46, 123–132. [DOI] [PubMed] [Google Scholar]
- 62.McCall M., Brown,T., Hunter,W.N. and Kennard,O. (1986) The crystal structure of d(GGATGGGAG) forms an essential part of the binding site for transcription factor IIIA. Nature, 322, 661–664. [DOI] [PubMed] [Google Scholar]
- 63.Pavletich N.P. and Pabo,C.O. (1991). Zinc-finger-DNA recognition: crystal structure of a Zif258–DNA complex at 2.1 Å. Science, 252, 809–817. [DOI] [PubMed] [Google Scholar]
- 64.Pavletich N.P. and Pabo,C.O. (1993) Crystal structure of a five-finger GLI–DNA complex: new perspectives on zinc fingers. Science, 261, 1701–1707. [DOI] [PubMed] [Google Scholar]
- 65.Jeffares D.C., Poole,A.M. and Penny,D. (1998) Relics from the RNA world. J. Mol. Evol., 46, 18–36. [DOI] [PubMed] [Google Scholar]