

Abstract
A dramatic example of neuronal and physiological plasticity in adult mammals occurs during the transition from a non-maternal to a maternal, lactating state. In this study we compared gene expression within a large continuous region of the CNS involved in maternal behaviors (hypothalamus, preoptic regions, and nucleus accumbens) between lactating (L) (postpartum Day 7) and randomly cycling virgin (V) outbred mice. Using high density oligonucleotide arrays representing 11,904 genes, two statistical algorithms were used to identify significant differences in gene expression: robust multi array (p < 0.001) (n = 92 genes) and significance analysis of microarrays using a 10% false discover rate (n = 114 genes). 27 common genes were identified as significant using both techniques. A subset of genes (n = 5) were selected and examined by real-time PCR. Our findings were consistent with previous published work. For example, neuropeptide Y (NPY) and proenkephalin were elevated in L mice, whereas POMC was decreased. Increased levels of NPY Y2 receptor and polo-like kinase and decreased levels of endothelin receptor type b in L mice are examples of novel gene expression changes not previously identified. Expression differences occurred in broad classes. Together, our findings provide possible new material on gene expression changes that may support maternal behaviors. The advantages and drawbacks of sampling large CNS regions using arrays are discussed.
Keywords: microarray, mouse, hypothalamus, lactation, preoptic area, nucleus accumbens
1. Introduction
In mammals, the transition from a virgin (V) to a lactating (L) state is arguably the most dramatic example of physiological and behavioral changes occurring in adulthood. In addition to physical changes, such as mammary gland growth [19] and milk production [29], a number of concomitant changes occur in the CNS to support a new suite of physiological processes and behaviors that include nursing, nurturing, and protective behaviors [31]. The hypothalamus and preoptic area (including nucleus accumbens) are regions implicated in the control of a range of maternal or parental behaviors [31] and alterations in structure and gene expression in these regions during lactation have been reported. For example, neuronal reorganization occurs in the supraoptic nucleus [43] along with concomitant changes in electrical properties [42] and these likely support milk release during suckling. Increased expression of neuropeptide Y (NPY) in the arcuate nucleus likely supports increased feeding by the dam that occurs during lactation [8,38]. An elevation of enkephalin [8,28,33,49,51] may also enhance the reward properties of offspring to the L female.
Rising and falling levels of estradiol and progesterone acting on steroid receptors during pregnancy likely orchestrate many of the changes in gene expression observed during lactation [3,25,44,45]. At the time of high parental behavior (mid-lactation) in mice, though, levels of these steroid hormones are low [45]. Also, sensory input from offspring can alter gene expression of neuropeptides [8,28,49], indicating a non-steroidal contribution to gene expression regulation during lactation. Although changes in the expression of genes already known to be involved in maternal behaviors have been identified, it is possible that many other genes both show altered expression during lactation and have an important role in maternal behaviors, but have not yet been identified.
This study involved examining broad differences in gene expression between L and V mice. It examines a region of the CNS involved in maternal behaviors using high-density oligonucleotide microarrays that allowed for the simultaneous examination of ~ 11,000 genes. The aim of study was to identify a new set of differentially expressed genes that may make important and hitherto unknown contributions to maternal care. The examination of a relatively large portion of the CNS has been used successfully in other studies [39] and here was considered as a trade-off. Important trends in gene expression changes could be observed that may have been missed by examining just one subregion, but sensitivity could be decreased due to dilution effects. Furthermore, opposing changes in expression within different regions could lead to false negatives. L mice were compared with randomly cycling V mice to highlight genes with significant enough changes in expression between the two groups that they could be detected above the noise of any gene expression changes occurring within the V group. A number of factors contribute to the formation of the lactating brain: the experience of mating, pregnancy, parturition, lactation and the sensory input of pups. Thus, this study examined the results of this constellation of experiences by examining gene expression differences between V mice that have never been exposed to any of these experiences, and L mice have been exposed to all of them. We report here the gene expression profiles of V and L mice using high-density oligonucleotide microarrays, identify new genes of interest, compare results to previous studies, and discuss the relevance of gene expression changes to the biology of lactation.
2. Materials and methods
2.1 Animals
Outbred hsd:ICR mice (Mus domesticus) (Harlan, Madison, WI) were used. All animals were age matched (~70 days old at time of dissection). For mating, females were housed two to a cage with one breeder male (hsd:ICR strain) for 2 weeks. At the same time, V females were co-housed three to a cage. When breeder males were removed, all females (pregnant and virgin) were housed singly and provided precut nesting material until dissections. The timing of co-housing and isolation was performed to minimize the effects of isolation-induced stress [2,6]. Polypropylene cages were changed once weekly, but when pups were born (postpartum Day 0), cages were not changed for any animals for the remainder of the experiment. All animals were housed in the same room and cages of V and L females were alternated with one another on the same shelves. The mean Day postpartum for dissection of L females was 6.8 ± 0.3 and the mean number of pups was 12.5 ± 1.1. A 14:10 light/dark cycle with lights on at 0600 CST was used. Female mice were given ad lib access to breeder chow (Harlan) and tap water. All animal work was conducted with accepted standards of humane care and studies were approved by the University of Wisconsin animal care and use committee.
2.2 Tissue collection
On postpartum Day 7 (± 1 day), brains were removed from L females between 10:00 and 12:00 h. Brains from age-matched, randomly cycling V females were also removed on the same day and dissections were alternated between the two groups so that an equal number of dissections from each group were performed on each of two consecutive days. The animals were killed by cervical dislocation and then decapitated. The whole brain was removed and hypothalamus (along with preoptic area, including nucleus accumbens) was dissected by following fiber tracts in the brain (Fig. 1). In brief, the brain was placed ventral side up on top of an ice-filled glass Petri dish and viewed under a dissecting scope. Using a razor blade, the front of the CNS was sectioned to Bregma 0.86 mm using the ridge of the olfactory tubercle on the ventral surface as a marker. Then, using curved forceps, the cortex was peeled back along the frontal section of the brain until the striated tissue of the caudate putamen was visible. The striatal tissue was then peeled away until the anterior commissure became visible. The peeling of cortex and striatal tissue began in the anterior portion of the brain and progressed posteriorly. In the middle CNS sections the internal capsule acted as the critical guide for separating dorsal and ventral tissue. More posteriorly, the cerebral peduncle acted as the guide for separating tissue. Once completely separated from the enclosing dorsal CNS, the dissected preoptic area/hypothalamic transcriptome from each female was used in this study and was subjected to total RNA extraction using the guanidinium isothiocyanate method (TRIZOL Reagent, Life Technologies, Grand Island, NY). Consistency of dissection was verified for each brain as described below.
Fig. 1.
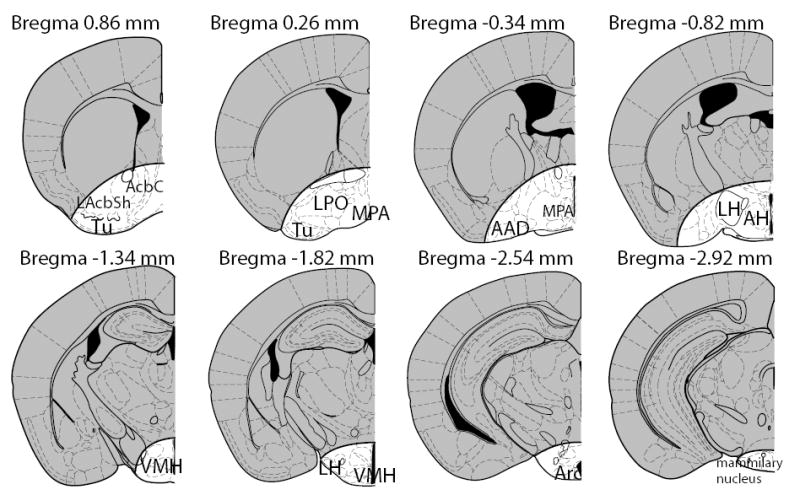
Schematic representation of the brain regions (light, non-gray) dissected for gene array analysis. Abbreviation are: anterior amygdaloid area (AAD); accumbens core (AcbC); anterior hypothalamic area (AH); arcuate nucleus (Arc); lateral accumbens shell (LAcbSh); lateral hypothalamus (LH); lateral preoptoc area (LPO); medial preoptic area (MPA); olfactory tubercle (Tu); ventromedial nucleus of the hypothalamus (VMH).
2.3 Processing and analysis of Nissl-stained tissue
After removal of the preoptic area/hypothalamus, the remaining brain was immersion fixed overnight in 4% paraformaldehyde and cryoprotected in 30% sucrose in PBS for 2 days. Brains were frozen on a platform and cut into 40 micron thick sections using a sliding microtome (Leica, Microsystems, Heidelberg, GERMANY). Every 5th section was collected, mounted on a glass slide, processed for Nissl staining, dehydrated, and coverslipped. Printouts for the preoptic area/hypothalamus regions of the mouse brain were made from the mouse atlas [34] for each mouse. Nissl-stained sections were projected in bright-field from an Axiocam Zeiss microscope (Zeiss, Gottingen, GERMANY) and an outline on the remaining (non-dissected) brain was drawn over the atlas illustrations. From 17 V brains and 14 L brains, the 6 from each group that best matched the ideal dissection were used for RNA purification and analysis using gene arrays (n = 6 per group). For real-time PCR the same RNA samples were used to examine three genes: Fos, cpb/p300 interacting transcactivator (CITED2) and polo-like kinase 2 (Plk2), but samples from different L and V mice were used to examine enkephalin and POMC. GAPDH was examined using both RNA sets. A profile of the regions dissected are shown in Fig. 1.
2.4 High-Density Oligonucleotide Array Hybridization
Each mouse transcriptome was assayed individually, one oligonucleotide array per mouse brain. All messenger RNAs present in 10 μg of total RNA per individual were converted to double-stranded cDNA (Superscript Choice System, Life Technologies) and used as templates to synthesize biotin-labeled cRNA (T7 Megascript kit, Ambion, Austin, TX). Integrity and degradation status of total RNA was determined prior to processing on an Agilent Bioanalyzer (Agilent Technologies, Palo Alto CA) which computes the ratio of ribosomal bands and the degradation factor. Biotin-labeled cRNA was purified using RNeasy affinity columns (Qiagen, Valencia, CA). We hybridized cRNA to high-density mouse oligonucleotide arrays (MU74Av2, Affymetrix, Santa Clara, CA) as described [20]. Control RNA supplied by Affymetrix was added to each sample RNA to check for hybridization quality. After hybridization, the gene arrays were washed and stained in a fluidic station (Model 800101, Affymetrix) and scanned at a resolution of 6μm with a Hewlett-Packard GeneArray Scanner (Model 900154, Affymetrix).
2.5 Preliminary Data Analysis by Affymetrix Algorithms
The Affymetrix MG-U74Av2 array contains 12,422 probe sets representing 11,904 known or putative genes. GeneChip Analysis Suite 4.1 was used to quantify the image data. Affymetrix software determines the presence of mRNA in samples and computes the signals of probe sets. Approximately 16 probe pairs of oligonucleotide probes in a probe set (16 perfect match (PM) and 16 mismatch (MM) probes) are used to measure the transcript level of a gene. The PM and MM allows direct subtraction of cross-hybridization signals after background subtraction. The software calculates differences and ratios between PM and MM signals, which are representative of the hybridization levels of their targets in each probe set. For a gene to be deemed present, it needed to pass a set of three tests: that the PM to MM ratio was greater than 4, that the proportion of positive probe sets over the total number of probe sets was greater than 0.43 and that the log of the sum of the PM to MM ratios of a probe set was greater than 1.3. The average of the differences between PM and MM signals (after removing the outliers beyond 3 standard deviations) is used to estimate relative mRNA levels of the transcripts. Signals in each image are normalized by global scaling, in which the average signals of all probe sets in an image were scaled to an arbitrary target average intensity by multiplying a scaling factor of 500. We used the resulting variable, an individual’s probe set signal intensity (“signal intensity”) for each gene, as the dependent variable in statistical analysis (see below). In our results tables, we include the fold change in average signal intensity from V to L individuals. Numbers greater than 1 indicate that a gene was significantly elevated in L females, and numbers less than 1 indicate that a gene was significantly decreased in L compared with V females.
2.6 Statistical Analysis
Robust multiarray analysis (RMA) [13,15] was run on the data set using ArrayAssist (Iobian Informatics, La Jolla, CA). RMA models are additive on the log2 intensity scale with additive error and are fit iteratively for each probe set. RMA analysis was applied to all ~ 12,000 genes because it does not exclude genes based on “presence” or “absence” on individual chips.
In a second analytical approach, we applied a conservative definition of gene expression to the ~12,000 genes that were analyzed. To warrant inclusion in subsequent analyses, a gene had to be expressed in all six individuals in at least one of the two groups. 5,502 genes met this criterion. Expression levels of these 5,502 genes were subjected to a false discovery rate query using the significance analysis of microarrays (SAM) algorithm [48]. Based on this analysis, a 10% false discovery rate was achieved by using a nominal P-value cutoff of 0.018 in a simple t-test comparing the mean signal intensity of L versus V mice.
2.7 Verification of microarray with real-time PCR
Tissue was dissected and stored frozen at −70ºC as described above. Total RNA was isolated using an RNeasy Protect Mini Kit (Cat#74124, Qiagen). Following isolation, RNA concentration was determined using a BioMate 3 spectrophotometer (Thermo Spectronic, Lanham, MD) and stored at −70ºC until processed for PCR. A StrataScript First Strand Synthesis system kit (Cat# 200420, Stratagene, Cedar Creek, TX) was used to reverse transcribe 1–5 μg of RNA to cDNA in an Eppendorf MasterCycler Personal PCR machine. The cDNA was then amplified using a Brilliant Sybr Green QPCR MasterMix kit (Cat# 600548, Stratagene) in a Stratagene Mx3000P Real-time PCR system. The amplification protocol is as follows: an initial melting step at 95ºC for 5 min followed by 30 cycles of a 95ºC melting step for 1 min, a 60ºC annealing step for 1 min, and a 72ºC elongation step for 1 min. Following amplification, a dissociation curve analysis was performed to insure purity of PCR products. The primers were synthesized by Invitrogen (Carlsbad, CA) and their locations are shown in Table 1. Data were analyzed using the ΔΔCT method [23]. GAPDH was used as a reference gene in this method, as it is considered a housekeeping gene and found not to be different between L and V females in our arrays results. Briefly, the average CT of the reference gene (GAPDH) was subtracted from the average CT of the gene of interest (i.e., enkephalin and POMC) to determine the ΔCT for each sample. The ΔCT of the calibrator (an untreated control) is then subtracted from the ΔCT of each of the samples to determine the ΔΔCT. This number is then used to determine the amount of mRNA relative to the calibrator and normalized by GAPDH, or the n-fold difference. The n-fold difference was calculated by the equation 2(−Δ ΔCT).
Table 1.
List of genes and the primers used (along with primer position) for real-time PCR analysis.
| Gene | Primer | Primer position | |
|---|---|---|---|
| CITED2 | Forward | 5′-TGT CCC TCT ATG TGC TGC TG-3′ | 130 – 149 |
| Reverse | 5′-ATG GTC TGC CAT TTC CAG TC-3′ | 213 – 232 | |
| Enkephalin | Forward | 5′-GAC AGC AGC AAA CAG GAT GA-3′ | 558 – 577 |
| Reverse | 5′-GTT GTC TCC CGT TCC CAG TA-3′ | 781 – 800 | |
| Fos | Forward | 5′-CCC GTA GAC CTA GGG AGG AC-3′ | 407 – 426 |
| Reverse | 5′-CAA TAC ACT CCA TGC GGT TG-3′ | 572 – 591 | |
| GAPDH | Forward | 5′-TCG TGG ATC TGA CGT GCC GCC TG -3′ | 777 – 799 |
| Reverse | 5′-CAC CAC CCT GTT GCT GTA GCC GTA T -3′ | 1003 – 1027 | |
| Plk2 | Forward | 5′-GAG CTC CTG CGG ACT ATC AC-3′ | 119 – 138 |
| Reverse | 5′-ACT TTG CAA ATC CAC CCT TG-3′ | 373 – 392 | |
| POMC | Forward | 5′- CCC AAC GTT GCT GAG AAC GAG TCG-3′ | 342 – 365 |
| Reverse | 5′- GGA GGT CAT GAA GCC ACC GTA ACG-3′ | 513 – 536 |
3. Results
3.1 Gene expression in the preoptic area/hypothalamus
RMA analysis of the 11,904 genes using a P < 0.001 cut-off value identified 92 genes with significant changes in expression. Of those, the known genes are shown in Table 2. The full list of all 11,904 genes, their relative expression, and p-value ranking using RMA is presented in Supplemental Table 1.
Table 2.
List of genes showing significant differences in gene expression when analyzed with RMA (P < 0.001), SAM (P < 0.018)†, or both*. Fold increases greater than 1.0 indicate increases in L relative to V mice.
| Accession # | Fold | Gene |
|---|---|---|
| NEUROPEPTIDES | ||
| M55181* | 1.34 | proenkephalin A precursor (met- enkephalin; leuenkephalin) |
| AI848386† | 1.33 | neuropeptide Y |
| D17584* | 1.25 | tachykinin 1 (substance P, neurokinin A, neuromedin L; neuropeptide K) |
| AV173687* | 0.70 | glycoprotein hormones, alpha subunit (FSH-, LH-, thyrotropin-,TSH-alpha) |
| J00612* | 0.55 | pro-opiomelanocortin-alpha (ACTH, MSH, beta-endorphin, beta-lipotropin) |
| J00643† | 0.49 | glycoprotein hormones, alpha subunit |
| RECEPTORS | ||
| X66118† | 1.32 | glutamate receptor, ionotropic kainate 1 precursor |
| X55674† | 1.32 | D(2) dopamine receptor |
| M80481 | 1.31 | G protein-coupled receptor 83 |
| AV372577* | 1.22 | neuropeptide Y receptor Y2 |
| AU020229† | 0.74 | frizzled homolog 3 (Drosophila) |
| AF011411 | 0.72 | vomeronasal 2, receptor, 1 |
| U32329* | 0.59 | endothelin receptor type B |
| CELL DIVISION, DEATH, & DIFFERENTIATION | ||
| AI504013 | 1.38 | suppression of tumorigenicity 7 |
| U95826* | 1.23 | cyclin G2 |
| AA636547† | 0.71 | cell division cycle 5-like |
| ION CHANNELS | ||
| AF107780† | 0.77 | potassium voltage-gated channel, Sha1-related family, member 2 |
| AJ131398 | 0.71 | potassium voltage-gated channel, Isk- related family, member 1-like |
| SIGNAL TRANSDUCTION- KINASES | ||
| AW046181† | 1.47 | serum/glucocorticoid regulated kinase |
| M96163 | 1.28 | polo-like kinase |
| AB000828† | 1.18 | TYRO3 protein tyrosine kinase 3 |
| X69026† | 0.84 | serine/threonine-protein kinase PCTAIRE-3 |
| SIGNAL TRANSDUCTION- PHOSPHATASES | ||
| AI854289† | 1.28 | protein phosphatase 2 (formerly 2A), regulatory subunit B (PR 52), alpha isoform |
| AI845584† | 1.27 | dual specificity phosphatase 6 |
| SIGNAL TRANSDUCTION- CALCIUM SIGNALING | ||
| AB015200† | 1.41 | neuron specific calcium-binding protein hippocalcin (P23K) |
| M21530† | 1.37 | inositol 1,4,5-triphosphate receptor 1 |
| X15373† | 1.37 | inositol 1,4,5-triphosphate receptor 1 |
| D38218† | 1.33 | ryanodine receptor 3 |
| X17320* | 1.18 | purkinje cell protein 4; calcium binding inferred |
| AF085192† | 0.88 | hippocalcin-like 1 |
| SIGNAL TRANSDUCTION- GENERAL | ||
| AJ005983* | 1.65 | cyclic AMP phosphoprotein |
| U88327* | 1.33 | suppressor of cytokine signaling 2 |
| D38218† | 1.33 | ryanodine receptor 3 |
| U28423† | 1.23 | DnaJ (Hsp40) homolog, subfamily C, member 3 |
| AW046376† | 1.16 | Fbox and WD40 domain |
| U67187* | 1.15 | regulator of G-protein signaling 2 |
| AI835712 | 0.88 | RAB34, member RAS oncogene family |
| AF031147 | 0.87 | cGMP-specific phosphodiesterase |
| GROWTH FACTORS/SIGNALING MOLECULES | ||
| L12030† | 1.23 | chemokine (C-X-C motif) ligand 12 |
| M57647 | 1.20 | kit ligand |
| M92420 | 1.11 | transforming growth factor alpha |
| STEROID SYNTHESIS | ||
| AW106745† | 0.81 | NAD(P) dependent steroid dehydrogenase-like |
| TRANSCRIPTION FACTORS | ||
| AI957030† | 1.29 | unknown; zinc finger like |
| U48363† | 1.29 | nascent polypeptide-associated complex alpha polypeptide |
| AB013357† | 1.24 | zinc finger protein 207 |
| U06924† | 1.22 | signal transducer and activator of transcription 1 |
| Y15163* | 1.20 | Cbp/p300-interacting transactivator |
| X68363† | 1.18 | octamer-binding transcription factor 1 |
| U80078† | 0.83 | zinc finger protein 148 |
| DNA RELATED FUNCTION | ||
| X70956† | 1.33 | topoisomerase (DNA) I |
| AI835367† | 1.32 | matrin 3 |
| AA646966† | 1.29 | H2A histone Family |
| X69942† | 1.26 | SWI/SNF-related, matrix-associated actin-dependent regulator of chromatin |
| X61449* | 1.23 | nucleosome assembly protein 1-like 1 |
| D38046† | 1.21 | DNA topoisomerase II, beta isozyme |
| AF047355 | 0.71 | deoxyribonuclease 1-like 3 |
| NEUROIMMUNE | ||
| AI850558 | 1.69 | alpha-2-macroglobulin |
| M22531† | 1.36 | complement C1q subcomponent, B chain precursor |
| X58861† | 1.28 | complement C1q subcomponent, A chain precursor. |
| AI854285† | 1.23 | influenza virus NS1A binding protein |
| AW045204† | 1.22 | unknown; T-cell activation protein phosphatase 2C ortholog |
| U92565 | 1.14 | chemokine (C-X3-C motif) ligand 1 |
| AJ006289 | 0.89 | B-cell leukemia/lymphoma 10 |
| AF099808 | 0.86 | T-cell receptor alpha, joining region |
| RNA RELATED FUNCTION | ||
| AI848222† | 1.35 | unknown; mRNA splicing inferred |
| AW049326* | 1.24 | nucleolar protein family A, member 3 |
| U65735† | 1.18 | ELAV (embryonic lethal, abnormal vision, Drosophila)-like 1 |
| AI849718† | 1.16 | eukaryotic translation initiation factor 4f ortholog |
| AB016424† | 0.75 | Putative RNA-binding protein 3 (RNA binding motif protein 3). |
| AW060526† | 0.73 | RNA methyltransferase |
| MITOCHONDRIA RELATED | ||
| AI156731† | 1.33 | unknown; mitochodrial transcription termination factor-related |
| AI846452† | 1.25 | unknown; mitochondrial ribosomal protein S36-human |
| AI854821† | 0.80 | acyl coenzymeA thioesterase 2, mitochondrial |
| AV153195† | 0.70 | NADH dehydrogenase (ubiquinone) 1 alpha subcomplex, 3 |
| AV095915 | 0.33 | isocitrate dehydrogenase 3 (NAD+) alpha |
| STRUCTURAL | ||
| AW122834* | 1.59 | hypothetical protein A830006N08 |
| U06483† | 1.56 | intercellular adhesion molecule-5 precursor |
| AF084482* | 1.32 | wolfram syndrome 1 homolog (human) |
| D29763† | 1.30 | seizure related gene 6 |
| AI747654† | 1.30 | caveolin |
| AW123402† | 1.28 | unknown; integral to membrane inferred |
| U30244* | 1.24 | ephrin-B2 precursor |
| U44088† | 1.22 | pleckstrin homology-like domain, family A, member 1 |
| AI195392 | 1.22 | actinin, alpha 1 |
| Y19186† | 1.21 | piccolo |
| AJ001373* | 1.19 | integrin beta-1 binding protein 1 |
| AB016784† | 1.18 | golgi autoantigen, golgin subfamily a, 5 |
| AI854665 | 0.88 | exportin 6 |
| U57686 | 0.87 | embryonal Fyn-associated substrate |
| AI854506† | 0.86 | unknown; pleckstrin-like |
| AI851574† | 0.84 | melanoma antigen D, 2 |
| AF022432 | 0.83 | matrix metalloproteinase 14 |
| AF103809† | 0.83 | adapter-related protein complex 3 beta 1 subunit |
| AW212495† | 0.81 | procollagen, type IX alpha 3 |
| AB025258† | 0.77 | synaptotagmin |
| X60961† | 0.76 | epithelial-cadherin precursor |
| AF019385† | 0.75 | heparan sulfate (glucosamine) 3-O- sulfotransferase 1 |
| AB010266 | 0.73 | tenascin XB |
| AW123921† | 0.70 | disabled homolog 2 (Drosophila) |
| U04827* | 0.67 | fatty acid binding protein 7, brain |
| U89997 | 0.61 | syntrophin, basic 1 |
| AI047972 | 0.47 | transmembrane 4 superfamily member 3 |
| METABOLISM | ||
| AV255366 | 1.62 | ornithine decarboxylase, structural |
| AI845009 | 1.44 | argininosuccinate lyase |
| AA726364 | 1.35 | lipoprotein lipase |
| AI846531† | 1.29 | arginyl aminopeptidase |
| AF032128* | 1.21 | ornithine decarboxylase antizyme inhibitor |
| U28960* | 0.87 | phospholipid transfer protein precursor (lipid transfer protein II). |
| M33974 | 0.87 | salivary protein 1 |
| AW045533* | 0.84 | farnesyl diphosphate synthetase |
| D16580† | 0.84 | protein-arginine deiminase type II |
| AI020259† | 0.83 | UV radiation resistance associated gene |
| AI840971† | 0.80 | brain protein 17 |
| X70393* | 0.78 | inter-alpha trypsin inhibitor, heavy chain 3 |
| AV271750 | 0.77 | ubiquitin specific protease 14 |
| AW122260† | 0.75 | cytochrome p450, 51 |
| AF003348† | 0.75 | Niemann Pick type C1 |
| D10215 | 0.42 | casein gamma |
| BLOOD | ||
| M15268† | 1.91 | 5-aminolevulinic acid synthase, erythroid-specific |
| V00722 | 1.85 | hemoglobin beta-2 chain (B2) (Minor) |
| V00714* | 1.65 | hemoglobin alpha adult chain 1 |
| J00413* | 1.60 | hemoglobin beta-1 chain (B1) (Major) |
| AF006741 | 1.42 | coagulation factor C homolog |
| AV003378* | 1.25 | hemoglobin alpha, adult chain 1 |
| AI836509 | 1.11 | unknown; hematopoietic stem cell protein ortholog |
| X13752* | 0.70 | aminolevulinate, delta-, dehydratase |
| AJ007909† | 0.64 | erythroid differentiation regulator 1 |
| AI153421† | 0.61 | unknown; similar to erythroid differentiation regulator |
For our second analytical approach using the SAM algorithm, 5,502 (~46 %) met criterion. Thus, there were 5,502 genes on which we conducted a test comparing expression levels between V and L mice. Of these genes, 114 (~2%) showed significant differences between V and L females with a false discovery rate of 10%. Of those, the known genes are shown in Table 2 and are marked with an † symbol. Genes identified as exhibiting significant changes in expression using both statistical approaches are denoted with a * symbol.
The genes that displayed significantly decreased expression in L versus V mice were distributed across a number of categories (Table 2). The function/category of each gene was determined individually using PubMed and GenBank databases. A number of our findings of gene expression changes are consistent with previous reports (see Discussion below). The expression of some genes has previously been shown not to be altered during lactation (e.g., hypocretin and GAPDH), and we also found a lack of change in expression for these genes, (see Supplemental Table 1).
3.2 Real-time PCR analysis
Confirming the high-density oligonucleotide array results, we found that enkephalin, CITED2, and Plk2 mRNA levels relative to the calibrator and normalized by GAPDH were significantly increased in L mice as compared to V mice (Fig. 2). In contrast, POMC mRNA levels relative to the calibrator and normalized by GAPDH were significantly decreased in lactating mice as compared to V mice. While no difference in Fos mRNA was detected in the high-density oligonucleotide arrays, we did confirm a difference using the highly sensitive Real-Time PCR technique. Specifically, Fos mRNA levels were found to be significantly higher in lactating versus V mice (Fig. 2).
Fig. 2.
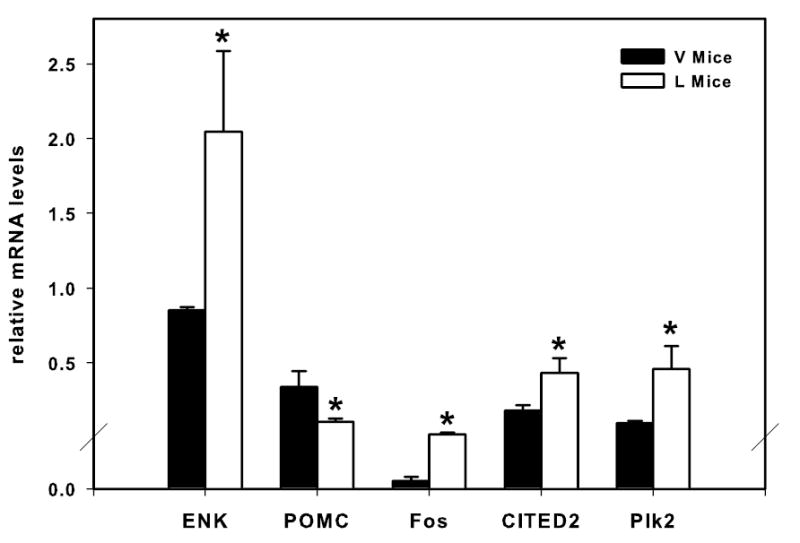
Real-time PCR analysis of enkephalin, POMC, Fos, CITED2, Plk2 expression. Confirming array results, lactation results in increased enkephalin, Fos, CITED2, and Plk2 mRNA levels and decreased POMC mRNA levels relative to virgin control mice. mRNA levels are expressed relative to the calibrator and normalized by GAPDH. * = statistical different from controls using a one-tailed Student’s t-test.
4. Discussion
This study uses high density oligonucleotide arrays to examine gene expression changes in a large area of the CNS involved in parental behaviors in V and L female rodents. Our findings concur with previous studies examining gene expression changes during lactation. These earlier studies investigated one gene at a time, typically within specific brain regions. In addition to supporting the findings of these earlier studies, our study provides a new list of candidate genes that may play critical, but previously unobserved roles in lactation. Interpretations of our results should take into account methodological considerations of how the study was conducted .
4.1 Methodological considerations and limitations
Examinations of gene expression changes with lactation using microarrays can be performed in a number of ways. For example, comparisons of lactating dams with and without pups could be performed to ascertain how pup stimulus regulates gene expression. Changes in gene expression throughout lactation could be examined to see how altering gene expression supports various altering duties of reproduction as the pups age. Additionally, comparisons of times during lactation to sets of stages of the estrus cycle could uncover the complexities and subtleties of changes in gene expression across all reproductive states. For any of these approaches, the region and amount of tissue to be used must be determined. Smaller brain sections have the advantage of demonstrating more anatomically precise and robust changes, but larger sections could reveal general trends using fewer arrays.
In this study, we chose to examine a large section of CNS that includes diverse nuclei in order to observe general trends in the changes in gene expression with lactation. This approach has two drawbacks: 1) there is dilution effect of small RNA changes as the amount of sampled tissue increases and 2) if changes in gene expression occur in opposite directions within different subregions, then changes may be missed as false negatives. Our finding of no changes in cFos in the array may be an example of the first drawback. Fos is known to be upregulated during lactation [22,32] and indeed we found Fos to be elevated in L mice when examined using real-time PCR (Fig. 2). Decreased sensitivity due to using larger CNS regions may also explain why we did not observe significant elevations of oxytocin during lactation in mice as has been documented in rats [24,41]. However, we did see a 17% increase in L mice and the elevation was close to being significant using both using SAM analysis (p = 0.085) and RMA analysis (p = 0.047; Supplemental Table 1), suggesting heightened oxytocin mRNA levels in L mice. To our knowledge, no study has carefully examined oxytocin level changes during lactation in mice, so it is also possible that the changes in mice are not as dramatic as those seen in rats; virgin mice tend to be more maternal than virgin rats, which might indicate higher baseline levels of oxytocin in virgins, generally
Because gene arrays themselves have decreased sensitivity relative to real-time PCR assays, our use of arrays on larger tissue may have had a compounding effect in decreasing the sensitivity of our assay. However, in other studies, array examination of larger brain regions has proven to be useful. The WebQTL database maintained by the GeneNetwork, www.genenetwork.org, uses array analysis of large forebrain regions as the basis for identifying how gene expression varies among 2 inbred and 36 hybrid inbred mouse strains. As described below, this database relying on large forebrain CNS tissue has already been used to make important biological insights [39].
Importantly, this study does not try to determine how differences in gene expression between L and V mice occur (e.g., hormonal versus pup stimulus). A number of factors contribute to the formation of the lactating brain: the experience of mating, pregnancy, parturition, lactation and the sensory input of pups. This study examined the results of this constellation of experiences by examining gene expression differences between V mice that had never been exposed to any of these experiences, and L mice that had been exposed to all of them.
Furthermore, this study does not discriminate between virgins at different stages of the estrus cycle. Instead, the subjects are randomly cycling virgins. In this way, only differences large enough to rise above any noise created by varying estrus states appear in the results. While this noise may obscure differences in gene expression that would show up only in mice of a given estrus state, it serves to highlight general differences in V and L mice. Our finding of elevated variance in the L versus V group when examining the top 100 genes showing differences in expression between groups (data not shown; see Supplemental Table 1 for raw results) is evidence of this kind of noise; while it may indicate that certain, subtler differences between the groups’ gene expression were missed by the array, it also strengthens our confidence in those results that were significant. V mice were either in estrus, diestrus I, diestrus II (periods of relatively consistent estradiol and progesterone levels) [10], or the morning of proestrus, so levels of estradiol and progesterone both could have ranged between 10 and 60 ng/ml [50]. These steroid ranges coincide with those found during pregnancy [27], but are higher than the low levels observed around postpartum Day 7 in mice [45]. The steroid regulation of specific gene expression changes across estrus, pregnancy, and lactation using arrays can be addressed in future studies.
Use of RMA for statistical analysis is becoming more widespread and replacing the traditional SAM approach. We used both approaches here to provide a balanced analysis, but refer the reader to Supplemental Table 1 to examine the rankings of all genes by p-value using RMA. Expression differences for additional genes (e.g. progesterone receptor, vasopressin, gonadotropin-releasing hormone) that have p values less than 0.004 (using RMA), but miss the P< 0.001 cutoff can be found in this supplemental table. Many of these differences are consistent with previous reports and could reflect important changes in gene expression that support behavioral changes.
4.2 Gene expression changes during lactation consistent with previous studies
Preproenkephalin mRNA increased 34% in our array analysis and was also confirmed by real-time PCR (Fig. 2). Significant increases of enkephalin in the hypothalamus during lactation have also been reported in rats [33,51], but see [17]. Further, removal of pups from dams significantly decreases preproenkephalin mRNA in the arcuate and median eminence [8,28,49]. The POMC gene products are downregulated during lactation [12,17,26,28], but see [4]. A decrease in melanocyte-stimulating hormone (a product of POMC that inhibits feeding) (Table 2 and Fig.2) along with the elevations in NPY seen during lactation here and in other studies [8,38], have been proposed to explain the hyperphagia that occurs during lactation [9].
4.3 Identification of novel changes in gene expression during lactation
Increases in CITED2 (found using both arrays and real-time PCR; Table 2 and Fig. 2) in L mice had not previously been reported. Because CITED2 is a transcription factor co-factor, its increased expression could explain the mechanism for alteration of expression of other genes in this study (see following section). Identified increases in Plk2 (found using both arrays and real-time PCR; Table 2 and Fig. 2) in L mice are also novel. Increased levels of Plk2 have been proposed to provide a homeostatic mechanism for global dampening of synaptic strength following heightened neuronal activity [40], so this could be one way of regulating increased neuronal activity that occurs during lactation. The finding of increases in L mice of D2 dopamine receptor, a receptor implicated in different forms of addiction [30], supports converging evidence that interactions with offspring during lactation are potently rewarding and involve activation of dopamine neurotransmission within reward pathways [14]. D2 receptor RNA is elevated in L relative to V rats within the anterior pituitary [53], but to our knowledge, this is the first study to provide evidence that the D2 receptor expression is elevated within the CNS. Increases of NPY Y2 receptor in L females has not been reported, but would be consistent with the elevation of NPY signaling during lactation; NPY Y2 is the primary NPY receptor in the brain and is involved in feeding regulation [37]. However, other roles for NPY Y2 receptor in behaviors such as stress coping and anxiety [36,47], suggest the intriguing possibility that this receptor plays multiple roles during lactation. Substance P, one of multiple products of protachykinin 1, has previously been identified as not having altered expression with lactation in rats [16], so our finding of increased tachykinin expression could reflect a species difference in peptide expression with lactation. The decrease in the glycoprotein hormone alpha chain is novel for the CNS, but is consistent with decreases reported in the pituitary [21]. Detectable levels of this gene in the CNS have previously been reported (see GeneNetwork database link above). The novel finding of decreases in L mice of the endothelin receptor b, a receptor involved in vasoconstriction [46], could provide a mechanism for the elevated levels of hemoglobin RNA we find (Table 2). We find elevated synthesis of ryanodine receptor 3 message and functionally this receptor has been linked to elevated peptide release [52] that could reflect increased peptidergic signaling in L mice. Interestingly, the finding of downregulation of syntaptotagmin, a key molecule in the calcium-induced release of small vesicles [18], implies a possible concomitant decrease in fast neurotransmitter release during lactation. The function of changes of expression of these novel genes during lactation would need to be validated using hypothesis-directed studies
4.4 Transcription factor regulation of gene expression
Because steroid hormone levels are low between Day 2 and Day 16 postpartum [45], it is unlikely that steroid activation of these receptors tonically drives gene expression changes during lactation [. Activation of steroid receptors during pregnancy can trigger gene expression changes seen during lactation, but it is reasonable to ask what other transcription factors could contribute to regulating the changes of gene expression that exist in L females. With the mapping of the mouse genome, hundreds of zinc and ring finger protein transcription factors have been identified. The ongoing production of the Allen mouse brain atlas, http://www.brain-map.org/adsearch.p.do, identifies where those factors are produced in the CNS using in situ hybridizations. The role for most of these transcription factors is largely unknown. One approach to either identify which genes a transcription factor may influence or to identify which transcription factors regulate a gene of interest, is to run correlation analysis of gene expression for different genes using gene array data sets. Genes that significantly correlate (positively or negatively) could reflect transcription level interactions. The WebQTL database, maintained by GeneNetwork, http://www.genenetwork.org/, allows researchers to perform such tests on a variety of different data sets that were produced from the rat and mouse CNS using different chips and hundreds of arrays. Interestingly, using the GeneNetwork database for mice, CITED2 was found to be highly and significantly correlated with enkephalin expression (p < 0.00000001), suggesting a possible interaction between the two. Further, the unnamed transcription factor (GeneBank ID = AI957030) that we found to be significantly elevated in L mice (Table 2), correlated significantly with piccolo (p < 0.00000001), a structural gene also found to be upregulated in L mice. The approach of using the WebQTL database as a possible tool to identify transcription factor targets has recently been validated [39]. As for any possible hypothetical links of transcription factor and target, follow-up studies are needed for verification.
4.5 Other comparisons to previous studies
In this study, prolactin receptor (short form) did not show significant changes with lactation (see Supplemental Table 1). Interestingly, recent work has also found no significant changes in RNA for the short form of this receptor within subregions of the hypothalamus with lactation in rats, but did find increases in choroids plexus with lactation [1]. For the neuropeptide, hypocretin, our finding of similar levels between L and V mice (Supplemental Table 1) is consistent with other reports that find no change in expression during lactation [5,7]. The finding of no differences in GAPDH (via either the array or real-time PCR) are consistent with this gene’s housekeeping functions [11], although in some paradigms GAPDH expression can be altered [35].
5. Conclusions
By examining gene expression profiles from the hypothalamic regions of V and postpartum Day 7 L mice, we have both confirmed previous gene expression changes and established a new list of candidate genes whose changes in expression may support maternal behaviors. This study is limited by the use of larger section of CNS such that some changes in gene expression were missed due to either dilution of signal or differing directions of gene expression changes in different parts of the sampled tissue. Further, the study provides a single snapshot of expression differences between L and V mice, and cannot distinguish whether hormonal or sensory input differences are driving the differences. Despite these caveats, the results from this study describe broad differences between L and V mice that can be subsequently examined and tested using hypothesis-directed experiments.
Supplementary Material
Acknowledgments
This work was supported by National Institutes of Health Grant R01MH066086 to S.C.G., MH002035 to A.P.A., and AG05784 to A.M.B. The authors wish to thank Alejandro Negron for technical assistance and Kate Skogen and Jeff Alexander for animal care. The hybridizations were conducted in the GeneChip facility at Iowa State University which is supported by the Office of Biotechnology.
Footnotes
Theme: Neural basis of behavior
Topic: Hormonal control of reproductive behavior
References
- 1.Augustine RA, Kokay IC, Andrews ZB, Ladyman SR, Grattan DR. Quantitation of prolactin receptor mRNA in the maternal rat brain during pregnancy and lactation. J Mol Endocrinol. 2003;31:221–32. doi: 10.1677/jme.0.0310221. [DOI] [PubMed] [Google Scholar]
- 2.Bartolomucci A, Palanza P, Sacerdote P, Ceresini G, Chirieleison A, Panerai AE, Parmigiani S. Individual housing induces altered immuno-endocrine responses to psychological stress in male mice. Psychoneuroendocrinology. 2003;28:540–58. doi: 10.1016/s0306-4530(02)00039-2. [DOI] [PubMed] [Google Scholar]
- 3.R.S. Bridges, Biochemical basis of parental behavior in the rat. In J.S. Rosenblatt and C.T. Snowden (Eds.), Parental care: evolution, mechanisms, and adaptive significance, Academic Press, San Diego, 1996, pp. 215–237.
- 4.Broad KD, Kendrick KM, Sirinathsinghji DJ, Keverne EB. Changes in pro-opiomelanocortin and pre-proenkephalin mRNA levels in the ovine brain during pregnancy, parturition and lactation and in response to oestrogen and progesterone. J Neuroendocrinol. 1993;5:711–9. doi: 10.1111/j.1365-2826.1993.tb00544.x. [DOI] [PubMed] [Google Scholar]
- 5.Brogan RS, Grove KL, Smith MS. Differential regulation of leptin receptor but not orexin in the hypothalamus of the lactating rat. J Neuroendocrinol. 2000;12:1077–86. doi: 10.1046/j.1365-2826.2000.00559.x. [DOI] [PubMed] [Google Scholar]
- 6.Brown KJ, Grunberg NE. Effects of housing on male and female rats: crowding stresses male but calm females. Physiol Behav. 1995;58:1085–9. doi: 10.1016/0031-9384(95)02043-8. [DOI] [PubMed] [Google Scholar]
- 7.Cai XJ, Denis R, Vernon RG, Clapham JC, Wilson S, Arch JR, Williams G. Food restriction selectively increases hypothalamic orexin-B levels in lactating rats. Regul Pept. 2001;97:163–8. doi: 10.1016/s0167-0115(00)00209-3. [DOI] [PubMed] [Google Scholar]
- 8.Ciofi P, Crowley WR, Pillez A, Schmued LL, Tramu G, Mazzuca M. Plasticity in expression of immunoreactivity for neuropeptide Y, enkephalins and neurotensin in the hypothalamic tubero-infundibular dopaminergic system during lactation in mice. J Neuroendocrinol. 1993;5:599–602. doi: 10.1111/j.1365-2826.1993.tb00528.x. [DOI] [PubMed] [Google Scholar]
- 9.Crowley WR, Ramoz G, Hurst B. Evidence for involvement of neuropeptide Y and melanocortin systems in the hyperphagia of lactation in rats. Pharmacol Biochem Behav. 2003;74:417–24. doi: 10.1016/s0091-3057(02)01006-7. [DOI] [PubMed] [Google Scholar]
- 10.W.F. Ganong, Review of Medical Physiology, 18th edn., Appleton & Lange, Norwalk, CT, 1995.
- 11.Gutala RV, Reddy PH. The use of real-time PCR analysis in a gene expression study of Alzheimer's disease post-mortem brains. Journal of Neuroscience Methods. 2004;132:101–7. doi: 10.1016/j.jneumeth.2003.09.005. [DOI] [PubMed] [Google Scholar]
- 12.Hammer RP, Jr, Bridges RS. Preoptic area opioids and opiate receptors increase during pregnancy and decrease during lactation. Brain Res. 1987;420:48–56. doi: 10.1016/0006-8993(87)90238-1. [DOI] [PubMed] [Google Scholar]
- 13.Han ES, Wu YM, McCarter R, Nelson JF, Richardson A, Hilsenbeck SG. Reproducibility, sources of variability, pooling, and sample size: Important considerations for the design of high-density oligonucleotide array experiments. J Gerontol a-Biol. 2004;59:306–315. doi: 10.1093/gerona/59.4.b306. [DOI] [PubMed] [Google Scholar]
- 14.Insel TR. Is social attachment an addictive disorder? Physiol Behav. 2003;79:351–7. doi: 10.1016/s0031-9384(03)00148-3. [DOI] [PubMed] [Google Scholar]
- 15.Irizarry RA, Hobbs B, Collin F, Beazer-Barclay YD, Antonellis KJ, Scherf U, Speed TP. Exploration, normalization, and summaries of high density oligonucleotide array probe level data. Biostatistics. 2003;4:249–264. doi: 10.1093/biostatistics/4.2.249. [DOI] [PubMed] [Google Scholar]
- 16.Jakubowska-Naziemblo B, Antonowicz U, Cannon D, Powell D, Rohde W. Immunoreactive substance P and LH-RH content in median eminence and pituitary gland during proestrus, oestrus, lactation and after anterior hypothalamic deafferentation. Experimental & Clinical Endocrinology. 1985;85:155–66. doi: 10.1055/s-0029-1210431. [DOI] [PubMed] [Google Scholar]
- 17.Kim EM, Kotz CM, Welch CC, Grace MK, Billington CJ, Levine AS. Lactation decreases mRNA levels of opioid peptides in the arcuate nucleus of the rat. Brain Res. 1997;769:303–8. doi: 10.1016/s0006-8993(97)00722-1. [DOI] [PubMed] [Google Scholar]
- 18.Koh TW, Bellen HJ, Synaptotagmin I. a Ca2+ sensor for neurotransmitter release. Trends Neurosci. 2003;26:413–22. doi: 10.1016/S0166-2236(03)00195-4. [DOI] [PubMed] [Google Scholar]
- 19.Lamote I, Meyer E, Massart-Leen AM, Burvenich C. Sex steroids and growth factors in the regulation of mammary gland proliferation, differentiation, and involution. Steroids. 2004;69:145–159. doi: 10.1016/j.steroids.2003.12.008. [DOI] [PubMed] [Google Scholar]
- 20.Lee CK, Weindruch R, Prolla TA. Gene expression profile of the ageing brain in mice. Nat Genet. 2000;25:294–7. doi: 10.1038/77046. [DOI] [PubMed] [Google Scholar]
- 21.Lee LR, Haisenleder DJ, Marshall JC, Smith MS. Expression of alpha-subunit and luteinizing hormone (LH) beta messenger ribonucleic acid in the rat during lactation and after pup removal: relationship to pituitary gonadotropin-releasing hormone receptors and pulsatile LH secretion. Endocrinology. 1989;124:776–82. doi: 10.1210/endo-124-2-776. [DOI] [PubMed] [Google Scholar]
- 22.Lin SH, Miyata S, Matsunaga W, Kawarabayashi T, Nakashima T, Kiyohara T. Metabolic mapping of the brain in pregnant, parturient and lactating rats using fos immunohistochemistry. Brain Res. 1998;787:226–36. doi: 10.1016/s0006-8993(97)01484-4. [DOI] [PubMed] [Google Scholar]
- 23.Livak KJ, Schmittgen TD. Analysis of relative gene expression data using real-time quantitative PCR and the 2(-Delta Delta C(T)) Method. Methods. 2001;25:402–8. doi: 10.1006/meth.2001.1262. [DOI] [PubMed] [Google Scholar]
- 24.Luckman SM, Larsen PJ. Evidence for the involvement of histaminergic neurones in the regulation of the rat oxytocinergic system during pregnancy and parturition. J Physiol (Lond) 1997;501:649–55. doi: 10.1111/j.1469-7793.1997.649bm.x. [DOI] [PMC free article] [PubMed] [Google Scholar]
- 25.Mann MA, Konen C, Svare B. The role of progesterone in pregnancy-induced aggression in mice. Horm Behav. 1984;18:140–60. doi: 10.1016/0018-506x(84)90039-4. [DOI] [PubMed] [Google Scholar]
- 26.Mann PE, Rubin BS, Bridges RS. Differential proopiomelanocortin gene expression in the medial basal hypothalamus of rats during pregnancy and lactation. Brain Res Mol Brain Res. 1997;46:9–16. doi: 10.1016/s0169-328x(96)00267-7. [DOI] [PubMed] [Google Scholar]
- 27.Miller BH, Olson SL, Turek FW, Levine JE, Horton TH, Takahashi JS. Circadian Clock mutation disrupts estrous cyclicity and maintenance of pregnancy. Curr Biol. 2004;14:1367–1373. doi: 10.1016/j.cub.2004.07.055. [DOI] [PMC free article] [PubMed] [Google Scholar]
- 28.Nahi F, Arbogast LA. Prolactin modulates hypothalamic preproenkephalin, but not proopiomelanocortin, gene expression during lactation. Endocrine. 2003;20:115–22. doi: 10.1385/ENDO:20:1-2:115. [DOI] [PubMed] [Google Scholar]
- 29.Neville MC, Morton J, Umemura S. Lactogenesis. The transition from pregnancy to lactation. Pediatr Clin North Am. 2001;48:35–52. doi: 10.1016/s0031-3955(05)70284-4. [DOI] [PubMed] [Google Scholar]
- 30.Noble EP. Addiction and its reward process through polymorphisms of the D2 dopamine receptor gene: a review. Eur Psychiatry: J Ass Eur Psychiatry. 2000;15:79–89. doi: 10.1016/s0924-9338(00)00208-x. [DOI] [PubMed] [Google Scholar]
- 31.M. Numan, T.R. Insel, The neurobiology of parental behavior, Springer, New York, 2003, ix, 418 pp.
- 32.Numan M, Numan MJ, Marzella SR, Palumbo A. Expression of c-fos, fos B, and egr-1 in the medial preoptic area and bed nucleus of the stria terminalis during maternal behavior in rats. Brain Res. 1998;792:348–52. doi: 10.1016/s0006-8993(98)00257-1. [DOI] [PubMed] [Google Scholar]
- 33.Ottinger MA, Rosewell KL, Weiland NG, Margaretten KT, Wise PM. Effect of lactation on hypothalamic preproenkephalin gene expression. J Neuroendocrinol. 1995;7:341–6. doi: 10.1111/j.1365-2826.1995.tb00767.x. [DOI] [PubMed] [Google Scholar]
- 34.G. Paxinos, K.B.J. Franklin, The mouse brain in stereotaxic coordinates. Academic Press, San Diego, 2001.
- 35.Perrot-Sinal TS, Davis AM, McCarthy MM. Developmental sex differences in glutamic acid decarboxylase (GAD(65)) and the housekeeping gene, GAPDH. Brain Res. 2001;922:201–8. doi: 10.1016/s0006-8993(01)03167-5. [DOI] [PubMed] [Google Scholar]
- 36.Redrobe JP, Dumont Y, Herzog H, Quirion R. Neuropeptide Y (NPY) Y2 receptors mediate behaviour in two animal models of anxiety: evidence from Y2 receptor knockout mice. Behav Brain Res. 2003;141:251–5. doi: 10.1016/s0166-4328(02)00374-1. [DOI] [PubMed] [Google Scholar]
- 37.Sainsbury A, Schwarzer C, Couzens M, Fetissov S, Furtinger S, Jenkins A, Cox HM, Sperk G, Hokfelt T, Herzog H. Important role of hypothalamic Y2 receptors in body weight regulation revealed in conditional knockout mice. Proc Natl Acad Sci U S A. 2002;99:8938–43. doi: 10.1073/pnas.132043299. [DOI] [PMC free article] [PubMed] [Google Scholar]
- 38.Sands SA, Le Mon D, Chronwall BM. Lactation and salt loading similarly alter neuropeptide Y, but differentially alter somatostatin, in separate sets of rat neural lobe axons. Peptides. 1997;18:1045–50. doi: 10.1016/s0196-9781(97)00045-4. [DOI] [PubMed] [Google Scholar]
- 39.R.E. Scott, E. White-Grindley, H.E. Ruley, E.J. Chesler, R.W. Williams, P2P-R expression is genetically coregulated with components of the translation machinery and with PUM2, a translational repressor that associates with the P2P-R mRNA, J. Cell. Physiol. (2005) (in press). [DOI] [PubMed]
- 40.Seeburg DP, Pak D, Sheng M. Polo-like kinases in the nervous system. Oncogene. 2005;24:292–8. doi: 10.1038/sj.onc.1208277. [DOI] [PubMed] [Google Scholar]
- 41.Spinolo LH, Crowley WR. Neurochemical regulation of hypothalamic oxytocin messenger ribonucleic acid levels during early lactation in rats. Endocrinology. 1993;132:2631–8. doi: 10.1210/endo.132.6.8504764. [DOI] [PubMed] [Google Scholar]
- 42.Stern JE, Armstrong WE. Changes in the electrical properties of supraoptic nucleus oxytocin and vasopressin neurons during lactation. J Neurosci. 1996;16:4861–71. doi: 10.1523/JNEUROSCI.16-16-04861.1996. [DOI] [PMC free article] [PubMed] [Google Scholar]
- 43.Stern JE, Armstrong WE. Reorganization of the dendritic trees of oxytocin and vasopressin neurons of the rat supraoptic nucleus during lactation. J Neurosci. 1998;18:841–53. doi: 10.1523/JNEUROSCI.18-03-00841.1998. [DOI] [PMC free article] [PubMed] [Google Scholar]
- 44.Stern JM, McDonald C. Ovarian hormone-induced short-latency maternal behavior in ovariectomized virgin Long-Evans rats. Horm Behav. 1989;23:157–72. doi: 10.1016/0018-506x(89)90057-3. [DOI] [PubMed] [Google Scholar]
- 45.B. Svare, Maternal aggression: hormonal, genetic, and developmental determinants. In N.A. Krasnegor and R.S. Bridges (Eds.), Mammalian parenting : biochemical, neurobiological, and behavioral determinants, Oxford University Press, New York, 1990, pp. 118–132.
- 46.Touyz RM, Schiffrin EL. Role of endothelin in human hypertension. Can J Physiol Pharmacol. 2003;81:533–41. doi: 10.1139/y03-009. [DOI] [PubMed] [Google Scholar]
- 47.Tschenett A, Singewald N, Carli M, Balducci C, Salchner P, Vezzani A, Herzog H, Sperk G. Reduced anxiety and improved stress coping ability in mice lacking NPY-Y2 receptors. Eur J Neurosci. 2003;18:143–8. doi: 10.1046/j.1460-9568.2003.02725.x. [DOI] [PubMed] [Google Scholar]
- 48.Tusher VG, Tibshirani R, Chu G. Significance analysis of microarrays applied to the ionizing radiation response. Proc Natl Acad Sci U S A. 2001;98:5116–21. doi: 10.1073/pnas.091062498. [DOI] [PMC free article] [PubMed] [Google Scholar]
- 49.Vandenbulcke F, Ciofi P, Beauvillain JC. Concomitant variation in immunoreactivity for enkephalins and neutral endopeptidase in the median eminence of the lactating rat. Neurosci Lett. 1994;175:53–7. doi: 10.1016/0304-3940(94)91076-6. [DOI] [PubMed] [Google Scholar]
- 50.Walmer DK, Wrona MA, Hughes CL, Nelson KG. Lactoferrin expression in the mouse reproductive tract during the natural estrous cycle: correlation with circulating estradiol and progesterone. Endocrinology. 1992;131:1458–66. doi: 10.1210/endo.131.3.1505477. [DOI] [PubMed] [Google Scholar]
- 51.White JD, Gall CM, McKelvy JF. Enkephalin biosynthesis and enkephalin gene expression are increased in hippocampal mossy fibers following a unilateral lesion of the hilus. J Neurosci. 1987;7:753–9. doi: 10.1523/JNEUROSCI.07-03-00753.1987. [DOI] [PMC free article] [PubMed] [Google Scholar]
- 52.Yamamori E, Iwasaki Y, Oki Y, Yoshida M, Asai M, Kambayashii M, Oiso Y, Nakashima N. Possible involvement of ryanodine receptor-mediated intracellular calcium release in the effect of corticotropin-releasing factor on adrenocorticotropin secretion. Endocrinology. 2004;145:36–8. doi: 10.1210/en.2003-1222. [DOI] [PubMed] [Google Scholar]
- 53.Zabavnik J, Wu WX, Eidne KA, McNeilly AS. Dopamine D2 receptor mRNA in the pituitary during the oestrous cycle, pregnancy and lactation in the rat. Mol Cell Endocrinol. 1993;95:121–8. doi: 10.1016/0303-7207(93)90037-k. [DOI] [PubMed] [Google Scholar]
Associated Data
This section collects any data citations, data availability statements, or supplementary materials included in this article.