Abstract
Since the discovery of the inner core in 1936, no additional spherical subshell of the Earth has been observed. Based on an extensive seismic data set, we propose the existence of an innermost inner core, with a radius of ∼300 km, that exhibits a distinct transverse isotropy relative to the bulk inner core. Specifically, within the innermost inner core, the slowest direction of wave propagation is ∼45° from the east-west direction. In contrast, the direction of the slowest wave propagation in the overlying inner core is east-west. The distinct anisotropy at the center of the Earth may represent fossil evidence of a unique early history of inner-core evolution.
The solid inner core of the Earth constitutes less than 1% of the Earth's volume; nonetheless, this tiny sphere has played and continues to play an important role in the evolution of our planet. Growth of the inner core provides a source of thermal and compositional buoyancy for powering the geodynamo (1–3), and the region acts to stabilize the magnetic field (4, 5). However, the inner core remains a poorly understood region of the Earth, because most seismic waves do not sample it and the extreme pressures and temperatures are not reproduced easily in the laboratory.
The existence of the inner core was first inferred by Inge Lehmann (6) when she discovered a discontinuity in the compressional wave speed within the core (this discontinuity defines the boundary between outer and inner core). The discovery of athe inner core led to studies of this deepest region of the Earth: solidity was proposed by Birch (7) and firmly established by Dziewoński and Gilbert (8). Furthermore, anomalous splitting of inner core-sensitive normal modes (9), and evidence for directional dependence of wave propagation (10) were observed in the early 1980s. In 1986, Morelli et al. (using travel times) (11) and Woodhouse et al. (using normal modes) (12) proposed that the inner core is anisotropic (transversely isotropic) with the axis of symmetry parallel to the axis of rotation, i.e., waves traveling parallel to the equatorial plane are slower than waves traveling perpendicular to it.
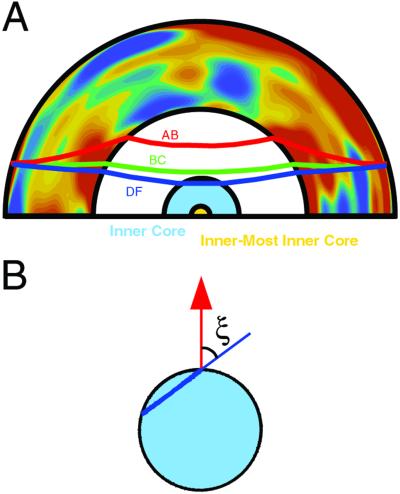
There are two types of seismic data (normal-mode and body-wave data) available for investigation of the inner-core properties. Difficulties in body-wave modeling arise from incomplete sampling of the inner core and the fact that a ray that reaches the inner core must travel through the laterally heterogeneous mantle (Fig. 1). Analyzing data from the Bulletins of the International Seismological Centre, Su and Dziewoński (14) found that the best fit of the axis of symmetry for transversely isotropic inner core requires ∼10° tilt with respect to the axis of rotation. Subsequent analysis suggests that this inference was driven by a highly anomalous subset of data representing paths from earthquakes in South Sandwich Islands to Alaska (15). The origin of this anomaly is still not determined, but if this data subset is excluded, there is no evidence for a significant difference between the alignments of the symmetry and rotation axes. This example of an erroneous conclusion shows that one must consider the spatial scales of the travel-time anomalies, without automatically attributing them to global properties. Several different complexities have been proposed in the properties of the inner core near the inner-core boundary (16–18), but they are also likely to be associated with anomalous data subsets (19).
Fig 1.
Geometry of ray paths for PKP branch. (A) Ray paths for PKPAB (red curve), PKPBC (green curve), and PKPDF or PKIKP (blue curve) at an epicentral distance of 150°. PKPBC (BC for brevity) and PKPAB (AB) turn in the lower and upper outer core, respectively, and do not sample the inner core. Travel times of PKPDF (DF) are referred to as “absolute travel times” in contrast to “differential travel times,” which are obtained by subtracting DF travel times from BC (BC − DF) or AB (AB − DF) travel times. Differential travel times are often used in inner-core studies because similarity of the BC or AB path with DF path within the mantle reduces undesirable mantle and earthquake effects from the data. Mantle heterogeneity based on a shear-velocity model of Gu et al. (13) is plotted. Red colors indicate slower than average velocity, and blue colors indicate faster than average velocity. The cross section is made along a great circle between Africa and the southwestern Pacific (crossing under Eurasia). (B) Geometry of the DF ray in the inner core (pale-blue circle), where ξ is the angle of the ray with respect to the symmetry axis (shown in red). At high values of cos2ξ, the ray is traveling parallel to the symmetry axis, and when cos2ξ is small, the ray is traveling perpendicular to the symmetry axis.
The initial models of inner-core anisotropy were simple: transverse isotropy (hexagonal symmetry) with the symmetry axis parallel to the Earth's rotation axis. Anisotropic parameters were either constant or varied as a function of radius. Although the presence of anisotropy in the inner core is generally accepted, investigations of inner-core anisotropy subsequent to Morelli et al. (11) and Woodhouse et al. (12) resulted in a wide range of views regarding strength as well as lateral and radial variations. In particular, there has been a major discrepancy between models based on normal-mode and body-wave data (e.g., refs. 20 and 21). Ishii et al. (22) derived a simple model of inner-core anisotropy, ICAS02, which fits normal-mode, absolute travel-time, and differential travel-time data. This model is characterized by a relatively weak anisotropy (peak-to-peak velocity variation of 0.2 km/s) with no radial dependence. The fit to travel-time data using this simple model is good (22) except in the distance between 173° and 180°, corresponding to the bottoming radius from 0 to 300 km. We propose here that this misfit requires the introduction of distinct anisotropic behavior at the center of the Earth. We call this anomalous region the innermost inner core (IMIC). It is essential, of course, to demonstrate that our inference is not biased by local anomalies or small subsets of anomalous data.
Theory
For homogeneous transversely isotropic material, perturbations in velocity (δv) depend on cos2ξ (see ref. 22) as
 |
where ξ is the angle between the ray and the axis of symmetry (Fig. 1B), v0 is the average compressional wave velocity in the inner core, and parameters A and B describe the anisotropic nature of the material (i.e., they are related to the elements of the elastic tensor). This form is suitable for displaying anisotropic behavior because travel times can be plotted as a function of cos2ξ (Fig. 2). Eq. 1 can be written in a variety of forms based on trigonometric relationships, but a physically appealing expression is
 |
because it is analogous to the equation for azimuthal anisotropy. In addition, the parameters A′ and B′ have simpler relationships to the elements of the elastic tensor. Perturbations in velocity are related to travel-time anomalies (δt) through a relationship
 |
where integration is over the ray path s, and v is the velocity of the reference isotropic Earth model (23).
Fig 2.
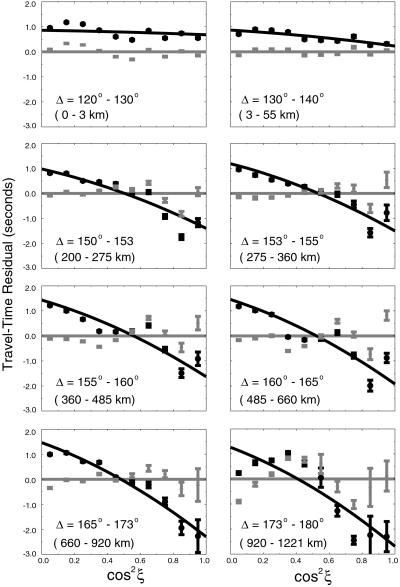
Fit to DF data at various distance ranges. Observed DF travel-time data (black circles with error bars) and residual DF data after correcting for a constant anisotropy model (gray circles with error bars) for various distance ranges. The values shown below the epicentral distance range correspond to the bottoming depth of the data below the inner-core boundary. Prediction based on the bulk inner-core anisotropy model (22) is shown as a black curve, and the zero line is shown in gray. The standard deviation of the mean is shown as the uncertainty of each averaged datum point.
Data
Constraints on the anisotropy within the IMIC primarily involve absolute travel-time data of the DF branch (see Fig. 1). The sensitivity of normal-mode data to the deepest 300 km of the core is close to zero for most modes, because the eigenfunctions vanish at the center of the Earth. BC − DF differential travel times are available between the epicentral distance range of 145° and 156°, and hence they only provide information on the shallow (upper 350-km) portion of the inner core. In contrast, AB − DF data are available in distance ranges up to 180°; however, the paths between AB and DF within the mantle are considerably different, resulting in substantial signals from mantle structure (19, 24–26). Hence AB − DF data cannot provide reliable constraints on the inner core, especially at large epicentral distances.
We use absolute travel-time data collected by the International Seismological Centre between 1964 and 1994. The data are corrected for the Earth's ellipticity (27), effects due to the crust, and mantle contributions based on a P-velocity model MK12/WM13 (28). The earthquakes in the data set are then relocated by using mantle models and arrival times of the P, S, PKPAB, PKPBC, and PKPDF phases. There are ∼325,000 DF measurements that are averaged according to the ray angle ξ (Fig. 1B) and eight different ranges of epicentral distance. The procedures used here were first described by Su and Dziewoński (14) and used, with small variations, by Ishii et al. (22). Fig. 2 shows the result of these procedures, i.e., average DF residuals as a function of cos2ξ for eight distance ranges (bottoming depths) and the residuals corrected for the anisotropy of model ICAS02. Despite the possibility of substantial reading errors and source-receiver bias, this data set is remarkably consistent with high-quality differential travel-time data when some anomalous paths are removed (19).
In the first seven panels (between 120° and 173° distance ranges), the data are almost linearly dependent on cos2ξ, and the residuals follow the zero line closely, with small deviations. However, the deviations are significant (±1 s) for the last distance range and have a well developed parabolic shape; the slowest arrivals (maximum travel-time residual) correspond to intermediate values of cos2ξ. The smooth behavior of these residuals implies that they could be well fit as a quadratic in cos2ξ and thus be consistent with transverse isotropy. The anomalous behavior of data from the 173°–180° distance range cannot be explained by structure within the mantle, outer core, or the shallow inner core, because data up to 173° are well explained by the constant model of anisotropy. Furthermore, there are more than 3,000 individual readings from the 173°–180° distance range: two or three times more than all differential travel-time data reported thus far for all the phases at all distances. The anomalous behavior of the data at nearly antipodal distances has been observed previously. Indeed, the earliest study of inner-core anisotropy (11) showed large positive travel-time residuals at ∼45° latitude (figure 1 of ref. 11). In addition, Su and Dziewoński (14) inferred stronger anisotropy in the central inner core in their four-shell models of anisotropy. We demonstrate here, on the basis of a detailed analysis of more extensive database of travel times, that the parabolic behavior in travel-time data is a robust feature, and that anisotropy within the IMIC is not only stronger than in the shallower part but that it has a different slow direction.
Tests of the Robustness
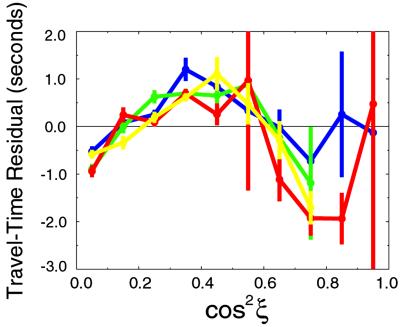
To begin, we investigate whether biased sampling, or a small set of anomalous ray paths, may be corrupting travel-time data within the epicentral distance range relevant to IMIC studies. Following geometrical considerations described in Ishii et al. (19), the data are grouped into four subsets according to their bottoming points: whether they bottom in the polar or equatorial latitudes and in the eastern or western hemispheres. This procedure effectively identifies anomalous but heavily weighted data that may be associated with small-scale structure within the mantle or the inner core. For example, at the distance range of 150°–153°, the South Sandwich Islands to Alaska anomalies cause the western equatorial-data subset to diverge significantly from other subsets at cos2ξ between 0.7 and 0.9 (19). Fig. 3 shows the four subsets of data as a function of cos2ξ for the distance range from 173° to 180°. The consistency of the independent data sets implies that the anomalous parabolic dependence of travel times on cos2ξ is robust and unlikely to be due to either biased sampling or contamination from a small number of anomalous data.
Fig 3.
Independent subsets of data from 173° to 180° distance range. Comparison of four subsets of DF data in the distance range between 173° and 180° after the removal of signal due to inner-core anisotropy in the top 920 km. Red and yellow dots with error bars are data in the western hemisphere with |latitude| < 30° and |latitude| ≥ 30°, respectively, and those in blue and green correspond to two latitude bins in the eastern hemisphere. Here, latitude refers to the ray's bottoming latitude. There are only a handful of data with cos2ξ > 0.8.
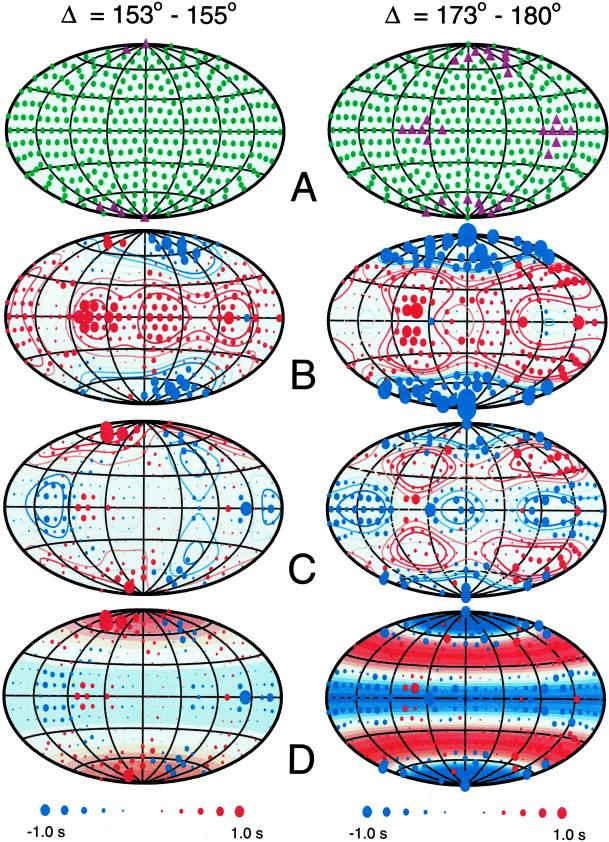
For a transversely isotropic medium, the local velocity depends only on the angle ξ of the ray with respect to the symmetry axis. If the IMIC is transversely isotropic, and if there are no significant regional variations, then the function δt(ξ, λ), where λ is the bottoming longitude, should be zonal (i.e., with no longitudinal dependence) in the λ–ξ space. Fig. 4 shows δt(ξ, λ); this plot is similar to Fig. 2 except that an additional dimension (bottoming longitude λ) is introduced and that ξ is used rather than cos2ξ. Using triangular tessellation (29), we divide the surface of a sphere into 362 nearly equal-area triangles, the vertices of which are used as the center of the 10° cap (Fig. 4). The advantage of the triangular tessellation over a commonly used rectangular one is that the nodes are nearly equidistant. On the other hand, the nodes in the northern and southern hemispheres are not a mirror image of one another, forcing signal to appear nonsymmetric across the equator. There is slight smoothing as the 10° caps overlap; nevertheless, this procedure preserves wavelengths up to a spherical harmonic of degree 9. We are primarily interested in the zonal harmonics of degrees 2 and 4 (linear and quadratic dependence of δt on cos2ξ, respectively), and thus this smoothing should not affect our conclusions.
Fig 4.
Comparison of DF data from 153° to 155° and 173° to 180°. Plot of DF data binned into 362 caps for the distance ranges 153°–155° (Left) and 173°–180° (Right). Colatitude and longitude in these maps correspond to ray angle ξ and bottoming longitude, respectively. Contours (four red and four blue curves) and background color (eight red and eight blue colors) have constant extreme values (±1 s). (A) Locations of cap centers where those with more than three measurements are shown in green circles and those with less than three measurements are shown in purple triangles. (B) Raw DF travel-time data binned according to their bottoming longitude and ray angle ξ. Spherical harmonic expansion up to and including degree 4 is shown by contours. (C and D) DF data after the removal of anisotropy in the upper 920 km of the inner core. In C, the binned data are shown with contours of spherical harmonic expansion up to degree 4, and in D, the same data are shown with background color obtained only with zonal terms at degrees 2 and 4. A strong degree-4 zonal pattern (east-west banded pattern with five regions) is clear for the near-antipodal distance range, whereas the 153–155° distance range contains small residuals with a weak zonal pattern at degree 2 (bands with three regions).
This procedure implies that when a ray is traveling parallel to the equatorial plane (at any latitude), the datum is binned into caps at the equator, and when it is perpendicular to the equatorial plane, the datum is included in caps at the poles. Consequently, latitudinal variations in the data with given values of ξ and λ are averaged for a given cap location. We call this averaging scheme “latitudinal stacking”. The resulting two-dimensional map shows the travel-time dependence on ray angle (plotted as colatitude) and bottoming longitude. The strength of the zonal pattern at degree 2 in such a map corresponds to the strength of a linear dependence of the data on cos2ξ, and the strength of the zonal pattern at degree 4 corresponds to the strength of a quadratic dependence of the data on cos2ξ. Latitudinal stacking could be useful, for example, in examining the hemispheric variations in the strength of anisotropy (16, 18), because the patterns of residuals should show strong longitudinal dependence.
For both the 153°–155° and 173°–180° distance ranges, data coverage is good (Fig. 4A) although each cap is required to have at least three measurements. It should be remembered that there is no simple correspondence between the location of source or receiver at the surface and ray-bottoming coordinates. Thus, although there are regions of the Earth poorly covered by sources (much of the Pacific, for instance), the ray-bottoming points have a much better distribution; mantle P-wave tomography is an instructive example (e.g., figure 8 of ref. 30). Binning the raw data results in a clear zonal pattern both in 153°–155° and 173°–180° (Fig. 4B). However, when effects due to anisotropy in the upper 920 km of the inner core are removed from the data, residuals from the two distance ranges show clear differences. As could be expected from Fig. 2, residuals in the 173°–180° distance range exhibit a strong degree-4 zonal pattern, whereas those in the 153°–155° are almost zero with a weak degree-2 signal (Fig. 4 C and D). Note that for the latter range, the effect of the anomalous South Sandwich Islands to Alaska paths is confined to a few points at nearly polar ξ and that there is no significant longitudinal variation at hemispheric scales. The distinctive zonal pattern at degree 4 for data from the 173° to 180° distance range (Fig. 4 C and D) is an unambiguous indication that the peculiar anisotropic behavior is characteristic of the IMIC.
Results and Discussion
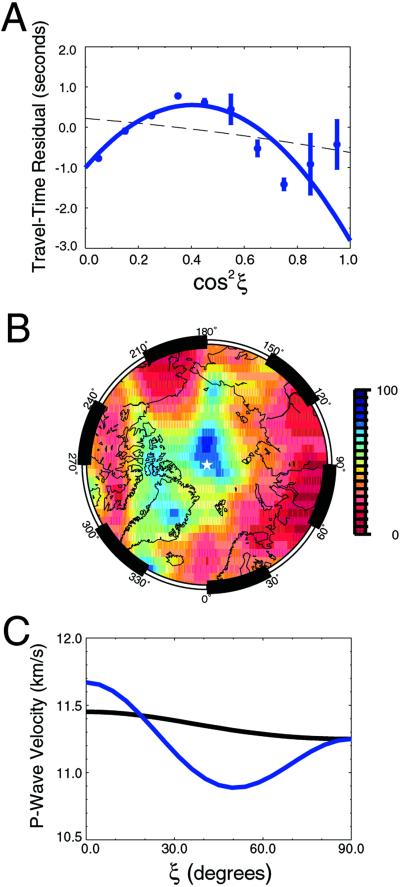
Inverting residual DF data for the constants in Eq. 1 or 2 results in almost purely parabolic dependence of travel times on cos2ξ (Fig. 5A). The improvement in the variance reduction obtained with this model (87% for the averaged data as shown in Fig. 5A) is substantial compared with the prediction based on a simple model of the bulk inner core (−15%) despite the small number of additional unknowns. The variance reduction can be further improved to 90% level if the axis of symmetry is tilted from the rotation axis. This tilt is not well constrained, partly because of a limitation in data availability from polar paths (Fig. 5B). However, travel-time residuals remain parabolic regardless of the axis location, indicating that tilt of the axis of symmetry is not the cause of parabolic dependence of travel times on cos2ξ. Inversions with varying orientation of the symmetry axis result in models with a maximum velocity difference of 0.8 km/s between the fastest and slowest directions, with the lowest velocity at ξ∼45° (Fig. 5C).
Fig 5.
Data from the IMIC. DF data in the distance range between 173° and 180° after the removal of signal due to inner-core anisotropy in the top 920 km. (A) Averaged data (blue dots with error bars) with a prediction (blue solid curve) that assumes that the symmetry axis is aligned with the rotation axis. The prediction based on an anisotropy model of the bulk inner core (22) is shown by the dashed curve. (B) Grid-search result for best-fitting symmetry axis location showing the variance reduction as a function of the symmetry axis location. The center of this map is the North Pole (white star). Note that the color scale is not linear but is characterized by a small increment at high values to emphasize change as a function of axis location. (C) Velocity variation as a function of ξ for a bulk inner-core model (black curve) and the IMIC model (blue curve).
Theoretical calculations of the elastic parameters of iron, the main constituent of the Earth's core, predict a velocity minimum at ∼50° from the direction of the highest velocity (31). Experimental results at high pressures also indicate that the lowest velocity occurs at ∼45° (32). Although these two results do not agree in the direction of fast velocity, our observations are consistent with either result given a mechanism for aligning the fast axis with the axis of rotation. In addition, in both of these studies, iron is found to be highly anisotropic with a velocity difference of 2 ∼ 2.5 km/s, suggesting that only a fraction of crystal alignment is required to generate the anisotropic signal observed for the IMIC. A linear dependence of travel times on cos2ξ in the shallower part of the inner core may be due to impurities associated with the freezing process at later (more recent) times.
The existence of an anisotropically distinct IMIC from the bulk inner core has significant consequences. The behavior may represent fossil evidence of two episodes of inner core development, presumably related to changes in core environment. For example, an inner core of a few hundred-kilometer radius may have formed rapidly when the Earth differentiated or with a different chemical composition. Also, because the inner core affects the pattern of convection in the outer core, the prevailing pattern of the flow might have changed after the radius of the inner core exceeded ∼300 km. Furthermore, if the IMIC is a preserved region of the early Earth, it restricts later development of anisotropy to mechanisms acting close to the boundary between the inner and outer core. Those involving the entire inner core, such as degree-one convection (33, 34), would preclude a distinct IMIC anisotropy. Alternatively, the change in anisotropic behavior between the bulk and innermost inner core may represent an additional phase change in iron.
The boundary between the IMIC and the bulk inner core at 300-km radius is somewhat artificial, since the sharpness of the transition cannot be well constrained from our data. Data such as a triplication in the travel-time curve and associated amplitude anomalies are required for resolving the boundary between the bulk inner core and the IMIC. To obtain such data, one needs to deploy densely spaced linear arrays in the 15° range of antipodal distance from a relatively active source region. Thus, with improved global coverage of seismometer and projects such as the USArray with its “flexible” component, or even a 1-year deployment of broad-band seismographs below the ocean bottom, it might be possible to conduct a more detailed survey of the distinct anisotropy that characterizes the very center of the Earth.
Acknowledgments
We thank W.-J. Su for International Seismological Centre data processing and providing plotting software; B. Romanowicz, W. F. McDonough, H.-k. Mao, R. J. O'Connell, M. Nettles, and G. Ekström for discussions and suggestions; and J. Ritsema and J. X. Mitrovica for suggestions that improved the manuscript. This research was supported in part by National Science Foundation Grant EAR02-30625. M.I. was also supported by a Julie Payette Research Scholarship from the Natural Sciences and Engineering Research Council of Canada.
Abbreviations
IMIC, innermost inner core
See commentary on page 13966.
References
- 1.Braginski S. I. (1963) Dokl. Akad. Nauk 149, 1311-1314.; trans. (1963) Sov. Phys. Dokl. 149, 8–10. [Google Scholar]
- 2.Gubbins D. (1977) J. Geophys. 43, 453-464. [Google Scholar]
- 3.Loper D. E. & Roberts, P. H. (1978) Geophys. Astrophys. Fluid Dyn. 9, 289-321. [Google Scholar]
- 4.Hollerbach R. & Jones, C. A. (1993) Nature 365, 541-543. [Google Scholar]
- 5.Glatzmaier G. A. & Roberts, P. H. (1995) Nature 377, 203-209. [Google Scholar]
- 6.Lehmann I. (1936) Bur. Cent. Seismol. Int. 14, 3-31. [Google Scholar]
- 7.Birch A. F. (1952) J. Geophys. Res. A 57, 227-286. [Google Scholar]
- 8.Dziewoński A. M. & Gilbert, F. (1971) Nature 234, 465-466. [Google Scholar]
- 9.Masters G. & Gilbert, F. (1981) Geophys. Res. Lett. 8, 569-571. [Google Scholar]
- 10.Poupinet G., Pillet, R. & Souriau, A. (1983) Nature 305, 204-206. [Google Scholar]
- 11.Morelli A., Dziewoński, A. M. & Woodhouse, J. H. (1986) Geophys. Res. Lett. 13, 1545-1548. [Google Scholar]
- 12.Woodhouse J. H., Giardini, D. & Li, X.-D. (1986) Geophys. Res. Lett. 13, 1549-1552. [Google Scholar]
- 13.Gu Y. J., Dziewoński, A. M., Su, W.-J. & Ekström, G. (2001) J. Geophys. Res. 106, 11169-11199. [Google Scholar]
- 14.Su W.-J. & Dziewoński, A. M. (1995) J. Geophys. Res. 100, 9831-9852. [Google Scholar]
- 15.Dziewoński A. M. (2000) in Problems in Geophysics for the New Millennium, eds. Boschi, E., Ekström, G. & Morelli, A. (Editrice Compositori, Bologna, Italy), pp. 289–349.
- 16.Tanaka S. & Hamaguchi, H. (1997) J. Geophys. Res. 102, 2925-2938. [Google Scholar]
- 17.Song X. & Helmberger, D. V. (1998) Science 282, 924-927. [DOI] [PubMed] [Google Scholar]
- 18.Creager K. C. (1999) J. Geophys. Res. 104, 23127-23139. [Google Scholar]
- 19.Ishii, M., Dziewoński, A. M., Tromp, J. & Ekström, G. (2002) J. Geophys. Res., in press.
- 20.Creager K. C. (1992) Nature 356, 309-314. [Google Scholar]
- 21.Tromp J. (1993) Nature 366, 678-681. [Google Scholar]
- 22.Ishii, M., Tromp, J., Dziewoński, A. M. & Ekström, G. (2002) J. Geophys. Res., in press.
- 23.Dziewoński A. M. & Anderson, D. L. (1981) Phys. Earth Planet. Inter. 25, 297-356. [Google Scholar]
- 24.Song X. & Helmberger, D. V. (1993) Geophys. Res. Lett. 20, 285-288. [Google Scholar]
- 25.Bréger L. & Romanowicz, B. (1998) Science 282, 718-720. [DOI] [PubMed] [Google Scholar]
- 26.Tkalc̆ić H., Romanowicz, B. & Houy, N. (2002) Geophys. J. Int. 148, 599-616. [Google Scholar]
- 27.Dziewoński A. M. & Gilbert, F. (1976) Geophys. J. Roy. Astron. Soc. 44, 7-17. [Google Scholar]
- 28.Su W.-J. & Dziewoński, A. M. (1997) Phys. Earth Planet. Inter. 100, 135-156. [Google Scholar]
- 29.Weng Z. & Dahlen, F. A. (1995) Geophys. Res. Lett. 22, 3099-3102. [Google Scholar]
- 30.Boschi L. & Dziewoński, A. M. (1999) J. Geophys. Res. 104, 25567-25594. [Google Scholar]
- 31.Steinle-Neumann G., Stixrude, L., Cohen, R. E. & Gulseren, O. (2001) Nature 413, 57-60. [DOI] [PubMed] [Google Scholar]
- 32.Mao H.-k., Shu, J., Shen, G., Hemley, R. J., Li, B. & Singh, A. K. (1998) Nature 396, 741-743. [Google Scholar]
- 33.Jeanloz R. & Wenk, H. R. (1988) Geophys. Res. Lett. 15, 72-75. [Google Scholar]
- 34.Romanowicz B., Li, X.-D. & Durek, J. (1996) Science 274, 963-966. [DOI] [PubMed] [Google Scholar]


