Abstract
Fluorescence resonance energy transfer (FRET) between lipid-linked donor and acceptor molecules in two apposing lipid bilayer membranes is used to resolve topographical features at an intermembrane junction. Efficient energy transfer occurs when the membranes are apposed closely, which creates an image, or footprint, that maps the contact zone and reveals nanometer-scale topographical structures. We experimentally characterize intermembrane FRET by using a supported membrane junction consisting of a glass-supported lipid membrane, onto which a second membrane is deposited by rupture of a giant vesicle. A series of membrane junctions containing different glycolipids (phosphatidylinositol and ganglioside GM1), protein (cholera toxin), and lipid-linked polyethylene glycol are studied. The carbohydrate and protein components influence the intermembrane separation. Differential FRET efficiency is clearly distinguishable for each case. Quantitative analysis of the FRET efficiency yields measurements of intermembrane-separation distances that agree precisely with structural data on GM1 and cholera toxin. The lateral arrangement of molecular species on the membrane surface thus can be discerned by their influence on membrane spacing without the need for direct labeling of the molecule of interest. In the case of polyethylene glycol lipid-containing membrane junctions, imaging by intermembrane FRET reveals spontaneously forming patterns that are not visible in conventional fluorescence images.
Numerous intercellular recognition and signaling processes are transduced by highly organized collections of membrane receptor proteins that congregate at the cell–cell junction. These synapses have been known to exist between neurons for nearly 100 years (1). More recently, similar structures have emerged as a prominent theme among immune cells (2–5). The mechanisms by which proteins become organized at a synapse and the functional role of this organization are currently areas of intense interest. A particularly intriguing observation is that proteins involved in the immune synapse have vastly different sizes; furthermore, this size discrepancy seems to play a role in the sorting of proteins into different regions of the synaptic pattern (4, 6–8). Quantitative studies of synapse assembly in T cells indicate that differential protein sizes, in conjunction with mechanical constraints imposed by the cell membrane, can lead to self-organizing tendencies (9). These results highlight the possibility of an intimate functional relationship between membrane topography, protein organization, and cell–cell signaling. Further investigation of these principles creates a distinct need for methods of imaging nanometer-scale topography at intermembrane junctions in living cells and reconstituted membrane systems.
Fluorescence resonance energy transfer (FRET) is a widely applied spectroscopic tool that can measure intermolecular distances with Angstrom precision (10, 11). FRET between probes within a single membrane has been applied extensively to the study of membrane lateral organization (11–15). FRET between membranes, which has been comparatively uncommon, was first applied to study membrane-fusion processes (16). More recently, we adapted this principle to map the contact zone between membranes in a reconstituted membrane junction (17).
A supported membrane, formed by fusion of small unilamellar vesicles (SUVs) with a silica substrate, serves as the lower membrane in the junction (18–21). A second (upper) membrane then is deposited onto the lower supported membrane by rupture of a giant unilamellar vesicle (GUV). This procedure results in the formation of a stable intermembrane junction. Both membranes in the junction exhibit lateral fluidity, thus enabling complex molecular reorganization processes such as those that occur at the junction between living cells. Incorporation of complementary fluorescent probes into each of the two membranes allows imaging of the system by fluorescence microscopy. FRET occurs between the membranes in regions over which they are in close contact. The resulting FRET footprint thus provides subnanometer-scale information about the contact zone.
In the following, we characterize intermembrane FRET as a method of imaging molecular organization at a membrane junction. Resolution is derived from the differential effect on membrane topography induced by molecules of unequal size. FRET efficiency is examined for a series of membranes containing different glycolipids [phosphatidylinositol (PI) and ganglioside GM1] and GM1-bound cholera toxin protein. The glycolipids and protein modulate intermembrane spacing in the junction. The observed FRET efficiency is clearly distinguishable for each of the situations studied. A simple model for the functional dependence of FRET efficiency on acceptor concentration is used to extract quantitative distance measurements (16, 22–24). Average intermembrane fluorophore separations are determined to be 3.5 (PI), 4.6 (GM1), and 6.7 nm (GM1–cholera toxin). The 1.1-nm differential separation corresponding to the GM1 pentasaccharide and the 2.1-nm additional increment due to cholera toxin binding agree with x-ray diffraction (25) and crystallographic (26) data on these molecules.
Molecular-scale resolution of the membrane spacing offers a strategy for imaging the lateral organization of membrane-surface molecules in which size is the distinguishing observable feature. Because fluorescent probes can be associated with any membrane component, direct labeling of the molecules of interest is not required. The use of energy-transfer pairs with different Förster radii and linkage positions in the membrane further allows tunability of the distance sensitivity; two such pairs are studied. This strategy is used to observe spontaneously forming patterns of polyethylene glycol (PEG) lipid at intermembrane junctions. These patterns, which result from the differential adhesion properties of the PEG and phospholipid components of the mixed membrane along with membrane mechanical properties, previously have been known only from interferometric observations (27–29). No such patterns are visible in conventional fluorescence images. Intermembrane FRET clearly resolves patterns in the PEG-lipid system and thus emerges as an effective method of imaging nanometer-scale topography and corresponding molecular organization at membrane junctions.
Materials and Methods
All lipids were obtained from Avanti Polar Lipids. Dimyristoyl-phosphatidylcholine (DMPC), dioleoyl-dimethylammonium propane (DODAP), plant-derived PI, 1-palmitoyl-2-{12-[(NBD)amino]dodecanoyl}-sn-glycero-3-[phospho-rac-(1-glycerol)] (ammonium salt) (NBD-PG), 1-palmitoyl-2-{12-[(NBD)amino]dodecanoyl}-sn-glycero-3-phosphocholine (NBD-PC), and 1,2-diacyl-sn-glycero-3-phosphoethanolamine-n-[methoxy(PEG)-2000] were received in chloroform and stored at −20°C for up to 3 weeks. Galβ1-3GalNAcβ1-4 (NeuAcα2-3) Galβ1-4Glcβ1-1′-ceramide, ovine-ammonium salt (GM1), was received in powder form and dissolved in 2:1 chloroform/methanol to 5 mg/ml for storage at −20°C. The fluorescent probes 2-[4,4-difluoro-5-(4-phenyl-1,3-butadienyl)-4-bora-3a,4a-diaza-s-indacene-3-pentanoyl]-1-hexadecanoyl-sn-glycero-3-phosphocholine (BODIPY-3806), 2-(4,4-difluoro-5-octyl-4-bora-3a,4a-diaza-s-indacene-3-pentanoyl)-1-hexadecanoyl-sn-glycero-3-phosphocholine (BODIPY-3795), and N-(Texas red sulfonyl)-1,2-dihexadecanoyl-sn-glycero-3-phosphoethanolamine, triethylammonium salt (Texas red DHPE), were purchased from Molecular Probes in powder form and dissolved in chloroform before use. Unlabeled cholera toxin subunit B was purchased from Sigma–Aldrich. Cholera toxin subunit B Alexa Fluor 594 was purchased from Molecular Probes. Both proteins were dissolved at 2 mg/ml in distilled water and stored at 4°C.
Planar supported bilayers were formed by fusion of SUVs onto clean glass coverslips. A lipid solution in chloroform was evaporated onto small round-bottom flasks and hydrated overnight at 4°C in distilled water at ≈2 mg/ml. The lipids were probe-sonicated to clarity in a cold-water bath and ultracentrifuged for 2.5 h at 166,000 × g and 4°C. The supernatant was stored at 4°C for up to 3 weeks. For membranes containing GM1, SUVs were formed by extrusion with a miniextruder from Avanti Polar Lipids by using a 0.3-μm polycarbonate filter. Glass surfaces were prepared for SUV deposition by etching in piranha solution (3:1 sulfuric acid/hydrogen peroxide) for 15 min. They were rinsed extensively in distilled water and blown dry with compressed air. A bilayer was allowed to self-assemble by placing a cleaned coverslip over a 50-μl droplet of spreading solution (1:1 SUV/PBS). Excess vesicles were rinsed away with distilled water. Cholera toxin was bound to GM1-containing membranes by incubating a 4 μg/ml solution of the protein with the supported membrane for 2 h in the dark at room temperature. The membranes were rinsed extensively with distilled water to remove the unbound protein.
Membrane junctions were formed by rupture of a GUV onto a planar supported bilayer. GUVs were prepared in similar fashion to that described by Kinosita and coworkers (30) with some simplifications. A lipid solution in chloroform was evaporated in small round-bottom flasks and suspended at ≈1 mg/ml in 0.5 M sucrose that was prewarmed to 45°C. The flasks were placed into a 45°C water bath and allowed to come to room temperature overnight. A cloud of lipids floating in the center of the round-bottom flasks was observed in successful GUV preparations. GUVs were ≈10–25 μm in diameter and stored for up to 3 weeks in 0.5 M sucrose at 4°C. GUVs were brought to room temperature before use. Five microliters of the 1 mg/ml GUV sucrose suspension was pipetted directly above the planar bilayer, which was kept in wells under distilled water. Because of the difference in density, GUVs settle toward the supported bilayer and rupture after contact, producing the supported membrane junction. Excess GUVs were rinsed away by exchanging the solution above the supported bilayer.
Membranes were viewed at room temperature with a Nikon TE300 inverted fluorescence microscope (Nikon, Japan) equipped with a mercury arc lamp for illumination. Images were recorded with a Hamamatsu charge-coupled device camera (Hamamatsu C4742–98, Tokyo). Images were acquired and analyzed with SIMPLE PCI (Compix, Cranberry Township, PA).
Results and Discussion
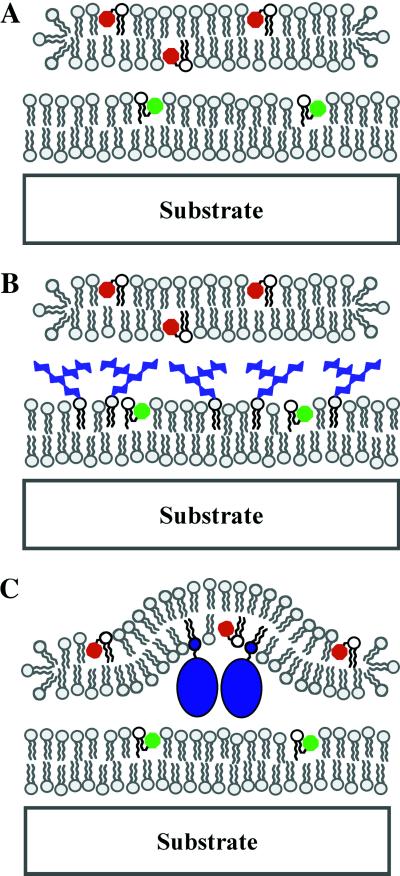
Junctions between two distinct fluid lipid membranes were created by rupture of GUVs onto supported membranes. All supported (lower) membranes described here were formed by fusion of SUV suspensions and are laterally homogeneous to the diffraction-limited resolution of the fluorescence imaging system. The second membrane in the junction is deposited from a single GUV, which is typically 10–25 μm in diameter. Rupture of a GUV on the surface of the lower supported membrane produces an intermembrane junction. Supported membrane junctions are stable for 30 min or more without lipid exchange between the two membranes. When mixing does occur, it is readily detectable in the fluorescence image; these membrane junctions are discarded. Schematic representations of typical membrane junctions are depicted in Fig. 1. The structure and size of molecular species on the membrane surface influences intermembrane spacing. A substantially enabling characteristic of this configuration is that the upper membrane is flexible and can undergo bending deformations. These bending deformations result in a topography that both reflects and influences molecular organization at the membrane junction (as illustrated in Fig. 1C).
Fig 1.
Schematic diagrams of supported intermembrane junctions. Molecular species on the membrane surface influence intermembrane spacing. A and B depict situations corresponding to the PI- and GM1-containing membrane junctions described in Results and Discussion. C illustrates how membrane-bending deformations can couple to molecular organization in the junction, which is representative of the PEG-lipid junctions discussed later in Results and Discussion.
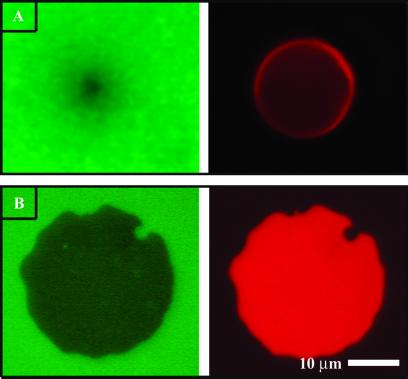
FRET, between complementary fluorescent probes in the two membranes, reveals topographical information about the junction with subnanometer precision. This effect is observable in fluorescence images of the junctions. Fig. 2A illustrates an unruptured GUV (red, Right) resting on a supported membrane (green, Left). The geometry of the contact area between the roughly spherical GUV and the planar supported membrane is reflected in the quenching profile that is observed in the fluorescence image of the lower supported membrane. Fig. 2B illustrates a supported membrane junction formed after rupture of a GUV onto the lower membrane. In this case, uniform adhesion between the two membranes results in a homogeneous contact zone. A quenching footprint that maps this contact zone is observed in fluorescence from the lower membrane (green, Left). Quantitative analysis of quenching efficiency reveals the intermembrane spacing in the junction.
Fig 2.
(A) Fluorescence image of the lower (green, Left) and upper (red, Right) membranes of an unruptured GUV on a supported membrane. (B) Image of a supported membrane junction formed after rupture of a GUV. In both cases, patterns seen in the lower membranes result from intermembrane FRET to acceptors in the upper membrane.
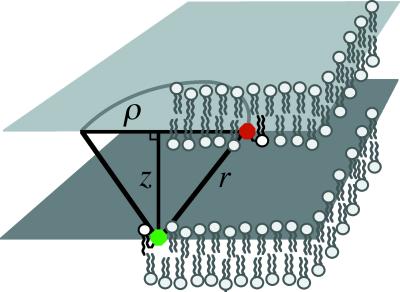
We consider a simple geometric model for the FRET quenching of a donor by a population of acceptors, which are distributed in an offset plane. This configuration is depicted schematically in Fig. 3. Once excited, each donor fluorophore may relax to its ground state by either fluorescence emission or nonradiative energy transfer to any of the nearby acceptors. The quenching efficiency thus is determined by the cumulative probability of energy transfer to an acceptor, which can be calculated from the transfer rate for a donor to a single acceptor. For such a pair, separated by a distance r, the individual rate, ki, at which energy is transferred to the acceptor is
 |
where τD is the lifetime of the donor in the absence of acceptor, and R0 is the Förster distance (11). Letting ρ represent the in-plane radial coordinate and z represent the displacement of the donor from the acceptor plane, the donor–acceptor distance is given by r =  (Fig. 3). The cumulative rate of energy transfer to an acceptor in the plane, kT, is obtained by integrating ki over the acceptor plane (16, 22–24):
 |
where σ denotes the density of acceptor molecules in the plane (molecules per unit area). Eq. 2 provides the energy-transfer rate to a single plane of acceptors. The two leaflets of the acceptor bilayer membrane result in two planes of acceptors separated by a distance, δ, which is determined by the position of the acceptor chromophores in the bilayer (δ ≈ 4 nm for lipid headgroup-associated probes such as the Texas red DHPE). Energy transfer from each donor can occur to acceptors distributed in two planes located at z and z + δ. The rates of transfer to both leaflets must be summed to obtain the total transfer rate. FRET efficiency, E, is given by
 |
where the primes denote the proximal and distal leaflets of the acceptor bilayer at separation distances of z and z + δ, respectively. More accurate expressions can be obtained by explicitly considering both leaflets of the donor membrane as well. Noting that τD factors out of Eq. 3, E exhibits direct dependence on z, R0, and σ. This relationship is used to analyze FRET measurements.
Fig 3.
Schematic illustrating the model of intermembrane FRET as quenching of fluorescence emission from a donor (in lower membrane) by an offset plane of acceptors (upper membrane). The offset distance between the donor and the acceptor plane is z, and r is the distance between the donor and an acceptor. ρ is the in-plane radial coordinate over which the integration is performed.
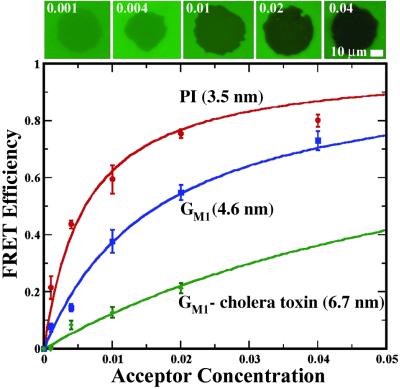
FRET efficiency measurements were collected over a range of acceptor concentrations (σ) for membrane junctions containing PI, GM1, and GM1-bound cholera toxin subunit B. These data are plotted in Fig. 4 along with representative images of FRET footprints of differing efficiency. FRET efficiency was determined as a ratio of the net decrease in fluorescence within the footprint relative to the unquenched membrane outside of the contact zone. All membranes studied here consisted primarily of DMPC doped with the lipids and probes under investigation. Lower membranes in the PI junctions contained 7 mol % DODAP and 2 mol % of the donor, NBD-PG, and the upper membranes contained 5 mol % PI, 1 mol % DODAP, and various amounts of the acceptor, Texas red DHPE. Inclusion of the positively charged DODAP facilitates adhesion between the membranes. GM1 junctions were prepared with 2 or 4 mol % GM1 and 2 mol % NBD-PG in the lower membrane and 0, 2, or 4 mol % GM1, 5 mol % DODAP, and various amounts of Texas red DHPE in the upper membrane. GM1-bound cholera toxin junctions were created by incubating GM1-containing lower membranes with cholera toxin before deposition of the upper membrane. Cholera toxin binds specifically to the galactose and sialic acid terminal sugars of the branched GM1 pentasaccharide (26). Control experiments using fluorescently labeled cholera toxin (Alexa Fluor 594) were used to confirm that the protein was bound at saturation levels and distributed uniformly to the resolution of the optical microscope. GUVs, without GM1, were ruptured onto the cholera toxin-coated membrane to form the junctions.
Fig 4.
FRET efficiency data for PI, GM1, and GM1: cholera toxin membrane junctions. The sequence of images depicts FRET footprints from PI junctions for each of the acceptor (Texas red DHPE) mole fractions (σ) as labeled. Solid curves represent calculations based on Eq. 3 with intermembrane-separation distances (z) as labeled.
Observations of FRET footprints for a range of GM1 and cholera toxin concentrations appear homogeneous. Measured FRET efficiency profiles show little dependence on surface coverage of these molecules at 2% or greater mole fractions, suggesting that the intermembrane spacing is essentially constant. This behavior is in contrast to the adhesion-induced reorganization and domain formation seen in the PEG-lipid systems described further below.
Characteristically different FRET efficiencies were observed for the PI, GM1, and GM1-bound cholera toxin configurations. PI is the smallest membrane-surface moiety, consisting of a single inositol group bound to a phospholipid. Correspondingly, PI junctions exhibit the most efficient FRET. The ganglioside GM1 is larger, with a pentasaccharide group bound to a ceramide membrane anchor. This size difference is discernable at all acceptor concentrations. Binding cholera toxin to GM1-containing membranes also produces a distinctively recognizable effect on the FRET efficiency.
Quantitative measurements of FRET efficiency were fit to calculations based on Eq. 3 to determine the average intermembrane fluorophore spacing, z. Calculated FRET-efficiency curves are plotted against the measured efficiencies in Fig. 4. These results indicate the average spacings to be 3.5, 4.6, and 6.7 nm for the PI, GM1, and GM1–cholera toxin junctions, respectively. An estimate of R0 = 5 nm for the Texas red–NBD pair is used (11), and δ = 4 nm was estimated for the Texas red DHPE bilayer. No adjustments were made for two planes of the donor, because there is evidence suggesting that negatively charged probes can be enriched substantially in the upper leaflet of supported membranes formed by fusion of SUVs (31). The absolute values of these distance determinations are sensitive to the estimates of R0 and, to a lesser extent, to δ. However, the relative distances obtained are accurate. For example, x-ray diffraction analysis of osmotically stressed multibilayers indicates that GM1 extends 1.2 nm above the phosphatidylcholine membrane surface (25); we determine a 1.1-nm difference in membrane spacing induced by GM1, relative to the PI/DMPC membrane junctions. The 3.2-nm height of the GM1–cholera toxin complex determined from intermembrane FRET is in direct agreement with structural information from x-ray crystallography data (26).
One factor that can influence the effective value of R0 for intermembrane FRET is the orientational freedom of the donor and acceptor probes. We compare FRET efficiency between fluid and nonfluid membranes of identical composition to briefly explore this phenomenon. DMPC has a gel–fluid transition temperature of 23°C (32). The membranes studied here are fluid at room temperature with diffusion coefficients in the range of 1–5 μm2/s as determined by rough fluorescence recovery after photobleaching experiments (19). Binding of cholera toxin to GM1-containing membrane was observed to reduce but not fully arrest the long-range diffusion of the probe lipid. In contrast, lowering the temperature below 23°C (by adding ice water) freezes the membranes, drastically reducing the lipid mobility. Data comparing FRET efficiency for gel and fluid membranes reveal that small differences are observable. Probe immobilization by a fluid–gel transition generally leads to a 10% or smaller reduction in FRET efficiency in the PI/DMPC membrane system studied.
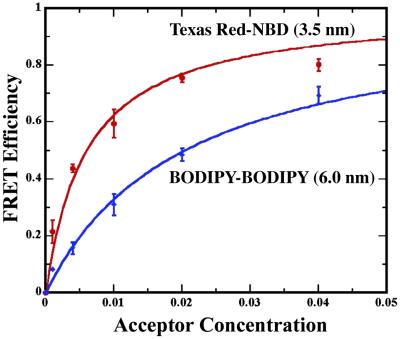
Measurements of intermembrane spacing are influenced directly by the average position of the donor and acceptor chromophores in the membrane bilayer. We explore the consequences of probe position by examining an alternative FRET pair consisting of complementary lipid-linked BODIPY probes. FRET measurements and calculated efficiency curves are plotted for PI junctions labeled with the two FRET pairs in Fig. 5. The intermembrane probe-separation distance (z) of 6.0 nm for the BODIPY–BODIPY combination was determined by using R0 = 5.7 nm (11) and δ = 3 nm. This larger z value, compared with the Texas red–NBD pair, is consistent with the fact that both BODIPY probes are tail-labeled, whereas the Texas red DHPE is head-labeled. Whether probe position within the membrane fully accounts for the 2.5-nm calculated difference in separation is not known. Absolute comparison of measurements made with different probe pairs is complicated by the need for accurate estimates of R0 and knowledge of probe position. For the purposes of resolving molecular organization, however, relative membrane-spacing observations are sufficient, thus precluding the need for extensive calibration. Choice of FRET probe pairs and membrane linkage positions of the chromophores is based on optimization of contrast between the relevant molecular species.
Fig 5.
FRET efficiency data for PI junctions using Texas red–NBD and BODIPY–BODIPY probe pairs. Solid curves represent calculations based on Eq. 3 with intermembrane-separation distances (z) as labeled.
A useful application of intermembrane FRET is to resolve patterns of molecules that assemble in concert with bending deformations of membranes in a junction. To study this phenomenon, we create junctions in which the upper membrane is doped with PEG lipid (0.3 mol % PEG lipid/1 mol % DODAP/1mol % Texas red DHPE/97.7 mol % DMPC). The 2,000 molecular weight PEG moiety acts as a spacer that forces a greater separation between the membranes in the junction. When the PEG groups are present at submonolayer coverage densities, a type of adhesion-induced phase separation can ensue (28, 29, 33). This reorganization is driven by the differential adhesive properties of the PEG and other lipids in the membrane along with bending energy of the membrane itself. The most stable configuration is achieved when domains of high PEG density condense against a background of low PEG density (illustrated schematically in Fig. 1C). This phenomenon has been studied by using reflection interference contrast microscopy (27–29, 33) to resolve the membrane topography and corresponding organization of the PEG lipid. In the present investigation, the PEG-lipid system is used as a test case to characterize the ability of intermembrane FRET to resolve such topographical membrane patterns.
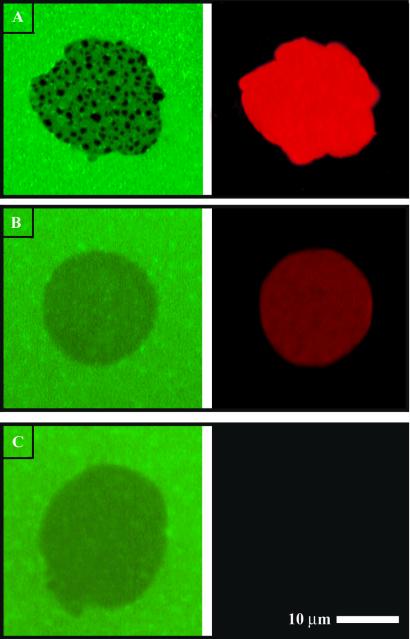
FRET images of a PEG lipid-containing intermembrane junction are depicted in Fig. 6. It is clear that FRET is laterally inhomogeneous in the otherwise continuous and fluid membrane. Control experiments without PEG lipid produce uniform footprints as seen, for example, in Fig. 4. Membrane fluidity is confirmed by qualitative fluorescence recovery after photobleaching experiments. The excitation aperture of the microscope is stopped down, exposing and bleaching a portion of the membrane (Fig. 6B). Full fluorescence recovery by unrestricted diffusive mixing is observed within 5 min as shown in Fig. 6C. Note that the upper edge of the footprint consists of a nearly complete domain of reduced fluorescence. If diffusion were restricted in this region, discontinuities in the recovery pattern would be readily observed (see, for example ref. 19). Consistently uniform recovery in multiple experiments indicates unrestricted diffusion in the correspondingly continuous lower membrane.
Fig 6.
(A) FRET footprint in the lower membrane of a junction containing 0.3 mol % PEG lipid in the upper membrane. The pattern reflects spontaneous organization of the PEG lipid as described in Results and Discussion. (B) A portion of the membrane has been selectively photobleached. (C) After 5 min, full recovery of fluorescence by diffusive mixing has occurred.
Fig. 7 illustrates fluorescence images of both lower and upper membranes for several PEG-lipid junctions containing different concentrations of acceptor lipid probe (Texas red DHPE). FRET patterns in the lower membrane (green, Left) in Fig. 7A contrast the uniform distribution of acceptor probes in the upper membrane (red, Right), which indicates that the observed FRET pattern results from membrane topography and not from lateral concentration patterns of the acceptor. At acceptor concentrations that are too low to produce observable FRET (0.1 and 0 mol % in Fig. 7 B and C, respectively), no patterns are seen. Observation of these PEG-induced membrane topography patterns occurs only by FRET. The faint and featureless footprint that is observable in Fig. 7 B and C is not due to FRET to the acceptor; note that it persists in the absence of any acceptor (Fig. 7C). This non-FRET influence on fluorescence intensity is observed only in the PEG system and seems to be a general effect of the PEG-lipid membrane. We observe a similar effect when the donor is an uncharged NBD-PC probe, suggesting that this is not due to partial exclusion of the NBD-PG probe from the junction based on its negative charge. One possible explanation is that PEG influences membrane structure in the junction, thus altering the relative position of NBD in the membrane, which can influence the fluorescence and FRET properties of the dye. Although potentially informative, these effects do not impact the results presented here and were not pursued in detail. Intermembrane FRET easily resolves molecular organization of PEG lipid in membrane junctions based on membrane topography.
Fig 7.
PEG-lipid membrane junctions (0.3 mol % PEG-lipid in the upper membrane) with 2 (A), 0.1 (B), and 0.0 mol % (C) Texas red DHPE acceptor in the upper membrane. At 2 mol %, FRET is clear and patterns caused by PEG-induced membrane topography can be seen. At 0.1 mol % or less acceptor, FRET is not visible. The remaining trace of a footprint seen in B and C results from non-FRET effects of the PEG lipid as discussed in Results and Discussion.
Conclusion
Intermembrane FRET is a convenient and informative observational tool that illuminates detailed information about the structure of the contact zone between two membranes. Unlike other topographical imaging techniques such as reflection interference contrast microscopy (27), fluorescence interference microscopy (17, 34, 35), total internal reflection microscopy (36), and scanning probe methods (37), intermembrane FRET is not restricted to planar geometry. FRET is intrinsically short-range and provides resolution on the subnanometer-length scale. Intermembrane distances determined by FRET for GM1 and GM1–cholera toxin junctions agree closely with structural data on these molecules. Another useful characteristic of intermembrane FRET is that it does not require that fluorescent probes be attached to molecules of interest. FRET is well suited to the imaging of supported membrane junctions and is expected to facilitate investigation of molecular-interaction processes in this complex environment.
Acknowledgments
This work was supported in part by the Burroughs Wellcome Career Award in the Biomedical Sciences (to J.T.G.), the Laboratory Directed Research and Development program at Lawrence Berkeley National Laboratory, and National Institutes of Health Grant 1 R01 GM64900-01. A.P.W. was supported by the Chevron Scholars Research Program.
Abbreviations
FRET, fluorescence resonance energy transfer
SUV, small unilamellar vesicle
GUV, giant unilamellar vesicle
PI, phosphatidylinositol
PEG, polyethylene glycol
DMPC, dimyristoyl-phosphatidylcholine
DODAP, dioleoyl-dimethylammonium propane
NBD, 7-nitro-2–1,3-benzoxadiazol-4-yl
Texas red DHPE, N-(Texas red sulfonyl)-1,2-dihexadecanoyl-sn-glycero-3-phosphoethanolamine, triethylammonium salt
This paper was submitted directly (Track II) to the PNAS office.
References
- 1.Sherrington C. S., (1906) The Integrative Action of the Nervous System (Yale Univ. Press, New Haven, CT).
- 2.Paul W. E. & Seder, R. A. (1994) Cell 76, 241-251. [DOI] [PubMed] [Google Scholar]
- 3.Monks C. R. F., Freidberg, B. A., Kupfer, H., Sciaky, N. & Kupfer, A. (1998) Nature 395, 82-86. [DOI] [PubMed] [Google Scholar]
- 4.Grakoui A., Bromley, S. K., Sumen, C., Davis, M. M., Shaw, A. S., Allen, P. M. & Dustin, M. L. (1999) Science 285, 221-227. [DOI] [PubMed] [Google Scholar]
- 5.Davis D. M., Chiu, I., Fasset, M., Cohen, G. B., Mandelboim, O. & Strominger, J. L. (1999) Proc. Natl. Acad. Sci. USA 96, 15062-15067. [DOI] [PMC free article] [PubMed] [Google Scholar]
- 6.Shaw A. S. & Dustin, M. L. (1997) Immunity 6, 361-369. [DOI] [PubMed] [Google Scholar]
- 7.vanderMerwe P. A. & Davis, S. J. (2002) Science 295, 1479-1480. [DOI] [PubMed] [Google Scholar]
- 8.Lee K.-H., Holdorf, A. D., Dustin, M., Chan, A., Allen, P. M. & Shaw, A. S. (2002) Science 295, 1539-1542. [DOI] [PubMed] [Google Scholar]
- 9.Qi S. Y., Groves, J. T. & Chakraborty, A. K. (2001) Proc. Natl. Acad. Sci. USA 98, 6548-6553. [DOI] [PMC free article] [PubMed] [Google Scholar]
- 10.Stryer L. (1978) Annu. Rev. Biochem. 47, 819-846. [DOI] [PubMed] [Google Scholar]
- 11.Lakowicz J. R., (1999) Principles of Fluorescence Spectroscopy (Kluwer Academic/Plenum, New York).
- 12.Fung B. K. K. & Stryer, L. (1978) Biochemistry 17, 5241-5248. [DOI] [PubMed] [Google Scholar]
- 13.Dewey T. G. (1991) in Biophysical and Biochemical Aspects of Fluorescence Spectroscopy, ed. Dewey, T. G. (Plenum, New York), pp. 197–230.
- 14.Varma R. & Mayor, S. (1998) Nature 394, 798-801. [DOI] [PubMed] [Google Scholar]
- 15.Kenworthy A. K., Petranova, N. & Edidin, M. (2000) Mol. Biol. Cell 11, 1645-1655. [DOI] [PMC free article] [PubMed] [Google Scholar]
- 16.Niles W. D., Silvius, J. R. & Cohen, F. S. (1996) J. Gen. Physiol. 107, 329-351. [DOI] [PMC free article] [PubMed] [Google Scholar]
- 17.Wong A. P. & Groves, J. T. (2001) J. Am. Chem. Soc. 123, 12414-12415. [DOI] [PubMed] [Google Scholar]
- 18.Sackmann E. (1996) Science 271, 43-48. [DOI] [PubMed] [Google Scholar]
- 19.Salafsky J., Groves, J. T. & Boxer, S. G. (1996) Biochemistry 35, 14773-14781. [DOI] [PubMed] [Google Scholar]
- 20.Groves J. T., Ulman, N. & Boxer, S. G. (1997) Science 275, 651-653. [DOI] [PubMed] [Google Scholar]
- 21.Groves J. T. & Boxer, S. G. (2002) Acc. Chem. Res. 35, 149-157. [DOI] [PubMed] [Google Scholar]
- 22.Kuhn H. (1970) J. Chem. Phys. 53, 101-108. [Google Scholar]
- 23.Gibson G. A. & Loew, L. M. (1979) Biochem. Biophys. Res. Commun. 88, 141-146. [DOI] [PubMed] [Google Scholar]
- 24.Fromherz P. & Reinbold, G. (1988) Thin Solid Films 160, 347-353. [Google Scholar]
- 25.McIntosh T. & Simon, S. A. (1994) Biochemistry 33, 10477-10486. [DOI] [PubMed] [Google Scholar]
- 26.Merritt E. A., Sarfaty, S., vandenAkker, F., L'Hoir, C., Martial, J. A. & Hol, W. G. J. (1994) Protein Sci. 3, 166-175. [DOI] [PMC free article] [PubMed] [Google Scholar]
- 27.Rädler J. & Sackmann, E. (1993) J. Phys. II [French] 3, 727-748. [Google Scholar]
- 28.Albersdörfer A., Feder, T. & Sackmann, E. (1997) Biophys. J. 73, 245-257. [DOI] [PMC free article] [PubMed] [Google Scholar]
- 29.Kloboucek A., Behrisch, A., Faix, J. & Sackmann, E. (1999) Biophys. J. 77, 2311-2328. [DOI] [PMC free article] [PubMed] [Google Scholar]
- 30.Akashi K., Hidetake, M., Hiroyasu, I. & Kinosita, K. (1996) Biophys. J. 71, 3242-3250. [DOI] [PMC free article] [PubMed] [Google Scholar]
- 31.Provencal R. A., Ruiz, J. D., Parikh, A. N. & Shreve, A. P. (2001) Biophys. J. 80, 423A-424A. [Google Scholar]
- 32.Silvius J. R., (1982) Lipid–Protein Interactions (Wiley, New York).
- 33.Nardi J., Bruinsma, R. & Sackmann, E. (1998) Phys. Rev. E 58, 6340-6354. [Google Scholar]
- 34.Lambacher A. & Fromherz, P. (1996) Appl. Phys. A 63, 207-216. [Google Scholar]
- 35.Lambacher A. & Fromherz, P. (2002) J. Opt. Soc. Am. B 19, 1435-1453. [Google Scholar]
- 36.Tamm L. K. & Kalb, E. (1993) in Molecular Luminescence Spectroscopy, ed. Schulman, S. G. (Wiley, New York), Vol. 77, pp. 253–305. [Google Scholar]
- 37.Shao Z., Mou, J., Czajkowsky, D. M., Yang, J. & Yuan, J.-Y. (1996) Adv. Phys. 45, 1-86. [Google Scholar]


