

Abstract
The coding regions of many of the major histocompatibility complex (MHC) (human leukocyte antigen [HLA] in humans) molecules are believed to be subject to balancing selection. But it is less certain whether the regulatory regions of such coding sequences are also subject to the same type of selection. Here, we studied the polymorphism of the regulatory regions of the HLA-DPA1 and HLA-DPB1 genes among ethnic minorities in southwestern China. Phylogenetic analysis revealed two deep clades >10 million years old. There is almost complete linkage disequilibrium between the regulatory and coding regions of HLA-DPA1, which hints at coadaptive balancing selection on the entire region. Thus, the molecular mechanism of balancing selection in MHC may involve expression modulation in addition to coding-region polymorphisms. Although the frequency of clade II is >30% in some ethnic minorities, it decreases to <5% among southern Han Chinese and vanishes among Europeans. As suspected, some ancient balanced polymorphisms, lost in major populations, still exist in isolated ethnicities. These isolated populations may thus contribute disproportionately to the total diversity of modern humans.
Human populations have experienced enormous environmental changes in the past 100,000 years. We have adapted to various climates while migrating worldwide from Africa. The rise in food production altered the diet and increased population density, which then facilitated the spread of infectious diseases (Cavalli-Sforza et al. 1996). Some aspects of the genetic architecture in humans could thus reflect these changes in selective pressure. For example, many of the ancient balanced polymorphisms may have been lost, and new ones may have emerged (Cavalli-Sforza et al. 1996; Wang et al. 2003; Stefansson et al. 2005). Some populations may plausibly be reservoirs of balanced polymorphisms that are lost in others. These populations probably maintain a lifestyle (and experience selective pressure) that may resemble the ancestral conditions more closely than those of most agrarian populations. In the Yunnan province of southwestern China, there is a rich diversity of ethnicities, partly because of the complex geography and history of the region. Of the 56 Chinese ethnicities, 15 live predominantly or exclusively in Yunnan (Chen 1989). These ethnicities provide an excellent opportunity to search for ancient balanced polymorphisms that may have been lost elsewhere.
It is widely accepted that balancing selection acting on the coding regions of major histocompatibility complex (MHC) (human leukocyte antigen [HLA] in humans) genes is responsible for their high diversity. Variation in the coding regions allows the presentation of a wider array of antigens in immune recognition (Hughes and Yeager 1998). In parallel, variation in the expression of MHC class II genes among different antigenpresenting cells (dendritic cells or B cells) may induce different T-helper 1 (Th1) and/or Th2 responses (Baumgart et al. 1998). If that is true, the regulatory region may also be subject to balancing selection. A relatively high level of polymorphism has been reported for the transcription factor–binding boxes in mouse (Cowell et al. 1998; Mitchison and Roes 2002). However, there is not yet convincing evidence of either balancing selection acting on the regulatory regions of MHC genes or their coadaptation with the coding sequences.
Here, we studied the polymorphism in the regulatory regions of the HLA-DPA1 (DPA1 [MIM 142880]) and HLA-DPB1 (DPB1 [MIM 142858]) genes among the ethnicities of Yunnan as well as the majority Han population of China. The two genes are located in a head-to-head manner in the class II region (6p21.3) of HLA (fig. 1) and encode the α and β chains, respectively. These chains are assembled as a heterodimer to present antigens to CD4+ T lymphocytes and to provoke immune responses (Trowsdale 1996). Although there is often strong linkage disequilibrium in the HLA region, a recent study (Miretti et al. 2005) has suggested that there is lower linkage disequilibrium in the DPA1 and DPB1 genes than in the other regions of HLA.
Figure 1.

Structure of DPA1 and DPB1. The sequenced regions A, B, and C are demarcated, and lengths are indicated.
Material and Methods
Samples
We first sampled 14 individuals from several ethnicities in southwestern China. In the present article, the ethnicities Han, Jing, Li, Lahu, Naxi, Pumi, and Yao are abbreviated as H, J, Li, La, N, P, and Y in sample and taxon names. Most of these ethnic groups, despite having different demographic histories in the recent past, were probably related at an earlier time. Additional samples of 45 Lahu, 31 Han, 47 European, and 7 African individuals were used for limited sequencing (see below).
Amplification and Sequencing
The amplified regions are shown in figure 1. All the PCR primers are listed in table 1. For the first 14 samples, region A was amplified and cloned into the pGEM-T Easy Vector (Promega) separately for each individual. Both the PCR product and six positive clones were sequenced for each sample. One individual was identified as a homozygote by direct sequencing of the PCR product. Among the 13 heterozygotes, there were 3 individuals from whom only one sequence each was obtained by cloning. In total, we obtained 25 sequences. The homozygous haplotype was counted twice. The amplification products of regions B and C were sequenced directly after preparation, by use of a PCR product presequencing kit (USB Corporation). When the haplotypes of DPA1 exon 2 and the haplotypes of DPB1 exon 2 had to be determined in the presence of more than one heterozygous site, it was done by referencing the existing and confirmed haplotypes in the population (Rozemuller et al. 1993; Versluis et al. 1993). In this application, the determination was made only for unambiguous cases for which the inferred haplotypes exist in the population and the alternative forms do not. For a few cases in which the haplotypes could not be unambiguously determined, cloning and sequencing were performed as described above.
Table 1.
Primer Sequences and Amplification Regions
|
Primer Sequences(5′→3′) |
||
| Amplification Region | Forward | Reverse |
| Region A | AGGGCTTGAGGGGCTGTATTCAGGAGAT | AGCTGGGTCTGGACTTCAAACTTGGCTC |
| Region C | ACCCCCAAGTCATGAGTTTACC | GAAGAGGCAAAGATAGGGCGTA |
| Region B: | ||
| DPB1 intron 1 segment | AGGAATTCTCAAGAAACTGGTCG | CCTGGATGGTCTCATGTATCTCA |
| DPB1 exon 1 | TGATCACTCAGTGCCCCTGAGCTC | GCCCAAAGCCCTCACTCACCT |
In addition, 45 Lahu samples were sequenced for regions A4, A5, and C; 31 Han samples, for regions A4 and A5; and 47 European and 7 African individuals, for region A5. All sequencing was done on the ABI 3700 sequencer by use of the BigDye reagent (Applied Biosystems). Nucleotide sequence data reported herein are available in the DDBJ/EMBL/GenBank database (accession numbers AY335526–AY335544 and AY603382–AY603395).
Data Analysis
Chimpanzee sequences were obtained from a University of California–Santa Cruz (UCSC) genome database (UCSC Genome Bioinformatics) with the Blat program. DnaSP version 3.5 (Rozas and Rozas 1999) was used to calculate the level of polymorphism, π (the average number of pairwise nucleotide differences per site), and θw (the number of segregating sites per nucleotide). The frequency spectrum of polymorphic sites (Pi) (Fu 1994) is the proportion of sites in which the variant occurs either i or n-i times in a sample of size n. The expected value of Pi in neutral equilibrium was computed as
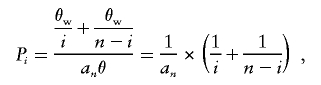 |
where an=1+1/2+1/3+1/(n-1).
The number of synonymous nucleotide substitutions per site (ks) and nonsynonymous nucleotide substitutions per site (ka) in exons was estimated using the Pamilo-Bianchi-Li method (Li 1993; Pamilo and Bianchi 1993) implemented in the MEGA2 program (Kumar et al. 2001). Phylogenetic trees were constructed using the neighbor-joining method, with the distance matrix calculated by Kimura’s two-parameter method with the use of MEGA2. The reliability of the trees was estimated by bootstrapping with 1,000 pseudosamples.
Linkage disequilibrium (r2) between paired sites was computed as
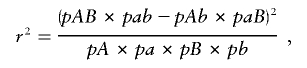 |
and the statistical P values were calculated using a permutation test with 1,000 replications and R 1.9.1 software (R Development Core Team 2005). |D′| was calculated to show the recombination within clade I haplotypes, by use of DnaSP version 4.0 (Rozas and Rozas 1999).
Results and Discussion
We cloned and sequenced region A (fig. 1), covering 4,780 bp that includes the regulatory region, exon 1, and a portion of intron 1 of both DPA1 and DPB1. Signal peptides encoded by both exons 1 regulate the translocation of the DP molecules, are cleaved off in secretion, and have no function in the mature protein. Therefore, we can regard the entire region A as regulatory, in the broad sense. From the 14 individuals in our sample, we obtained 25 sequences comprising 23 haplotypes (see the “Material and Methods” section and table 2) and observed 165 polymorphic sites, excluding insertions and deletions. Although one Naxi sample was identified as a homozygote, the data of the exons 2 of DRB1, DQB1, and DPB1 suggested that the Naxi sample is in Hardy-Weinberg equilibrium (Fu et al. 2003).
Table 2.
Variable Sites in Region A of the 25 Sequences
|
Nucleotide Position |
||||||||||||||||||||||||||||||||||||||||||||||||||||||||||||||||||||||||||||||||||||||||||||||||||||||||||||||||||||||||||||||||||||||||||||||||||||||||||||||||||
| Sample | 80 | 108 | 138 | 153 | 264 | 366 | 373 | 383 | 430 | 483 | 491 | 533 | 538 | 567 | 568 | 651 | 682 | 754 | 762 | 768 | 849 | 881 | 890 | 894 | 900 | 958 | 1020 | 1083 | 1085 | 1094 | 1125 | 1143 | 1236 | 1248 | 1268 | 1277 | 1378 | 1379 | 1401 | 1448 | 1516 | 1539 | 1553 | 1569 | 1593 | 1604 | 1695 | 1705 | 1709 | 1758 | 1770 | 1793 | 1831 | 1840 | 1926 | 1968 | 2001 | 2013 | 2068 | 2109 | 2117 | 2203 | 2206 | 2228 | 2243 | 2292 | 2311 | 2363 | 2392 | 2415 | 2428 | 2447 | 2457 | 2478 | 2520 | 2536 | 2539 | 2550 | 2551 | 2609 | 2645 | 2675 | 2720 | 2722 | 2731 | 2741 | 2742 | 2751 | 2833 | 2862 | 2875 | 2876 | 2888 | 2896 | 2906 | 2949 | 2959 | 2967 | 2971 | 2988 | 3011 | 3022 | 3024 | 3045 | 3071 | 3106 | 3110 | 3130 | 3159 | 3173 | 3185 | 3192 | 3193 | 3216 | 3229 | 3249 | 3254 | 3262 | 3281 | 3291 | 3297 | 3302 | 3323 | 3331 | 3366 | 3422 | 3433 | 3456 | 3524 | 3546 | 3600 | 3615 | 3653 | 3740 | 3796 | 3845 | 3876 | 3879 | 3998 | 4033 | 4047 | 4172 | 4229 | 4237 | 4269 | 4273 | 4283 | 4382 | 4392 | 4396 | 4403 | 4436 | 4446 | 4451 | 4530 | 4549 | 4558 | 4588 | 4610 | 4625 | 4629 | 4636 |
| H.2.1 | C | G | G | A | A | T | A | G | G | G | T | C | C | C | A | C | A | G | T | G | A | A | G | G | C | C | G | T | T | C | C | C | A | A | C | A | C | G | A | A | A | A | C | G | A | C | A | C | G | G | G | C | A | T | C | G | A | A | A | G | A | C | C | A | T | T | T | C | G | T | C | G | C | T | A | C | C | C | G | T | A | T | T | C | A | A | T | G | T | C | C | A | T | G | T | T | A | A | G | A | T | T | C | A | A | A | A | A | A | A | C | T | G | G | T | C | T | C | A | T | C | T | G | C | T | A | A | A | A | A | A | A | C | G | A | A | C | A | A | G | C | C | C | T | C | A | T | C | C | A | C | T | A | C | C | G | G | C | A | A | C | T |
| Li.1.2 | A | A | C | |||||||||||||||||||||||||||||||||||||||||||||||||||||||||||||||||||||||||||||||||||||||||||||||||||||||||||||||||||||||||||||||||||||||||||||||||||||||||||||||
| N.3 | A | A | ||||||||||||||||||||||||||||||||||||||||||||||||||||||||||||||||||||||||||||||||||||||||||||||||||||||||||||||||||||||||||||||||||||||||||||||||||||||||||||||||
| H.2.2 | A | A | G | |||||||||||||||||||||||||||||||||||||||||||||||||||||||||||||||||||||||||||||||||||||||||||||||||||||||||||||||||||||||||||||||||||||||||||||||||||||||||||||||
| La.2.1 | T | A | G | A | T | |||||||||||||||||||||||||||||||||||||||||||||||||||||||||||||||||||||||||||||||||||||||||||||||||||||||||||||||||||||||||||||||||||||||||||||||||||||||||||||
| P.1.1 | G | A | G | A | ||||||||||||||||||||||||||||||||||||||||||||||||||||||||||||||||||||||||||||||||||||||||||||||||||||||||||||||||||||||||||||||||||||||||||||||||||||||||||||||
| N.1.2 | A | A | G | A | C | G | A | G | T | T | C | A | A | C | A | T | G | G | G | C | C | C | C | T | G | T | T | G | ||||||||||||||||||||||||||||||||||||||||||||||||||||||||||||||||||||||||||||||||||||||||||||||||||||||||||||||||||||||||||||||||||||||
| Y.1.1 | A | A | G | A | C | G | A | G | T | T | C | A | A | C | A | T | G | G | G | C | C | C | C | T | G | T | T | G | ||||||||||||||||||||||||||||||||||||||||||||||||||||||||||||||||||||||||||||||||||||||||||||||||||||||||||||||||||||||||||||||||||||||
| Y.1.2 | A | A | A | G | T | T | A | A | C | A | T | G | G | C | C | C | T | T | ||||||||||||||||||||||||||||||||||||||||||||||||||||||||||||||||||||||||||||||||||||||||||||||||||||||||||||||||||||||||||||||||||||||||||||||||
| N.1.1 | A | A | G | A | A | A | T | G | A | T | A | G | C | A | T | G | C | T | G | C | G | T | T | |||||||||||||||||||||||||||||||||||||||||||||||||||||||||||||||||||||||||||||||||||||||||||||||||||||||||||||||||||||||||||||||||||||||||||
| Li.2.1 | A | A | G | A | A | A | T | A | A | T | A | C | A | T | T | G | C | T | G | C | G | T | T | |||||||||||||||||||||||||||||||||||||||||||||||||||||||||||||||||||||||||||||||||||||||||||||||||||||||||||||||||||||||||||||||||||||||||||
| H.1 | A | A | G | A | A | A | T | A | T | A | T | A | T | T | G | C | T | G | C | G | T | T | T | |||||||||||||||||||||||||||||||||||||||||||||||||||||||||||||||||||||||||||||||||||||||||||||||||||||||||||||||||||||||||||||||||||||||||||
| La.1 | A | A | G | A | A | A | T | A | T | A | A | C | T | G | G | C | T | G | C | G | T | T | T | |||||||||||||||||||||||||||||||||||||||||||||||||||||||||||||||||||||||||||||||||||||||||||||||||||||||||||||||||||||||||||||||||||||||||||
| J.1.2 | A | A | G | A | A | A | T | A | T | A | T | T | A | T | G | C | C | T | G | C | G | T | T | |||||||||||||||||||||||||||||||||||||||||||||||||||||||||||||||||||||||||||||||||||||||||||||||||||||||||||||||||||||||||||||||||||||||||||
| J.1.1 | A | A | G | A | A | A | T | G | A | T | A | G | A | T | G | C | T | G | C | G | T | T | ||||||||||||||||||||||||||||||||||||||||||||||||||||||||||||||||||||||||||||||||||||||||||||||||||||||||||||||||||||||||||||||||||||||||||||
| Li.2.2 | A | A | G | A | A | A | T | G | A | T | A | A | T | G | C | T | A | G | C | G | T | T | ||||||||||||||||||||||||||||||||||||||||||||||||||||||||||||||||||||||||||||||||||||||||||||||||||||||||||||||||||||||||||||||||||||||||||||
| N.2.1 | A | A | G | A | A | A | T | A | T | A | A | T | G | C | T | A | G | C | G | T | T | |||||||||||||||||||||||||||||||||||||||||||||||||||||||||||||||||||||||||||||||||||||||||||||||||||||||||||||||||||||||||||||||||||||||||||||
| Li.1.1 | T | A | A | G | A | A | A | T | A | A | T | G | C | T | G | C | G | T | T | |||||||||||||||||||||||||||||||||||||||||||||||||||||||||||||||||||||||||||||||||||||||||||||||||||||||||||||||||||||||||||||||||||||||||||||||
| N.2.2 | T | A | A | A | A | G | A | T | A | G | A | T | G | G | C | T | A | G | C | G | T | T | ||||||||||||||||||||||||||||||||||||||||||||||||||||||||||||||||||||||||||||||||||||||||||||||||||||||||||||||||||||||||||||||||||||||||||||
| P.1.2 | T | A | A | G | A | A | T | A | A | A | G | |||||||||||||||||||||||||||||||||||||||||||||||||||||||||||||||||||||||||||||||||||||||||||||||||||||||||||||||||||||||||||||||||||||||||||||||||||||||
| N.4.1 | A | A | G | T | C | T | G | A | G | T | C | G | T | A | C | T | G | |||||||||||||||||||||||||||||||||||||||||||||||||||||||||||||||||||||||||||||||||||||||||||||||||||||||||||||||||||||||||||||||||||||||||||||||||
| N.5.1 | A | T | G | A | A | T | T | G | C | A | A | A | G | G | T | T | G | T | T | T | G | A | G | G | G | A | A | A | T | G | C | A | G | G | T | A | G | C | C | T | A | A | A | T | C | T | T | C | A | G | T | C | A | T | G | T | A | T | G | A | C | G | C | G | C | T | G | G | C | A | C | A | C | T | T | G | T | C | T | G | T | C | T | G | T | A | G | G | T | G | G | T | G | T | C | T | G | A | G | T | C | G | T | A | C | T | G | |||||||||||||||||||||||||||||||||||||||||||||||||||||||
| N.5.2 | A | T | G | A | A | T | T | G | C | A | A | A | G | G | T | T | G | T | T | T | G | A | G | G | G | A | A | A | T | G | C | A | G | G | T | A | G | C | C | T | A | A | A | T | C | T | T | G | A | G | T | C | A | T | G | T | A | T | G | A | C | G | C | G | C | T | G | G | C | A | C | A | C | T | T | G | T | C | T | G | T | C | T | G | T | A | G | G | T | G | G | T | G | T | C | T | G | A | G | T | C | G | T | A | C | T | G | |||||||||||||||||||||||||||||||||||||||||||||||||||||||
| La.2.2 | A | T | G | A | A | T | T | G | C | A | A | A | G | G | T | T | G | T | T | T | G | A | G | G | G | A | A | A | T | G | A | G | G | T | A | G | C | C | T | A | A | A | T | C | T | G | A | G | T | C | A | T | G | T | A | T | G | A | C | G | C | G | C | T | G | G | G | C | A | C | A | C | T | T | G | T | C | T | G | T | C | T | G | T | A | G | G | T | G | G | T | G | T | C | T | G | A | G | T | C | G | T | A | C | T | G | ||||||||||||||||||||||||||||||||||||||||||||||||||||||||
| N.4.2 | T | G | A | A | T | T | G | C | A | A | A | G | G | T | T | G | T | T | T | G | A | G | G | G | A | A | A | T | G | A | G | G | T | A | G | C | C | T | A | A | A | T | C | T | G | A | G | T | C | A | T | G | T | A | T | G | A | C | G | C | G | C | T | G | G | C | A | C | A | C | T | T | G | G | T | C | T | G | T | C | T | G | T | A | G | G | T | G | G | T | G | T | C | T | G | A | G | T | C | G | T | A | C | T | G | |||||||||||||||||||||||||||||||||||||||||||||||||||||||||
Gene diversity (π) (see the “Material and Methods” section) for region A as a whole is 9.02 per kb, which is much larger than the average polymorphism of the human genome (0.8 per kb [Reich et al. 2002]) or the average of 5′ UTRs (0.3 per kb [Li 1997]). The high diversity is spread rather evenly across region A, since the three subregions A1, A2, and A3 all show a comparable level of variation (range 7.7–12.6 per kb; see table 3). The high level of polymorphism suggests balancing selection, which often leaves a signature on the frequency spectrum as well (Tajima 1989).
Table 3.
Level of Nucleotide Polymorphism in Regions A, B, and C
| Regiona | Length(bp) | π(×1,000) | θw(×1,000) |
| A: | |||
| Subregion A1 | 1,831 | 7.68 | 7.58 |
| Subregion A2 | 2,488 | 9.33 | 10.13 |
| Subregion A3 | 461 | 12.61 | 9.19 |
| Total region | 4,780 | 9.02 | 9.06 |
| B: | |||
| Exon | 246 | 30.14 | 22.00 |
| Intron | 466 | 2.66 | 3.31 |
| C: | |||
| Exon | 244 | 15.36 | 16.71 |
| Intron | 266 | 12.59 | 14.49 |
Regions shown in figure 1.
Figure 2 shows that the frequency spectrum of region A exhibits a pronounced excess of mutations with a frequency of 4 (4 occurrences in the sample of 25). Interestingly, almost all of the mutations with a frequency of 4 came from the sequences N.4.2, La.2.2, N.5.1, and N.5.2 (table 2). This pattern is evident in the genealogical tree of figure 3A. The tree is divided into two deep clades (clades I and II), and the divergence between the two clades is 2.31%, which is much larger than the average divergence between human and chimpanzee (1.24% [Chen and Li 2001]). If the latter are separated by 6 million years, the polymorphism should be >10 million years old. One naturally expects, and finds, the chimpanzee sequence to be embedded in the genealogical tree of figure 3A, rather than being an outgroup of human sequences. BLAST search of the complete human and chimpanzee genomic sequences has, indeed, confirmed that the two clades are not duplicated paralogous genes. (For both species, the published genomic data contain only the major allele.)
Figure 2.

Frequency spectrum of region A polymorphisms. A mutation of size i means that it occurs i times in our sample of 25 sequences (see the “Material and Methods” section). The thin line represents the expected frequency spectrum in neutral equilibrium, and the blackened bars denote the observed values.
Figure 3.

Phylogenies of different regions of DPA1 and DPB1. Bootstrap values >50% are shown on the nodes. Taxon names are composed of three parts separated by the dot symbol; the first two parts represent the sample identification, and the third part represents the allele. Panels A, B, and C correspond to regions A, B, and C in figure 1, respectively. In panel C, the matching of haplotypes with those in panel A cannot be completely ascertained. Hence, x and y are used in those cases, with x=1 and y=2 or vice versa (x=2 and y=1).
To show whether the old polymorphisms in region A (>10 million years old) are maintained as blocks, figure 4 presents the level of linkage disequilibrium (r2) between segregating sites. Indeed, r2 is close to 1 for many sites throughout region A (r2=1 means that the nucleotides at two different sites are completely correlated). Only one recombination, between sites 4091 and 4216, divides region A into two parts, resulting in an r2 of 0.762 between many sites of the two parts. (From table 2, we can conclude that the recombination took place on sequence N.4.1.) The permutation test for r2 shows statistical significance for all comparisons with r2=1 (P<.01) or r2=0.762 (P<.05). The 89 variant sites that divide the two clades account for 96% of the 4,065 comparisons with an r2 of 1 or 0.762. This observation corroborates the interpretation that recombination between the two clades is insignificant in the sequence evolution of this region. The absence of recombined sequences is not due to a reduction in crossovers in this region, because recombination appears suppressed only between and not within clades. In figure 5, we plot the values of |D′| as a function of physical distance between sites for sequences of clade I. |D′|=|D/Dmax| is <1 whenever there are recombinants in the sample. Recombination is evident in figure 5 between many pairs of variant sites among clade I sequences. Indeed, pairs of sites shown in figure 4 that fail to show significant linkage disequilibrium are exclusively caused by recombination within clades. A recent study also revealed a higher recombination rate in the DP region than in the rest of the HLA complex (Miretti et al. 2005). Therefore, the strong linkage disequilibrium between clade I and clade II haplotypes cannot be explained by a reduction in recombination.
Figure 4.

Linkage disequilibrium (r2) between all pairs of polymorphic sites in region A. Above diagonal, P values: P⩽.01 (black), .01<P⩽.05 (blue), and P>.05 (white). Below diagonal, r2 values: r2=1 (black), r2=0.7619 (blue), 0.5⩽r2<0.7619 (red), and r2<0.5 (white).
Figure 5.

Linkage disequilibrium, |D′|, within clade I
We also reconstructed the phylogenies of the three subregions A1, A2, and A3. All three phylogenies (fig. 6) appear nearly identical to the phylogeny in figure 3A, indicating that the deep divide between the two clades holds across the entire region A.
Figure 6.

Phylogenetic analysis of region A. The bootstrap values >50% were shown on the nodes. The taxon names are composed of three parts separated by the dot symbol; the first two parts represent the sample identification, and the third part represents the allele. A, DPB1 exon 1 and flanking intron 1 segment. B, Regulatory region. C, DPA1 exon 1 and flanking intron 1 segment.
To understand the distribution of this ancient polymorphism among human populations, we sequenced the A5 subregion (728 bp between positions 3540 and 4268) in 45 Lahu, 31 Han (the most common ethnicity in China), 47 European, and 7 African individuals. In addition, the A4 region (537 bp between positions 1640 and 2177) has been sequenced for the same 45 Lahu and 31 Han individuals. The A4 and A5 subregions include the 8 and 14 variants that define clade I and clade II, respectively. The two subregions are in complete linkage disequilibrium (table 4).
Table 4.
Polymorphism Patterns of Subregions A4 and A5 and DPA1 Exon 2[Note]
|
Subregion A4 |
Subregion A5 |
||||||||||||||||||||||
| Ethnic Groupand Sample ID | 1695 | 1709 | 1770 | 1793 | 1831 | 1968 | 2001 | 2068 | 3546 | 3600 | 3615 | 3653 | 3740 | 3796 | 3845 | 3876 | 3879 | 3998 | 4047 | 4172 | 4229 | 4237 | Alleles at DPA1 Exon 2(Region C) |
| Lahu: | |||||||||||||||||||||||
| La096 | A | G | G | C | A | G | A | A | A | A | A | C | G | A | A | C | A | A | C | C | C | T | 020202/020202 |
| La004 | A | G | G | C | A | G | A | A | A | A | A | C | G | A | A | C | A | A | C | C | C | T | 020101/020101 |
| La010 | A | G | G | C | A | G | A | A | A | A | A | C | G | A | A | C | A | A | C | C | C | T | 020201/020202 |
| La034 | A | G | G | C | A | G | A | A | A | A | A | C | G | A | A | C | A | A | C | C | C | T | 020202/020202 |
| La093 | A | G | G | C | A | G | A | A | A | A | A | C | G | A | A | C | A | A | C | C | C | T | 020202/020202 |
| La031 | A | G | G | C | A | G | A | A | A | A | A | C | G | A | A | C | A | A | C | C | C | T | 010301/030101 |
| La023 | A | G | G | C | A | G | A | A | A | A | A | C | G | A | A | C | A | A | C | C | C | T | 020202/020202 |
| La012 | A | G | G | C | A | G | A | A | A | A | A | C | G | A | A | C | A | A | C | C | C | T | 010301/010301 |
| La006 | A | G | G | C | A | G | A | A | A | A | A | C | G | A | A | C | A | A | C | C | C | T | 010301/010301 |
| La045 | A | G | G | C | A | G | A | A | A | A | A | C | G | A | A | C | A | A | C | C | C | T | 010301/010301 |
| La033 | A | G | G | C | A | G | A | A | A | A | A | C | G | A | A | C | A | A | C | C | C | T | 010301/010301 |
| La104 | A | G | G | C | A | G | A | A | A | A | A | C | G | A | A | C | A | A | C | C | C | T | 010301/020202 |
| La074 | A | G | G | C | A | G | A | A | A | A | A | C | G | A | A | C | A | A | C | C | C | T | 020201/020202 |
| La032 | A | G | G | C | A | G | A | A | A | A | A | C | G | A | A | C | A | A | C | C | C | T | 0106/020202 |
| La014 | A | G | G | C | A | G | A | A | A | A | A | C | G | A | A | C | A | A | C | C | C | T | 010301/010301 |
| La109 | A | G | G | C | A | G | A | A | A | A | A | C | G | A | A | C | A | A | C | C | C | T | 010301/020202 |
| La094 | A | G | G | C | A | G | A | A | A | A | A | C | G | A | A | C | A | A | C | C | C | T | |
| La097 | A | G | G | C | A | G | A | A | A | A | A | C | G | A | A | C | A | A | C | C | C | T | 010301/010301 |
| La049 | A | G | G | C | A | G | A | A | A | A | A | C | G | A | A | C | A | A | C | C | C | T | 010301/020202 |
| La036 | A | G | G | C | A | G | A | A | A | A | A | C | G | A | A | C | A | A | C | C | C | T | 010301/020202 |
| La035 | A | G | G | C | A | G | A | A | A | A | A | C | G | A | A | C | A | A | C | C | C | T | |
| La042 | R | R | R | Y | R | R | R | R | M | W | R | Y | R | R | R | Y | R | R | Y | S | Y | Y | 020202/0401 |
| La030 | R | R | R | Y | R | R | R | R | M | W | R | Y | R | R | R | Y | R | R | Y | S | Y | Y | 020202/0401 |
| La018 | R | R | R | Y | R | R | R | R | M | W | R | Y | R | R | R | Y | R | R | Y | S | Y | Y | 020202/020202 |
| La100 | R | R | R | Y | R | R | R | R | M | W | R | Y | R | R | R | Y | R | R | Y | S | Y | Y | 020202/0401 |
| La095 | R | R | R | Y | R | R | R | R | M | W | R | Y | R | R | R | Y | R | R | Y | S | Y | Y | 020202/0401 |
| La044 | R | R | R | Y | R | R | R | R | M | W | R | Y | R | R | R | Y | R | R | Y | S | Y | Y | 020202/0401 |
| La047 | R | R | R | Y | R | R | R | R | M | W | R | Y | R | R | R | Y | R | R | Y | S | Y | Y | 020202/0401 |
| La011 | R | R | R | Y | R | R | R | R | M | W | R | Y | R | R | R | Y | R | R | Y | S | Y | Y | 020202/0401 |
| La007 | R | R | R | Y | R | R | R | R | M | W | R | Y | R | R | R | Y | R | R | Y | S | Y | Y | 020202/0401 |
| La026 | R | R | R | Y | R | R | R | R | M | W | R | Y | R | R | R | Y | R | R | Y | S | Y | Y | 020202/0401 |
| La048 | R | R | R | Y | R | R | R | R | M | W | R | Y | R | R | R | Y | R | R | Y | S | Y | Y | 020202/0401 |
| La022 | R | R | R | Y | R | R | R | R | M | W | R | Y | R | R | R | Y | R | R | Y | S | Y | Y | 020202/0401 |
| La041 | R | R | R | Y | R | R | R | R | M | W | R | Y | R | R | R | Y | R | R | Y | S | Y | Y | |
| La099 | R | R | R | Y | R | R | R | R | M | W | R | Y | R | R | R | Y | R | R | Y | S | Y | Y | 010301/010301 |
| La106 | R | R | R | Y | R | R | R | R | M | W | R | Y | R | R | R | Y | R | R | Y | S | Y | Y | 010301/010301 |
| La025 | R | R | R | Y | R | R | R | R | M | W | R | Y | R | R | R | Y | R | R | Y | S | Y | Y | 010301/0401 |
| La038 | R | R | R | Y | R | R | R | R | M | W | R | Y | R | R | R | Y | R | R | Y | S | Y | Y | 010301/0401 |
| La050 | R | R | R | Y | R | R | R | R | M | W | R | Y | R | R | R | Y | R | R | Y | S | Y | Y | 010301/0401 |
| La265 | G | A | A | T | G | A | G | G | C | T | G | T | A | G | G | T | G | G | T | G | T | C | 0401/0401 |
| La098 | G | A | A | T | G | A | G | G | C | T | G | T | A | G | G | T | G | G | T | G | T | C | 0401/0401 |
| La102 | G | A | A | T | G | A | G | G | C | T | G | T | A | G | G | T | G | G | T | G | T | C | 0401/0401 |
| La019 | G | A | A | T | G | A | G | G | C | T | G | T | A | G | G | T | G | G | T | G | T | C | 0401/0401 |
| La075 | G | A | A | T | G | A | G | G | C | T | G | T | A | G | G | T | G | G | T | G | T | C | 0401/0401 |
| La029 | G | A | A | T | G | A | G | G | C | T | G | T | A | G | G | T | G | G | T | G | T | C | 0401/0401 |
| Han: | |||||||||||||||||||||||
| H077 | A | G | G | C | A | G | A | A | A | A | A | C | G | A | A | C | A | A | C | C | C | T | |
| H089 | A | G | G | C | A | G | A | A | A | A | A | C | G | A | A | C | A | A | C | C | C | T | |
| H098 | A | G | G | C | A | G | A | A | A | A | A | C | G | A | A | C | A | A | C | C | C | T | |
| H062 | A | G | G | C | A | G | A | A | A | A | A | C | G | A | A | C | A | A | C | C | C | T | |
| H095 | A | G | G | C | A | G | A | A | A | A | A | C | G | A | A | C | A | A | C | C | C | T | |
| H096 | A | G | G | C | A | G | A | A | A | A | A | C | G | A | A | C | A | A | C | C | C | T | |
| H078 | A | G | G | C | A | G | A | A | A | A | A | C | G | A | A | C | A | A | C | C | C | T | |
| H101 | A | G | G | C | A | G | A | A | A | A | A | C | G | A | A | C | A | A | C | C | C | T | |
| H068 | A | G | G | C | A | G | A | A | A | A | A | C | G | A | A | C | A | A | C | C | C | T | |
| H097 | A | G | G | C | A | G | A | A | A | A | A | C | G | A | A | C | A | A | C | C | C | T | |
| H084 | A | G | G | C | A | G | A | A | A | A | A | C | G | A | A | C | A | A | C | C | C | T | |
| H050 | A | G | G | C | A | G | A | A | A | A | A | C | G | A | A | C | A | A | C | C | C | T | |
| H051 | A | G | G | C | A | G | A | A | A | A | A | C | G | A | A | C | A | A | C | C | C | T | |
| H064 | A | G | G | C | A | G | A | A | A | A | A | C | G | A | A | C | A | A | C | C | C | T | |
| H072 | A | G | G | C | A | G | A | A | A | A | A | C | G | A | A | C | A | A | C | C | C | T | |
| H056 | A | G | G | C | A | G | A | A | A | A | A | C | G | A | A | C | A | A | C | C | C | T | |
| H061 | A | G | G | C | A | G | A | A | A | A | A | C | G | A | A | C | A | A | C | C | C | T | |
| H090 | A | G | G | C | A | G | A | A | A | A | A | C | G | A | A | C | A | A | C | C | C | T | |
| H103 | A | G | G | C | A | G | A | A | A | A | A | C | G | A | A | C | A | A | C | C | C | T | |
| H081 | A | G | G | C | A | G | A | A | A | A | A | C | G | A | A | C | A | A | C | C | C | T | |
| H102 | A | G | G | C | A | G | A | A | A | A | A | C | G | A | A | C | A | A | C | C | C | T | |
| H092 | A | G | G | C | A | G | A | A | A | A | A | C | G | A | A | C | A | A | C | C | C | T | |
| H075 | A | G | G | C | A | G | A | A | A | A | A | C | G | A | A | C | A | A | C | C | C | T | |
| H099 | A | G | G | C | A | G | A | A | A | A | A | C | G | A | A | C | A | A | C | C | C | T | |
| H086 | A | G | G | C | A | G | A | A | A | A | A | C | G | A | A | C | A | A | C | C | C | T | |
| H065 | A | G | G | C | A | G | A | A | A | A | A | C | G | A | A | C | A | A | C | C | C | T | |
| H057 | A | G | G | C | A | G | A | A | A | A | A | C | G | A | A | C | A | A | C | C | C | T | |
| H100 | A | G | G | C | A | G | A | A | A | A | A | C | G | A | A | C | A | A | C | C | C | T | |
| H088 | R | R | R | Y | R | R | R | R | M | W | R | Y | R | R | R | Y | R | R | Y | S | Y | Y | |
| H063 | R | R | R | Y | R | R | R | R | M | W | R | Y | R | R | R | Y | R | R | Y | S | Y | Y | |
| H091 | R | R | R | Y | R | R | R | R | M | W | R | Y | R | R | R | Y | R | R | Y | S | Y | Y | |
Note.— The haplotypes were estimated on the basis of the homozygotes. Both populations are in Hardy-Weinberg equilibrium with respect to the clade I and II haplotypes. From the Lahu samples, the individuals who are homozygous for clade II at region A are also homozygous at DPA1 exon 2 for DPA1*0401/*0401, and, except for three samples (La018, La099, and La106), all those heterozygous at region A are heterozygous for DPA1*0401 and another allele at region C. Hence, there is strong linkage between clade II haplotype in region A and the DPA1*0401 allele in region C. For polymorphism patterns, standard IUB/IUPAC nucleic acid codes were used (M = A or C; R = A or G; W = A or T; S = C or G; Y = C or T; K = G or T).
The observed frequencies of the clade II haplotype are 33.3% (30 of 90) and 4.83% (3 of 62) in the Lahu and Han populations, respectively. Both populations are in Hardy-Weinberg equilibrium with respect to the clade I and clade II haplotypes. Although the frequency of the clade II haplotype is low in Han Chinese, it may be even lower among Europeans or, perhaps, Africans. In fact, no clade II haplotype was found among 47 Europeans (0 of 94 sequences) and 7 Africans (0 of 14).
Using computer simulations, Wiuf et al. (2004) concluded that the size of a region affected by transspecific balancing selection acting on a single site is generally small. When transspecific polymorphism is observed, balancing selection acting on multiple sites should be suspected. For region A, there are two possible explanations for this large block of ancient polymorphism. First, there is strong coadaptation between exon 2 of DPA1 and exon 2 of DPB1 (i.e., regions B and C in fig. 1), such that the entire region shown in figure 1 is under balancing selection, which results in strong linkage disequilibrium across genes. Region A, located between two adjacent coding regions, thus “hitchhikes” on those regions. To address this hypothesis, we sequenced regions B and C shown in figure 1, which comprised exon 2 and adjacent intron segments of both DPA1 and DPB1.
For DPB1, the level of polymorphism (30 differences per kb) and the Ka/Ks value (0.0374/0.0232=1.61) are both high in the exons, possibly suggesting balancing selection. On the other hand, the adjacent segment of intron 1 has a dramatically reduced level of polymorphism (2.66 differences per kb), which suggests that recombination has eroded the association between intron 1 and exon 2 in DPB1. If that is the case, one would expect the genealogical pattern of region B to be very different from that of region A. The contrast between the phylogenies shown in figure 3A and 3B corroborates this prediction. In region A, four sequences (N.4.2, N.5.1, N.5.2, and La.2.2) cluster distantly from the rest, whereas, in region B (fig. 3B), six other sequences are grouped together. The aforementioned four sequences interdigitate with the rest in the bigger cluster. The dissociation between regions B and C can also be seen from the study of 15 populations, in which each of the populations harbors different recombinant haplotypes between the two regions (Begovich et al. 2001).
The decoupling between regions B and C effectively rules out the first hypothesis given above. The observation leads to a second hypothesis, that the regulatory region A itself is part of the system under balancing selection. The phylogenies of regions A and C (DPA1) are alike (fig. 3A and 3C). In region C, the four sequences that are distinct from the others in region A (N.4.2, N.5.1, N.5.2, and La.2.2) remain deeply divergent from the rest. The level of polymorphism in intron 1 of DPA1 is correspondingly high (12.59 differences per kb). Two recombination events between regions A and C moved two more sequences, N.4.1 and La.2.1, out of the main cluster (which includes N.2.2, Li.1.1, etc.). Overall, six sequences show transspecific polymorphism from the main cluster in region C. These six sequences themselves are partitioned into two distinct clades, because of several additional SNPs in this region.
There exists strong association between the clade II haplotype in region A and the DPA1*0401 allele in region C (table 4). The strong linkage disequilibrium between regions A and C suggests that the regulatory region and coding sequence of DPA1 may have interacted evolutionarily during the past 10 million years; otherwise, the linkage disequilibrium should have decayed with time, as it did between regions A and B. Finally, the strong linkage disequilibrium between regions A and C permits us to use a much larger sample of DPA1 coding sequences to corroborate our estimates of the worldwide frequencies of the two clades in figure 3A. Indeed, in a survey of 2,807 chromosomes from 15 populations, Begovich et al. (2001) found the minor allele to be ∼2%–5% among southeastern Asians and New Guineans and 0%–0.5% among whites and Japanese.
In this study, we surveyed the polymorphism in the joint regulatory region of DPA1 and DPB1 in ethnic Chinese populations. We inferred the operation of balancing selection and coadaptation between the regulatory and coding sequences in DPA1. We also observed the worldwide disappearance of this ancient polymorphism, except in isolated populations in southwestern China.
Balancing selection acting on the regulatory region of DPA1 may be understood in terms of its function in the immune system. Different haplotypes of the regulatory region may lead to differential expression among different cells or in different developmental stages. Many studies have revealed allelic-specific expression in DQB1, DQA1, and DRB genes (Louis et al. 1994; Beaty et al. 1995; Beaty and Nepom 1997; Fernandez et al. 2003; Ferstl et al. 2004). Expression levels in different antigen-presenting cells may also help to modulate the immune response by influencing the ratio of Th1 and Th2 responses (Baumgart et al. 1998), which are crucial for effective defense against pathogens. Extensive polymorphism in the coding region of MHC is maintained by balancing selection, partly because MHC products have different binding efficiencies to antigens. Different coding products may coadapt with different expression patterns. For this reason, the coding and regulatory regions of some MHC genes may evolve in concert, and the linkage disequilibrium between regions A and C can be understood in this light.
Given the antiquity of the polymorphism in region A (fig. 3), it is surprising that the frequency varies so much across populations. The frequency of the clade II allele is high in Lahu (33.3%) and likely in some other neighboring ethnicities, such as Naxi. The polymorphism is infrequent elsewhere in the world. Our results and those from a much larger sample (250 bp of DPA1 coding sequences [Begovich et al. 2001]) suggest that the clade II allele has a frequency of <5% in southeast Asia and is absent or nearly absent among whites and Japanese. What was the frequency of this polymorphism before the divergence of these modern human populations? In what follows, we shall suggest that the frequency in ancient times is not likely to have been <10%.
It is known that a balanced polymorphism with an equilibrium frequency of <10% can be easily lost, unless selection is very strong (Crow and Kimura 1970). Since the polymorphism is older than the divergence between human and chimpanzee, it probably originated ∼1 million generations (∼10 million years) ago. If we assume the fitness for the three genotypes I/I, I/II, and II/II is 1-s, 1, and 1-t, respectively, then the equilibrium frequency of allele II is q=s/(s+t). When q=0.05, t=19s. By computer simulations, we have determined the 95% upper limit of the retention time of the polymorphism for various s and t values in a finite population of 10,000 (roughly the effective size of ancient humans). For t as large as 0.1, the retention time is still far short of 1 million generations. The long-term equilibrium value of allele II is therefore unlikely to be as low as 5%.
If the long-term equilibrium frequency of allele II is substantially >5%, then this frequency must have decreased in most populations worldwide. The loss of balanced polymorphism in larger populations while it is retained in isolated smaller groups is contrary to the prediction of genetic drift. Indeed, the balanced polymorphism at the neighboring DPB1 locus (region B in fig. 1) (Begovich et al. 2001) follows this prediction quite well; the worldwide frequencies range from 0.2 to 0.7, and the Amerindians of Mexico are the only groups known to have lost this DPB1 polymorphism. The polymorphism pattern of DPA1 therefore suggests selection accompanied by changes in environment to be the main reason for the loss. After all, human populations have generally experienced drastic changes in their environments, because of emigration, agriculture, increased population density, and associated pathogens, in the past 100,000 years.
Although there have been observations of alleles with unusually high frequency among ethnicities with a small population (Wang et al. 2003; Garrigan et al. 2005), DPA1 is an unusually ancient polymorphism maintained by balancing selection over a long period of time but is currently observable in only a few isolated populations. It has often been suggested that isolated small populations may contribute disproportionately to total human diversity. The DPA1 regulatory polymorphism provides such an example.
Acknowledgments
We thank C. Ober, for the European DNA samples, and D. Turissini, for his comments. The research was supported by Outstanding Young Scientist Award 39725007, projects 30178073 and 30100275 and key project 69935020 of the National Natural Science Foundation of China, key project 021691 of the Guangdong Natural Science Foundation, project 2001AA224021-04 of the State High-Tech Development Project of the Ministry of Science and Technology (to A.X.), and National Institutes of Health grants GM063144 and GM58686 (to C.-I.W.). C.-I.W. also thanks the National Natural Science Foundation of China.
Web Resources
Accession numbers and URLs for data presented herein are as follows:
- GenBank, http://www.ncbi.nlm.nih.gov/Genbank/ (for accession numbers AY335526–AY335544 and AY603382–AY603395)
- Online Mendelian Inheritance in Man (OMIM), http://www.ncbi.nlm.nih.gov/Omim/ (for HLA-DPA1 and HLA-DPB1)
- UCSC Genome Bioinformatics, http://genome.ucsc.edu/
References
- Baumgart M, Moos V, Schuhbauer D, Muller B (1998) Differential expression of major histocompatibility complex class II genes on murine macrophages associated with T cell cytokine profile and protective/suppressive effects. Proc Natl Acad Sci USA 95:6936–6940 10.1073/pnas.95.12.6936 [DOI] [PMC free article] [PubMed] [Google Scholar]
- Beaty JS, Nepom GT (1997) Allele-specific transcriptional control of HLA-DQB1 is cell-type dependent. In: Charron D (ed) HLA: genetic diversity of HLA functional and medical implication. Vol II. EDK, Paris, pp 307–309 [Google Scholar]
- Beaty JS, West KA, Nepom GT (1995) Functional effects of a natural polymorphism in the transcriptional regulatory sequence of HLA-DQB1. Mol Cell Biol 15:4771–4782 [DOI] [PMC free article] [PubMed] [Google Scholar]
- Begovich AB, Moonsamy PV, Mack SJ, Barcellos LF, Steiner LL, Grams S, Suraj-Baker V, Hollenbach J, Trachtenberg E, Louie L, Zimmerman P, Hill AV, Stoneking M, Sasazuki T, Konenkov VI, Sartakova ML, Titanji VP, Rickards O, Klitz W (2001) Genetic variability and linkage disequilibrium within the HLA-DP region: analysis of 15 different populations. Tissue Antigens 57:424–439 10.1034/j.1399-0039.2001.057005424.x [DOI] [PubMed] [Google Scholar]
- Cavalli-Sforza LL, Menozzi P, Piazza A (1996) The history and geography of human genes. Princeton University Press, Princeton [Google Scholar]
- Chen FC, Li WH (2001) Genomic divergences between humans and other hominoids and the effective population size of the common ancestor of humans and chimpanzees. Am J Hum Genet 68:444–456 [DOI] [PMC free article] [PubMed] [Google Scholar]
- Chen Y (1989) The geographical records [in Chinese]. Yunnan People’s Publishing House, Kunming, China [Google Scholar]
- Cowell LG, Kepler TB, Janitz M, Lauster R, Mitchison NA (1998) The distribution of variation in regulatory gene segments, as present in MHC class II promoters. Genome Res 8:124–134 [DOI] [PubMed] [Google Scholar]
- Crow JF, Kimura M (1970) An introduction to population genetics theory. Harper & Row, New York [Google Scholar]
- Fernandez S, Wassmuth R, Knerr I, Frank C, Haas JP (2003) Relative quantification of HLA-DRA1 and -DQA1 expression by real-time reverse transcriptase-polymerase chain reaction (RT-PCR). Eur J Immunogenet 30:141–148 10.1046/j.1365-2370.2003.00376.x [DOI] [PubMed] [Google Scholar]
- Ferstl B, Zacher T, Lauer B, Blagitko-Dorfs N, Carl A, Wassmuth R (2004) Allele-specific quantification of HLA-DQB1 gene expression by real-time reverse transcriptase-polymerase chain reaction. Genes Immun 5:405–416 10.1038/sj.gene.6364108 [DOI] [PubMed] [Google Scholar]
- Fu Y, Liu Z, Lin J, Jia Z, Chen W, Pan D, Liu Y, Zhu Y, Chen R, Xu A (2003) HLA-DRB1, DQB1 and DPB1 polymorphism in the Naxi ethnic group of south-western China. Tissue Antigens 61:179–183 [DOI] [PubMed] [Google Scholar]
- Fu YX (1994) Estimating effective population size or mutation rate using the frequencies of mutations of various classes in a sample of DNA sequences. Genetics 138:1375–1386 [DOI] [PMC free article] [PubMed] [Google Scholar]
- Garrigan D, Mobasher Z, Severson T, Wilder JA, Hammer MF (2005) Evidence for archaic Asian ancestry on the human X chromosome. Mol Biol Evol 22:189–192 10.1093/molbev/msi013 [DOI] [PubMed] [Google Scholar]
- Hughes AL, Yeager M (1998) Natural selection at major histocompatibility complex loci of vertebrates. Annu Rev Genet 32:415–435 10.1146/annurev.genet.32.1.415 [DOI] [PubMed] [Google Scholar]
- Kumar S, Tamura K, Jakobsen IB, Nei M (2001) MEGA2: molecular evolutionary genetics analysis software. Tempe, AZ [DOI] [PubMed] [Google Scholar]
- Li WH (1993) Unbiased estimation of the rates of synonymous and nonsynonymous substitution. J Mol Evol 36:96–99 [DOI] [PubMed] [Google Scholar]
- ——— (1997) Molecular evolution. Sinauer Associates, Sunderland, MA [Google Scholar]
- Louis P, Vincent R, Cavadore P, Clot J, Eliaou JF (1994) Differential transcriptional activities of HLA-DR genes in the various haplotypes. J Immunol 153:5059–5067 [PubMed] [Google Scholar]
- Miretti MM, Walsh EC, Ke X, Delgado M, Griffiths M, Hunt S, Morrison J, Whittaker P, Lander ES, Cardon LR, Bentley DR, Rioux JD, Beck S, Deloukas P (2005) A high-resolution linkage-disequilibrium map of the human major histocompatibility complex and first generation of tag single-nucleotide polymorphisms. Am J Hum Genet 76:634–646 [DOI] [PMC free article] [PubMed] [Google Scholar]
- Mitchison NA, Roes J (2002) Patterned variation in murine MHC promoters. Proc Natl Acad Sci USA 99:10561–10566 10.1073/pnas.152329999 [DOI] [PMC free article] [PubMed] [Google Scholar]
- Pamilo P, Bianchi NO (1993) Evolution of the Zfx and Zfy genes: rates and interdependence between the genes. Mol Biol Evol 10:271–281 [DOI] [PubMed] [Google Scholar]
- R Development Core Team (2005) R: a language and environment for statistical computing. R Foundation for Statistical Computing, Vienna, Austria (http://www.r-project.org)
- Reich DE, Schaffner SF, Daly MJ, McVean G, Mullikin JC, Higgins JM, Richter DJ, Lander ES, Altshuler D (2002) Human genome sequence variation and the influence of gene history, mutation and recombination. Nat Genet 32:135–142 10.1038/ng947 [DOI] [PubMed] [Google Scholar]
- Rozas J, Rozas R (1999) DnaSP version 3: an integrated program for molecular population genetics and molecular evolution analysis. Bioinformatics 15:174–175 10.1093/bioinformatics/15.2.174 [DOI] [PubMed] [Google Scholar]
- Rozemuller EH, Bouwens AG, Bast BE, Tilanus MG (1993) Assignment of HLA-DPB alleles by computerized matching based upon sequence data. Hum Immunol 37:207–212 10.1016/0198-8859(93)90503-S [DOI] [PubMed] [Google Scholar]
- Stefansson H, Helgason A, Thorleifsson G, Steinthorsdottir V, Masson G, Barnard J, Baker A, et al (2005) A common inversion under selection in Europeans. Nat Genet 37:129–137 10.1038/ng1508 [DOI] [PubMed] [Google Scholar]
- Tajima F (1989) Statistical method for testing the neutral mutation hypothesis by DNA polymorphism. Genetics 123:585–595 [DOI] [PMC free article] [PubMed] [Google Scholar]
- Trowsdale M (1996) Molecular genetics of HLA class I and class II regions. In: Browning MB, McMichael A (eds) HLA and MHC: genes, molecules and function. BIOS Scientific Publishers, Oxford, pp 23–36, 329–351 [Google Scholar]
- Versluis LF, Rozemuller E, Tonks S, Marsh SG, Bouwens AG, Bodmer JG, Tilanus MG (1993) High-resolution HLA-DPB typing based upon computerized analysis of data obtained by fluorescent sequencing of the amplified polymorphic exon 2. Hum Immunol 38:277–283 10.1016/0198-8859(93)90555-F [DOI] [PubMed] [Google Scholar]
- Wang HY, Tang H, Shen CK, Wu CI (2003) Rapidly evolving genes in human. I. The glycophorins and their possible role in evading malaria parasites. Mol Biol Evol 20:1795–1804 10.1093/molbev/msg185 [DOI] [PubMed] [Google Scholar]
- Wiuf C, Zhao K, Innan H, Nordborg M (2004) The probability and chromosomal extent of trans-specific polymorphism. Genetics 168:2363–2372 10.1534/genetics.104.029488 [DOI] [PMC free article] [PubMed] [Google Scholar]