Abstract
The breakage of fluorescence-labeled microtubules under irradiation of excitation light is found in our experiments. Its mechanism is studied. The results indicate that free radicals are the main reason for the photosensitive breakage. Furthermore, the mechanical properties of the microtubules are probed with a dual-optical tweezers system. It is found that the fluorescence-labeled microtubules are much easier to extend compared with those without fluorescence. Such microtubules can be extended by 30%, and the force for breaking them up is only several piconewtons. In addition, we find that the breakup of the protofilaments is not simultaneous but step-by-step, which further confirms that the interaction between protofilaments is fairly weak.
INTRODUCTION
Microtubules (MTs), one of the major components of the cytoskeleton in eukaryotic cells, play vital roles in many biological processes such as intracellular transport and cell division. MTs are made up of 13 parallel joined protofilaments which are polymerized by α-β-tubulin dimers. Their small (25 nm) diameter is beyond the resolution of an ordinary optical microscope. Although immuofluorescence methods provide good means to observe the MTs in cells, it is not applicable for studies of MTs in living cells. Tubulins, tagged with fluorescent dyes or fluorescent fusion proteins, have now been widely employed in studies of MTs in living cells. This research strategy has made an important contribution to our knowledge about the dynamics and functions of MTs.
Such methods have inevitable advantages in studies of MTs in living cells, however, it is reported that fluorescent MTs may break up under irradiation. Vigers et al. (1) first observed breakage of fluorescent MTs under irradiation both in vivo and in vitro. Dixit and Cyr (2) demonstrated that tobacco suspension cells were damaged when the MTs were visualized by transforming an intrinsically fluorescent protein. Photodynamic therapy, developed in recent years, is a new treatment for cancers. It is based on the characteristic of some photosensitizers to be retained preferentially in tumor cells. The products of photosensitizers may destroy tumor cells when cells are exposed to appropriate light. It has been reported that these photosensitizers could destroy MTs (3–5). However the mechanism remains elusive.
There have been many reports about the dynamic characteristics of unlabeled MTs in recent years. de Pablo et al. (6) probed the local mechanical properties of MTs at the nanometer scale by radial indentation with a scanning force microscope tip. Kerssemakers et al. (7) measured assembly force of MTs with multiple optical traps. But few reports are focused on the dynamic characteristics of labeled MTs. Up to now, in most studies of biological functions MTs have been labeled by different dyes. Therefore, studies on the dynamic characteristics of labeled MTs may offer a reasonable explanation for related experimental results of labeled MTs.
In this work, we investigate the breakage phenomenon of fluorescent MTs under different light wavelengths and different treatments. The results demonstrate that the fluorescent dye plays a key role in the breakage of fluorescent MTs, and free radicals produced by the photochemical reaction between fluorescent dye and excitation light are the main factors for the fluorescent MT breakage. Moreover, the dynamic process of fluorescent MT breakage is studied with dual-beam optical tweezers.
MATERIALS AND METHODS
Preparation of fluorescent MTs
Porcine brain tubulin is purified according to the method in Castoldi and Popov (8). 5(and-6)carboxytetra-methyl-rhodamine succinimidyl ester (NHS-Rhodamine)-labeled tubulin is prepared by the method mentioned in Keating et al. (9). Both NHS-Rhodamine and NHS-biotin can be connected to the tubulin. Labeled tubulin is diluted with polymerization buffer (0.1 mol/L 1,4-piperazinediethanesulfonic acid (PIPES), 1 mmol/L guanosine triphosphate, 1 mmol/L MgSO4, 1 mmol/L ethylene glycol-bis(2-amino-ethylether)-N,N,N′,N′,-tetra-acetic acid (EGTA), 10% dimethyl sulfoxide (DMSO), pH 6.9) to a final concentration of 10 μmol/L and incubated at 35°C for 30–60 min. Then we add 5× volume of PEMT (0.1 mol/L PIPES, 1 mmol/L EGTA, 1 mmol/L MgSO4, 10 μmol/L taxol, 10% DMSO, pH 6.9) to the solution and centrifuge at 25,000 × g at 35°C for 30 min. The pellets are resuspended gently with 5× volume of PEMT.
Optical tweezers design and calibration
The dual-beam optical tweezers system consists mainly of an inverted light microscope (Leica DMIRB, Wetzlar, Germany) and an Nd-YVO4 laser (1064 nm, Coherent, Santa Clara, CA) with 4 W power in continuous TEM-00 mode. Two traps are produced by splitting the laser beam using a half-wave plate (λ/2) followed by a polarizing beam splitter. Two parallel laser beams enter the back aperture of the microscope objective (HCXAPO 100×, 1.30 numerical aperture, oil immersion) and are focused at the specimen, forming dual-beam optical traps. One trap can be moved in the x, y plane by rotating a mirror driven by direct current motors (Newport, LTA-HL Actuator), whereas the other is fixed. A quadrant photodiode detector (QD) is used for measuring the displacement of the bead in the fixed trap and a high-resolution cooled charge-coupled device (CCD) camera (CoolSNAP-fx, Tuscon, AZ) is used for acquiring the whole image of the trapped beads and MT. The stiffness of both traps is calibrated by fluid flow, i.e., Stokes law  (η = viscosity, r = bead radius, v = velocity of the flowing fluid) is adopted. The stiffness of both optical traps is 0.042 pN/nm when the power of each beam measured in the front of the objective back aperture is 160 mW.
Experimental procedure
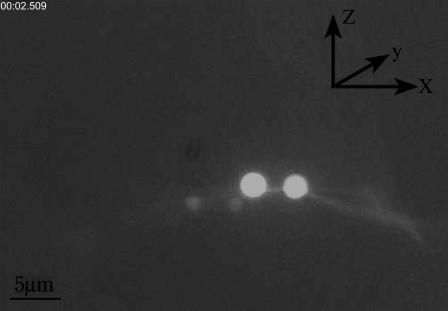
To study the breakage process of fluorescent MTs, 3% bovine serum albumin (BSA) is added to the sample cell and kept for 2 ∼ 3 h before experiment to prevent the attachment of MTs and beads to the bottom of the sample cell. NHS-Rhodamine and NHS-biotin-labeled MTs are diluted by PEMT and then mixed with 1 μm NeutrAvidin-coated fluorescent beads (Molecular Probes, Eugene, OR). After this process, no MT bundles have been observed, which indicates that BSA does not affect the MT. In addition, 8 mmol/L ascorbic acid is added to prevent the MTs from breaking spontaneously. The tubulin-labeling ratio is 57%, and intensity of the excitation light is 100% in the experiment. The adhesion of two beads and one MT, shown in Fig. 1, is performed as follows. First, each of the traps holds one bead, and then we move the stage along the y axis to make an MT attach laterally to the surfaces of two trapped beads. Due to the specific adhesion between biotin and NeutrAvidin, a stable combination between the MT and beads is formed. The adhesion takes ∼15 s. As long as the adhesion is achieved, we move the movable trap toward the left direction along the x axis with a velocity of 158 nm/s. At the same time, the QD detects the displacements of the bead from the fixed trap center in both the x and y directions. And CCD acquires a series of images which show the variations of two trapped beads and attached MT. The tensile force acting on MTs can be extracted from the x direction displacement of right bead, and the change of MT's length can be determined from the serial images acquired by CCD.
FIGURE 1.
Fluorescence image of adhesive beads and MT, in which x, y plane and z axis denote horizontal plane and vertical direction, respectively.
Data analysis
The fluorescent MTs are illuminated by a 50 W mercury arc lamp. A series of pictures is acquired by a high-resolution cooled CCD camera and then recorded on a PC using the software MetaCam (Universal Imaging, Downington, PA). The breaking time is an average time, which averages the times of the first 10 breakages of the MTs in a field of ∼50 MTs. The criterion for judging the breakage of MT is that the MT breaks at least into two pieces under the resolution of our system.
Displacement of the bead from the fixed trap center, and consequently the force exerted by the trap on the displaced bead, are directly proportional to the movement of the bead image projected onto the surface of QD. The output currents from the four quadrants of the photodiodes are converted to voltages and the four voltages are combined to yield two voltages, which are proportional to the forces in the x and y directions, respectively. These signals are digitized at 1 K samples/s using a PC via an analog-to-digital converter board. The voltage signal produced by the photodiode is calibrated in displacement units by scanning the QD against the trapped bead image. In our experiment, this parameter is 4.5 mV/nm.
The MT length in the experiments is defined as the distance between two trapped beads since change in MT length only happens between two beads. The distance between two trapped beads is calculated by the intensity weighted centroid of bead images (10). We acquire a series of two trapped bead images then calculate their intensity weighted centroids. In doing so, the changes in MT length can be known according to the changes of bead positions.
RESULTS
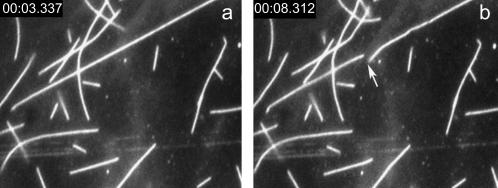
In our experiments, it is found that the fluorescence-labeled MTs break up when exposed to the excitation light as shown in Fig. 2. To know the mechanism of breakage, we carry out a series of experiments systematically. First, we take a He-Ne laser (632.8 nm, 17 mW) as light source because it has much higher energy than the excitation light and can be well absorbed by organisms (11). When the fluorescent MTs are exposed to the He-Ne laser for 5–10 min, no obvious breakage is detected. Then we take a Na lamp (589 nm) as light source, whose wavelength is close to that of the emission light of rhodamine; the result is the same as using the He-Ne laser. These indicate that the reason for the breakage of MTs is not the energy itself of light, so it occurs to us that the excitation light and dye together cause the breakage of MTs. Because it is difficult to observe individual unlabeled MTs with our optical microscope, we add 0.4 μmol/L AtMAP65-1, an MT bundling protein (12), to bundle MTs so that they can be seen. It is found that no breakage phenomena are detected when the unlabeled bundles are exposed to the excitation light. On the contrary, fluorescence-labeled MT bundles collapse immediately after irradiation. This further confirms that the breakage results from the interaction between the dye and excitation light.
FIGURE 2.
Pictures of fluorescent MTs. The time tags in the pictures indicate the time (minute:second:millisecond) of picture acquiring. In our experiments, the picture acquiring is before the irradiation of MT to measure the breaking time of MT precisely. (a) The fluorescent MTs just after the irradiation of excitation light. (b) The MTs after exposing to excitation light for 5 min. The arrow in the figure shows the site of breakage.
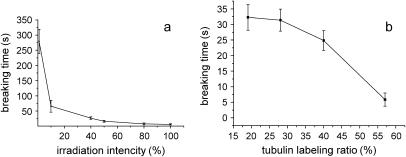
To investigate the dependence of MT cleavage on excitation light and fluorescent dye, the effect of different excitation light intensity and tubulin-labeling ratio on the breaking time is studied in detail. Fig. 3 a shows the relationship between MT breaking time and excitation light intensity. Here we take the maximally available intensity as 100% (corresponding to 50 W of mercury lamp) and the tubulin-labeling ratio is 57% in the experiment. The average of the first 10 MT breaking times is set as the breaking time. It can be seen from this figure that the breakage of MTs becomes slow with the decrease of light intensity. When the excitation light is attenuated to 1%, the breaking time is prolonged to 280 s, ∼50 times longer than that without attenuation. Fig. 3 b shows the relation between breaking time and tubulin-labeling ratio. Tubulin-labeling ratios are adjusted to 19%, 28%, 40%, and 57%, respectively, by mixing the labeled and unlabeled tubulins and the intensity of excitation light is 100% in this experiment. The labeling ratios in our experiment cover the range that is usually adopted in the study of mitosis in living cells (13). The result shows that the lower the labeling ratio of tubulins is the more slowly the MTs break up.
FIGURE 3.
Dependence of MT breaking time on the excitation light intensity (a) and tubulin-labeling ratio (b).
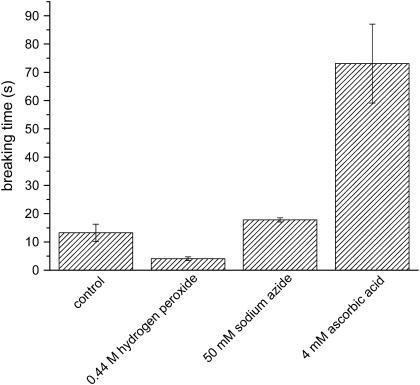
Since the breakage of the MTs is closely related to the excitation light and fluorescent dye, it is easy to think that the photochemical reaction may happen between them. Photochemical reactions usually produce reactive oxygen species (ROS). They can cause great damage to biomolecules. To probe the exact source that results in the breakage of the MTs, the sample is treated with different reagents as shown in Fig. 4. In this experiment, the intensity of excitation light is 50% and the tubulin-labeling ratio is 57%. Hydrogen peroxide is one of ROS. When added with 0.44 mol/L hydrogen peroxide, no MT breakage occurs before the illumination with excitation light, whereas the MTs break up in a much shorter time (within 5 s) than untreated ones (control) once irradiated. When hydrogen peroxide is decomposed by catalase (0.5 mg/mL), the breaking time becomes longer, but still shorter than the control. This result indicates that the hydrogen peroxide can accelerate the breakage of the MTs. We suppose that hydrogen peroxide may supply a substrate for photochemical reactions. Adding hydrogen peroxide will help to accelerate the photochemical reaction. Even if the hydrogen peroxide is decomposed by catalase, the breakage is still more severe than control. This may be caused in the following manner. The decomposition of hydrogen peroxide leads to the increase of O2 concentration in the buffer, and O2 can act as a substrate for the photochemical reactions too. To confirm the role of O2, we remove the dissolved O2 by continuously injecting N2 into the buffer for ∼30 min. The breakage slows down obviously. Further, it is found that when 50 mmol/L sodium azide is added the breakage is postponed to 15 s and after that MTs break up quickly. It has been verified that sodium azide mainly quenches singlet oxygen (14). Therefore, the above fact means that although singlet oxygen has contributions to the breakage, it is not the major source that induces the breakage of the MTs. It is well known that ascorbic acid can remove free radicals. To examine if the free radicals exist in the sample cell, we put a small amount of ascorbic acid into the cell and found that 4 mmol/L ascorbic acid delays the breaking time to ∼60–70 s (Fig. 3). With the addition of 8 mmol/L ascorbic acid, slight photobleaching can be seen but no breakage of the MTs is detected for 3 min. After 6 min, there is still no breakage of the MTs although the fluorescence is totally bleached. This indicates that free radicals are the major components that cause the photodamage of fluorescent MTs.
FIGURE 4.
Acceleration or deceleration of MT breakage by hydrogen peroxide or ROS removers. A total of 0.44 mol/L hydrogen peroxide accelerates the MT breakage, whereas 50 mmol/L sodium azide and 4 mmol/L ascorbic acid slows it down. Ascorbic acid is more effective in preventing MTs from breaking. Fluorescent MTs in PEMT without addition of other reagents is as control.
Moreover, when the MTs are heated to 56°C and kept for 5 min or fixed with glutaraldehyde (1%), there is no MT breakage detected. It is known that hyperthermia can make MTs irreversibly denatured, and inactive MTs become more insensitive to the change of exterior environment such as toxin. However, the mechanism of the hyperthermal effect on stabling MTs is still unclear and needs further investigation. Glutaraldehyde can make tubulins cross-link covalently. It is reported that the cross-linking is sufficient to stabilize the gross structure of the MTs against air drying or a distilled water challenge (15). No breakage phenomenon after the fixation with glutaraldehyde indicates that free radicals are not strong enough to disrupt the covalent connection. This gives indirect proof that free radicals only induce the disconnection of the noncovalent bond. In MT structure formation, all the interactions between protofilament-protofilament, dimer-dimer, and α-tubulin–β-tubulin are hydrophobic bonds which are closely related to the conformation of tubulin. Therefore, the conclusion is that the breakage resulting from the attack of free radicals may be attributes to the change of the tubulin's conformation.
To know the dynamics of the breakage, the mechanical properties of the MTs are studied with a dual-optical tweezers system. First of all, a “dumbbell” structure is formed with two beads and one MT. This process takes ∼15 s, i.e., the MT is exposed to the fluorescent excitation ∼15 s before the following stretching experiment. When we move the left trap away from the fixed one, the MT begins to be extended and the tensile force increases with the elongation of the MT. When the force exceeds a maximum value that the MT can endure, the MT is broken up, as shown in Fig. 5.
FIGURE 5.
Fluorescence image shows the broken MT under external force on it.
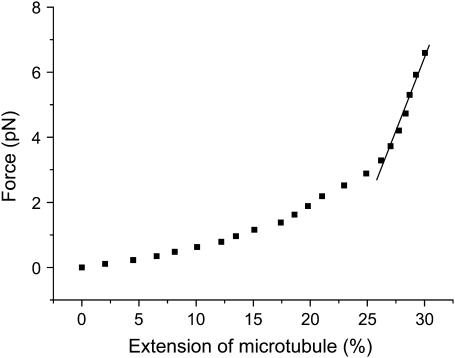
Fig. 6 shows the dependence of tensile force on the extension. The initial length of the MT is 2.85 μm in this experiment. It can be seen that the force-versus-extension curve is highly nonlinear and the extension is ∼30% of the original length. When the tensile force reaches 6.59 pN, the MT breaks up. Moreover, this curve indicates that the MT is not a linear elastomer. To estimate the Young's modulus we make a linear fit in the steepest ascent part of the curve. The calculated Young's modulus is 0.29 MPa when the external and internal diameters of the MT are taken as 25 nm and 15 nm, respectively. This measured value is three orders of magnitude smaller than that measured by Kis et al. (16) using atomic force microscopy (AFM) under the condition that the MT is free of fluorescence. Additionally, the persistence length Lp can be obtained according to the equation
 |
where Y is Young's modulus, l is the moment of inertia of the cross section, KB is Boltzmann's constant, and T is temperature. When the temperature is 25°C, the calculated persistence length of the fluorescent MT is 1.2 μm, which is also three orders of magnitude smaller than that measured by Gittes et al. (17) by means of direct microscopic observation of the thermal fluctuations of MTs. All these results indicate that the MTs labeled with fluorescence are more flexible and easier to be stretched than that without labeling.
FIGURE 6.
Force versus extension of MT. The dotted line is the experiment result, and the solid line is the linear fit in the steepest ascent part of the curve.
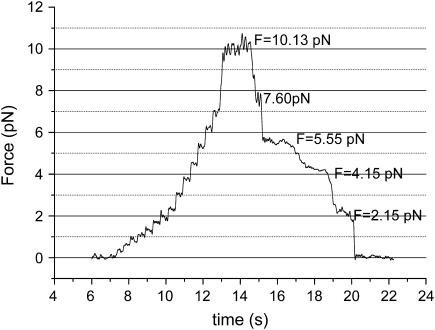
To know how the MT is broken and if the cleavage of the 13 protofilaments, which constitute MT by joining laterally, are simultaneous or not, we detect the process of breakup under an external force acting on it. First, we exert several piconewtons of force on the MT as shown in Fig. 7, then observe the change of the force, from which the process of breakup can be revealed. Fig. 7 is one of the representative results. In this experiment, the initial force is 10.13 pN, under which the MT is extended, then the force decreases step by step and each step is ∼2 pN. This means that the breakage of the 13 protofilaments is not simultaneous but one-by-one. If protofilaments' cleavages happen at the same moment, the force should immediately drop to zero, rather than gradually decreases. Furthermore, the nearly even step (2.03 ± 0.41 pN) indicates that each protofilament can stand ∼2 pN force.
FIGURE 7.
Breakup process of fluorescent MTs.
DISCUSSION
We have shown that the fluorescently labeled MTs are easy to break up and the treatment with different reagents has great effect on the breakage. Ascorbic acid has proved to be very useful for blocking the breakage. Vigers et al. (1) have done similar work on the breakage of MTs. However, the emphasis is a little different. Their studies focus mainly on breakage phenomenon both in vivo and in vitro, whereas our aim is to find the reason for the breakage. Therefore, different light sources and reagents are employed to find the reason for the breakage. Moreover, the addition of optical tweezers experiments gives further information about change in MT structure from the mechanical point of view.
For nonfluorescence MTs the breaking force is very large and MTs are hardly elongated. However, when fluorescent MTs are exposed to excitation light, they become more flexible and easier to extend. The mechanism for elongation and breakage of fluorescent MTs may be qualitatively understood as follows. There are some kinds of photochemical reactions between fluorescent dyes and excitation light. Free radicals produced by these reactions may cause some conformational changes of MTs, which will result in the decrease of interactions between tubulin-tubulin, dimer-dimer, and protofilament-protofilament. Previous investigations have proved that the interaction between protofilaments is much smaller than that between the others (18). In addition, the taxol, which is added in sample cell to keep MT stable, can reduce the interactions between protofilaments (19), so each protofilament of MT can be seen as an individual component. Because not each tubulin is tagged with a dye molecule, the damage position caused by ROS may be random. When the MT is pulled, some protofilament will break up first at the damaged site, so that the other unbroken protofilaments will be extended to balance the external force, such a process is repeated until all the protofilaments break up. Besides, the ladder-like breakage of the MT further proves that under the current experimental conditions, the interaction between protofilaments is very weak. The breaking force measured in our experiments is much smaller than that measured by de Pablo et al. (6). The reason for this big difference is that, on one hand, the fluorescent MTs become more fragile indeed, on the other hand, two different methods might cause this outcome. We measure the breaking force by stretching MT, whereas they measured it by radial indentation with a scanning force microscope tip. Theoretically speaking, the force for breaking MT by radially indenting is smaller than that by stretching MT because the shear modulus of MT is two orders of magnitude lower than the Young's (16). Therefore, breaking unlabeled MT by stretching needs a much larger force than that which de Pablo et al. used. Obviously, this difference cannot account for the force difference in two methods. Moreover, it has been reported that the force-loading rate plays a key role in unbinding protein-protein interactions and the detachment force is proportional to the force-loading rate, i.e., F ∝ ln RF (20). The loading rate for AFM is usually on the order of nN/s, nevertheless it is on the scale of pN/s for optical tweezers. For example, the loading rate in our experiments is ∼7 pN/s. Such a big difference in loading rate may be what causes the force difference in two methods. Altogether, it is difficult to conclude what the major reason is for this big difference in breaking force measurement. However, as far as Young's modulus is concerned, it should be an intrinsic property of material. When taking measurement error into account, it should be independent of the method one adopts. However, due to the complexity of the system which consists of MT and beads, series compliance should be taken into consideration. There are three possible factors that will contribute to the elongation: 1), the MT itself gets longer, 2), the linkage between the beads and MT stretches, and 3), the beads may rock. We discuss them respectively. The linkage between the beads and MT is formed by the specific interaction of biotin and NeutrAvidin. It is known that the interaction force between biotin and avidin is >100 pN and stronger than any known noncovalent protein-protein adhesion (21,22). Additionally, it belongs to short-range interaction. Therefore, the deformation of linkage is negligible. Another possibility is the rocking of beads, because the moments can act on the MT and beads during the stretch. If the rocking happens, there should be a displacement of bead in the y direction, so we can estimate the rocking effect by the displacement in the y direction. In our experiment, the maximal displacement of the bead in the y direction is about several nanometers. Therefore, the error resulting from the bead rocking can be neglected too. Taking all these factors into consideration, we can draw the conclusion that the elongation is attributable to the stretch of MT itself. Moreover, the buffer conditions of MT in our experiments are slightly different from those in Kis et al. (16). In our experiments a small dose of taxol is added in the buffer, whereas Kis et al. added glutaraldehyde in the buffer. Both reagents can make MT stable and prevent it from depolymerizing. However, Taxol can make MT more flexural, whereas glutaraldehyde makes it stronger, as mentioned above. Such different buffer conditions obviously help to enlarge the difference in the measured Young's moduli. Therefore, the much smaller Young's modulus measured in our experiment implies that, on one hand, fluorescence labeling causes the MT to be more flexible, on the other hand, different reagents may have a great influence on the rigidity of the MT.
In the observation of the breaking process, only 5 rather than 13 steps are detected. The reason for this discrepancy may be explained as follows. It takes ∼15 s for the “dumbbell” formation before the stretching experiment, which means that the MT has been exposed to the excitation light for at least 15 s. In this process, it is inevitable that some sites have been damaged. Therefore, the already broken protofilaments cannot be shown in the breaking process under external force. Furthermore, it can be found from Fig. 7 that the breaking interval in timescale is not even but random, indicating that two or more protofilaments may break at the same time or in a near time that we cannot discern in the current time resolution (1 ms). Actually, some data show that the force step is not always uniform. However, as long as the step shows up, it can provide a convincing proof that the breakages of protofilaments are not simultaneous, which is in good agreement with the model that when MTs disassemble, protofilaments will separately peel from the ends of depolymerizing MTs (23).
Acknowledgments
This work was supported by the Chinese National Key Basic Research Special Fund (grant No. 2002CB713805) and the National Natural Science Foundation of China (grant No. 10374112).
References
- 1.Vigers, G. A., M. Coue, and J. R. McIntosh. 1988. Fluorescent microtubules break up under illumination. J. Cell Biol. 107:1011–1024. [DOI] [PMC free article] [PubMed] [Google Scholar]
- 2.Dixit, R., and R. Cyr. 2003. Cell damage and reactive oxygen species production induced by fluorescence microscopy: effect on mitosis and guidelines for non-invasive fluorescence microscopy. Plant J. 36:280–290. [DOI] [PubMed] [Google Scholar]
- 3.Sporn, L. A., and T. H. Foster. 1992. Photofrin and light induces microtubuledepolymerization in cultured human endothelial cells. Cancer Res. 52:3443–3448. [PubMed] [Google Scholar]
- 4.Juarranz, A., A. Villanueva, V. Diaz, and M. Canete. 1995. Photodynamic effects of the cationic porphyrin, mesotetra(4N-methylpyridyl) porphine, on microtubules of HeLa cells. J. Photochem. Photobiol. B. 27:47–53. [DOI] [PubMed] [Google Scholar]
- 5.Stockert, J. C., A. Juarranz, A. Villanueva, and M. Canete. 1996. Photodynamic damage to HeLa cell microtubules induced by thiazine dyes. Cancer Chemother. Pharmacol. 39:167–169. [DOI] [PubMed] [Google Scholar]
- 6.de Pablo, P. J., I. A. Schaap, F. C. MacKintosh, and C. F. Schmidt. 2003. Deformation and collapse of microtubules on the nanometer scale. Phys. Rev. Lett. 91:098101. [DOI] [PubMed] [Google Scholar]
- 7.Kerssemakers, J. W., M. E. Janson, A. van der Horst, and M. Dogterom. 2003. Optical trap setup for measuring microtubule pushing forces. Appl. Phys. Lett. 83:4441–4443. [Google Scholar]
- 8.Castoldi, M., and A. V. Popov. 2003. Purification of brain tubulin through two cycles of polymerization-depolymerization in a high-molarity buffer. Protein Expr. Purif. 32:83–88. [DOI] [PubMed] [Google Scholar]
- 9.Keating, T. J., J. G. Peloquin, V. I. Rodionov, D. Momcilovic, and G. G. Borisy. 1997. Microtubule release from the centrosome. Proc. Natl. Acad. Sci. USA. 94:5078–5083. [DOI] [PMC free article] [PubMed] [Google Scholar]
- 10.Guo, H. L., X. C. Yao, Z. L. Li, B. Y. Cheng, X. H. Han, and D. Z. Zhang. 2002. Measurements of displacement and trapping force on micron-sized particles in optical tweezers system. Sci. China. 45:919–925. [Google Scholar]
- 11.Svoboda, K., and S. M. Block. 1994. Biological applications of optical forces. Annu. Rev. Biophys. Biomol. Struct. 23:257–260. [DOI] [PubMed] [Google Scholar]
- 12.Smertenko, A. P., H. Y. Chang, V. Wagner, D. Kaloriti, S. Fenyk, S. Sonobe, C. Lloyd, M. T. Hauser, and P. J. Hussey. 2004. The Arabidopsis microtubule-associated protein AtMAP65–1: molecular analysis of its microtubule bundling activity. Plant Cell. 16:2035–2047. [DOI] [PMC free article] [PubMed] [Google Scholar]
- 13.Zhai, Y., and G. G. Borisy. 1994. Quantitative determination of the proportion of microtubule polymer present during the mitosis-interphase transition. J. Cell Sci. 107:881–890. [DOI] [PubMed] [Google Scholar]
- 14.Kochevar, I. E., and D. A. Dunn. 1990. Photosensitized reactions of DNA: cleavage and addition. In Bioorganic Photochemistry. H. Morrison, editor. Wiley, New York. 273–315.
- 15.Turner, D., C. Y. Chang, K. Fang, P. Cuomo, and D. Murphy. 1996. Kinesin movement on glutaraldehyde-fixed microtubules. Anal. Biochem. 242:20–25. [DOI] [PubMed] [Google Scholar]
- 16.Kis, A., S. Kasas, B. Babić, A. J. Kulik, W. Benoît, G. A. D. Briggs, C. Schönenberger, S. Catsicas, and L. Forró. 2002. Nanomechanics of microtubules. Phys. Rev. Lett. 89:248101. [DOI] [PubMed] [Google Scholar]
- 17.Gittes, F., B. Mickey, J. Netteleton, and J. Howard. 1993. Flexural rigidity of microtubules and actin filaments measured from thermal fluctuations in shape. J. Cell Biol. 120:923–934. [DOI] [PMC free article] [PubMed] [Google Scholar]
- 18.Sackett, D. L., and R. E. Lippoldt. 1991. Thermodynamics of reversible monomer-dimer association of tubulin. Biochemistry. 30:3511–3517. [DOI] [PubMed] [Google Scholar]
- 19.Dye, R. B., S. P. Fink, and R. C. Williams Jr. 1993. Taxol-induced flexibility of microtubules and its reversal by MAP-2 and tau. J. Biol. Chem. 268:6847–6850. [PubMed] [Google Scholar]
- 20.Hugel, T., and M. Seitz. 2001. The study of molecular interactions by AFM force spectroscopy. Macromol. Rapid Commun. 22:989–1016. [Google Scholar]
- 21.Florin, E. L., V. T. Moy, and H. E. Gaub. 1994. Adhesion forces between individual ligand-receptor pairs. Science. 264:415–417. [DOI] [PubMed] [Google Scholar]
- 22.Weisel, J. W., H. Shuman, and R. I. Litvinov. 2003. Protein-protein unbinding induced by force: single-molecule studies. Curr. Opin. Struct. Biol. 13:227–235. [DOI] [PubMed] [Google Scholar]
- 23.Mandelkow, E. M., E. Mandelkow, and R. A. Milligan. 1991. Microtubule dynamics and microtubule caps: a time resolved cryo-electron microscopy study. J. Cell Biol. 114:977–991. [DOI] [PMC free article] [PubMed] [Google Scholar]


