Abstract
A detailed kinetic study of triple helix formation was performed by surface plasmon resonance. Three systems were investigated involving 15mer pyrimidine oligonucleotides as third strands. Rate constants and activation energies were validated by comparison with thermodynamic values calculated from UV-melting analysis. Replacement of a T·A base pair by a C·G pair at either the 5′ or the 3′ end of the target sequence allowed us to assess mismatch effects and to delineate the mechanism of triple helix formation. Our data show that the association rate constant is governed by the sequence of base triplets on the 5′ side of the triplex (referred to as the 5′ side of the target oligopurine strand) and provides evidence that the reaction pathway for triple helix formation in the pyrimidine motif proceeds from the 5′ end to the 3′ end of the triplex according to the nucleation-zipping model. It seems that this is a general feature for all triple helices formation, probably due to the right-handedness of the DNA double helix that provides a stronger base stacking at the 5′ than at the 3′ duplex–triplex junction. Understanding the mechanism of triple helix formation is not only of fundamental interest, but may also help in designing better triple helix-forming oligonucleotides for gene targeting and control of gene expression.
INTRODUCTION
A full understanding of interactions between nucleic acids requires knowledge of (i) the structures of nucleic acid complexes, (ii) the energetics of complex formation and (iii) the rates at which the complexes form and dissociate. Over the last two decades, tremendous advances have been made in both X-ray crystallography and NMR spectroscopy, which have provided high resolution structural data for nucleic acid complexes. However, structural data alone provide a partial description of the interaction, and must be complemented by thermodynamic and kinetic data if the system is to be understood in detail. Thermodynamics provides information necessary to understand the molecular forces responsible for the stability of nucleic acid complexes, while kinetics provides the most rigorous means of inferring the mechanism that defines the reaction pathway leading to the formation of a stable complex.
Over the last 15 years, oligonucleotide-directed triple helix formation (1,2) has aroused a great deal of interest due to its potential biological and therapeutic applications (reviewed in 3–6). Many efforts have been devoted to characterizing different triplex motifs, their thermal stability and thermodynamic parameters (reviewed in 7–11). However, kinetic studies on triple helix formation (12–19) are still limited and fragmentary due to the use of different techniques (biochemical assay, spectroscopy, etc.) and different experimental conditions (base composition, sequence and length of triplexes, as well as pH, cations and ionic strength, etc.).
The formation of triple helical structures by association of a double helix containing an oligopyrimidine·oligopurine (oligoY·oligoR) sequence with a single-stranded triple helix-forming oligonucleotide (TFO) is reminiscent in many aspects of the formation of double-helical structures by association of two Watson–Crick complementary single strands. Insights into the mechanism of these reactions can be provided by investigating their kinetics. Many pioneering studies of double helix formation in the late sixties and early seventies had shown that the activation energy of the association step had a negative value (20,21). These observations clearly pointed out that the association of two complementary single strands was not an elementary reaction resulting from bimolecular collision, and had been interpreted by the so-called nucleation- zipping model. Briefly, this model describes double helix formation as a process that starts in a series of fast but unfavorable reactions with a few base-pairing (forward) and unpairing (backward) processes, then when a further base pair is added to the critical intermediate, a helix nucleus is formed. Following this rate-determining step, a zipping process leads to the formation of a fully paired double helix faster than its dissociation into single strands. Early experiments on poly(rA)·2poly(rU) (22–24) and oligo(rA)·2oligo(rU) (20) showed that the association and dissociation rate constants of triple helices are 100 or more times slower than those of double helices.
We have reported that the formation of a 22mer pyrimidine-motif (Y-motif) triple helix was also characterized by a negative activation energy of the association step by analyzing the hysteresis of the triple helix melting profile (13). The mechanism of triple helix formation is consistent with a nucleation-zipping model. It was estimated that the nucleation (nucleus) involved approximately three to five triplets depending on ionic strength.
The present work was aimed at understanding the details of the mechanism by which a Y-motif triple helix is formed. The kinetics of three systems involving 15mer Y-motif triple helices were studied in detail by using surface plasmon resonance (SPR) biosensor (BIAcore) technology. The base composition of the systems was kept constant, only their sequences differed by the permutation of base triplets. All data can consistently be interpreted by a directional nucleation-zipping mechanism where nucleation occurs at the 5′ end of the triple helix (defined as the 5′ side of the target oligopurine sequence).
MATERIALS AND METHODS
Oligonucleotide
All oligonucleotides were synthesized by Sigma-Genosys (Cambridge, UK), and used without further purification. Their concentration was determined from absorbance at 260 nm according to the nearest-neighbor model (25). The 21-bp double helix containing the 15-bp oligoY·oligoR target sequence for triple helix formation was synthesized as a hairpin with a protruding single strand tethered to biotin (Fig. 1).
Figure 1.
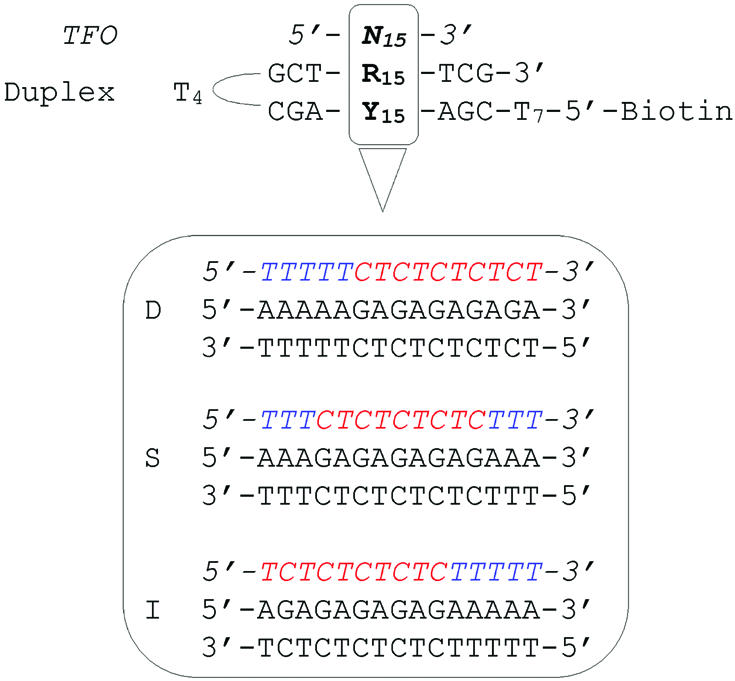
5′-Biotinylated hairpin duplexes containing a Y15·R15 sequence (top) were captured on streptavidin-derivatized CM5 sensor chip. The sequence of the three triple helix systems studied in this work are given below. TFOs are indicated in italics.
Melting experiments
All thermal denaturation studies were carried out using a Uvikon 940 spectrophotometer interfaced with a computer for data collection and analysis. Temperature control of the cell holder was achieved by a Haake D8 circulating water bath. The temperature of the water bath was decreased from 80 to 0°C and then increased back to 80°C at a rate of 0.1°C/min with a Haake PG 20 thermoprogrammer, and the absorbance at 260 nm was recorded every 1°C. Thermal denaturation and renaturation experiments were carried out on the sample containing 1 µM hairpin duplex and 1.5 µM TFO in the buffer used for SPR experiments. The maximum of the first derivative of the triplex ↔ duplex + TFO transition in the melting curve was taken as the melting temperature (Tm) within ±1°C accuracy. In the case of melting profiles exhibiting hysteresis, the mean value of the first derivative of the cooling and heating profiles was taken as an approximation of the Tm value with greater uncertainty (±2–3°C depending on the extent of hysteresis).
SPR experiments
SPR experiments were carried out using a BIAcore2000™ (BIAcore AB, Sweden) with a carboxymethylated dextran-coated sensor chip (CM5). The CM5 chip was first activated by injection of 200 µl of N-ethyl-N′-(dimethylaminopropyl)carbodiimide/N-hydroxysuccinimide at a flow rate of 20 µl/min, followed by injection of 100 µl of streptavidin (100 µg/ml) in 10 mM sodium acetate buffer (pH 4.5) at a flow rate of 10 µl/min, and finally the unused activated sites were capped by a 100 µl injection of 1 M ethanolamine. The injection of streptavidin was controlled to obtain ∼5500 resonance units (RU) immobilized streptavidin. The RU value provides a measure of the change in the mass density at the sensor chip surface. One micromolar solutions of 5′-biotinylated duplex hairpins, containing a target sequence for TFO (Fig. 1), were prepared in a HBS-EP buffer (0.01 M HEPES pH 7.4, 0.15 M NaCl, 3 mM EDTA, 0.0005% surfactant P20) (purchased from BIAcore). A strong streptavidin–biotin interaction was used to capture ∼1500 RU of the biotinylated oligonucleotides so that the RUmax of TFOs binding was ∼350 RU. RUmax is the expected response if all of the binding sites at the sensor chip surface were saturated; it was calculated as RUmax = [(TFO molecular weight) / (DNA hairpin molecular weight)] × (response of DNA hairpin immobilized at the surface). After each cycle of a kinetic study, a pulse of 5 µl of regenerant solution containing 2 M urea, 20% ethanol and 0.05% SDS was injected, followed by a 5 µl injection of 1 M NaCl in order to re-stabilize the intramolecular duplex. Stabilization of the baseline, following the regeneration procedure, was achieved after 15 min. Typically, a sensor chip could be reused for more than 100 cycles without notable loss of binding activity.
TFO solutions of decreasing concentration were prepared by serial dilutions, in a 10 mM sodium cacodylate (pH 6.2) buffer containing 100 mM NaCl and 10 mM MgCl2 (unless otherwise indicated). The SPR experiments were carried out by serial injection of TFO for 10 min at a 10 µl/min flow rate. After a dissociation period (30–120 min) in running buffer at the same flow rate, a 30-s pulse of a regeneration solution was applied in order to restore the TFO binding capacity of the sensor chip for further experiments. A serial injection of TFO provided simultaneously the response of perfectly matched, 5′- and 3′-mismatched triplexes, as well as that of a control, which mainly reflected bulk index change. All the sensorgrams were then corrected by subtraction of the control. All SPR experiments were carried out at four fixed temperatures in the range 19–35°C. The buffer type may influence the thermodynamic parameters of triplex formation with TFOs that have cytosine bases (26). The cacodylate is a suitable buffer for our study: it has a pKa = 6.1 that does not change significantly with temperature [d(pKa) / dT = 0.0006 U/°C, in the 0–50°C range], and a negligible protonation enthalpy (ΔHprotonation ≈ 0.5 kcal mol–1) (27).
Data analysis was performed on the corrected sensorgrams, using the BIAevaluation 3.0 software. The apparent association rate constant increased linearly with the concentration of TFO, in agreement with a two-state model. The fitting of the dissociation part was not mono- but rather bi-exponential. It was previously shown that the fast component was not relevant to the dissociation of TFO, and could be due to the fast matrix relaxation on the sensor chip (J.-S. Sun, unpublished data). Kinetics experiments were performed at different flow rates (5, 10, 20 and 40 µl/min). The sensorgrams and the calculated rate constants were not affected by the change in flow rate (Fig. S1 and Table S1 in the Supplementary Material), indicating that mass transport effects were negligible under our conditions.
RESULTS
Description of the investigated triple helices
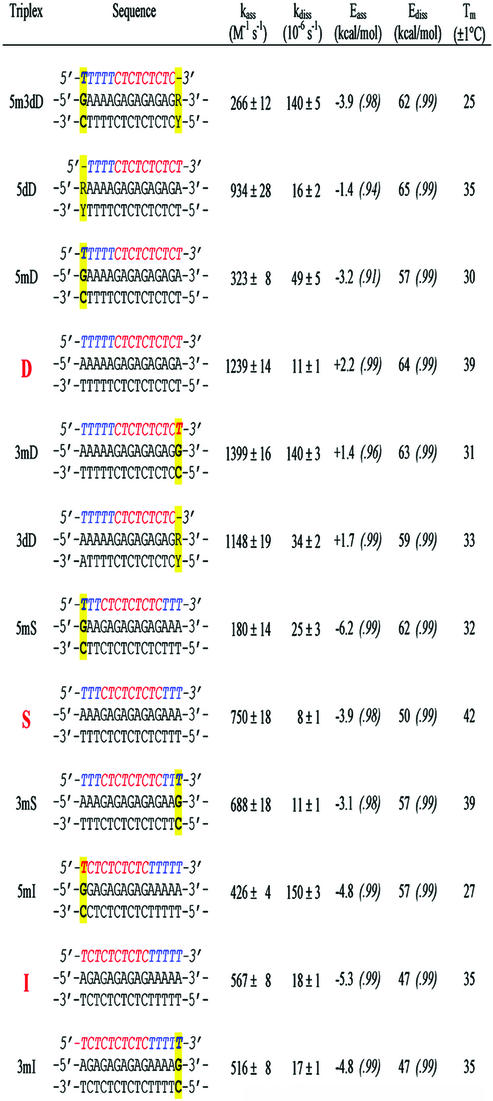
The kinetics and thermodynamics of triple helix formation were investigated by SPR and by UV-melting experiments. Three different triple helices in the Y-motif were chosen. The base composition was kept constant whereas the sequences were varied by permutation of base triplets so that a cluster of alternating T·AxT (where · and x indicate Watson–Crick and Hoogsteen hydrogen bonding, respectively) and C·GxC+ triplets was located either on one end (5′ or 3′) or in the center of the triplex, and adjacent T·AxT triplets were at the opposite end (3′ or 5′) with respect to the alternating sequence, or split at both ends (Fig. 1). Isolated C·GxC+ triplets, instead of adjacent C·GxC+ triplets, were chosen to allow homogeneous and effective protonation of all cytosines under mildly acidic conditions. Therefore, the difference in kinetic behavior of these triplexes is mainly ascribed to a sequence effect. Within each triple helix system, some variants were used where a terminal T·A base pair was substituted by a C·G pair, thus resulting in a C·GxT mismatched triplet upon triplex formation (i.e. 5mD and 3mD in Table 1). Furthermore, two 14-nt TFOs which differ from the full-length 15-nt TFO by deletion of a single terminal T were also studied in the triplex system D (5dD and 3dD in Table 1). These mismatches and deletions served as intrinsic probes to delineate the mechanism of triple helix formation.
Table 1. Rate constants at 25°C and the associated activation energies of the three triplex systems investigated in this study.
Mismatched C·GxT triplet is indicated by italic bold letters. The numbers in parentheses indicate the coefficient of linear regression. Tm is the melting temperature of triplex measured by UV-melting experiments.
DNA melting experiments
DNA thermal denaturation and renaturation experiments of all studied triple helices were carried out by UV absorption spectroscopy in order to determine the Tm of the triplex ↔ duplex + TFO transition and its thermodynamic parameters (ΔH and ΔS) according to a two-state model using a van’t Hoff plot (28). The purpose of triplex melting experiments were 2-fold: (i) the determination of Tm was useful to define the operational temperature range for SPR experiments; (ii) the data deduced from melting experiments [Tm, dissociation equilibrium constant (KD) at Tm and enthalpy] can be compared with those obtained by SPR experiments.
DNA melting experiments were carried out with 1 µM of hairpin duplex and 1.5 µM TFO in the same buffer as the one used in SPR experiments. Therefore, the equilibrium dissociation constant KDUV(TmUV) is 1.0 µM at the melting temperature (TmUV). The TmUV value of all studied triplexes are shown in Tables 1 and 2 (right column). Analysis of the melting curve shape according to a two-state model (van’t Hoff plot) provided the enthalpy of the interaction (ΔH°UV). The comparisons of UV melting and SPR data of the three triple helices (D, S and I) are given in Table 3.
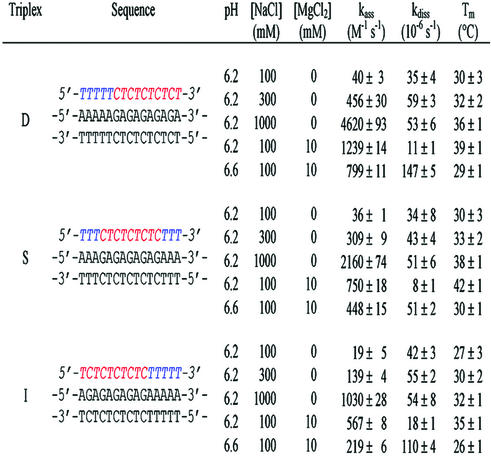
Table 2. Rate constants at 25°C of all the three triplexes (D, S and I) at pH 6.2 and 6.6 in 10 mM sodium cacodylate buffer in the presence of various concentrations of NaCl and MgCl2.
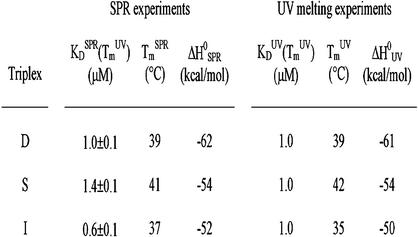
Table 3. Comparison of the equilibrium dissociation constant (KD), melting temperature (Tm) and enthalpy (ΔH°) determined by both SPR experiments and UV-melting experiments for the three triplexes (D, S and I).
KDSPR was calculated as the kdiss / kass ratio, as described in the Discussion.
SPR experiments
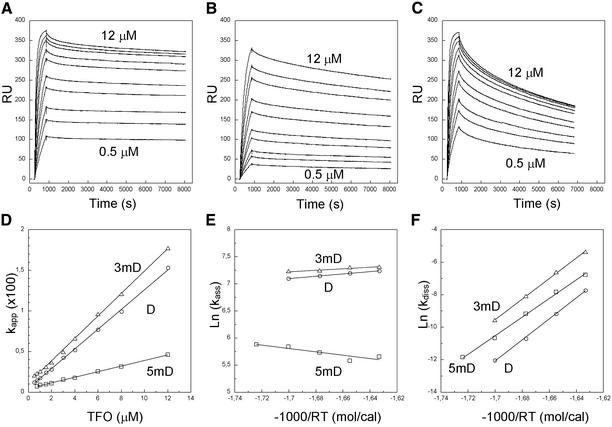
SPR (29) was used to investigate the kinetics of triple helix formation by BIAcore2000™. Duplexes of appropriate sequence were captured on the surface of the sensor chip via a streptavidin–biotin interaction. All the duplexes were made of a 5′-biotinylated oligonucleotide which was designed to fold into a 21-bp hairpin with a 15-bp oligoY·oligoR sequence located in the center (Fig. 1, top). Seven thymidylates were used as a linker between biotin and the 5′ end of the hairpin duplex. Four thymidylates served as a loop for hairpin structure. This intramolecular DNA target was designed to resist regeneration condition, as it was anchored to the sensor chip surface. Typically, three duplexes (i.e. D, 5mD and 3mD; Table 1) and one control duplex (in which the 15-bp oligoY·oligoR sequence was replaced by the 16-bp oligoY·oligoR sequence, 3′-T4CT4C6T-5′/5′-A4GA4G6A-3′) were loaded on four flow-cells of a sensor chip. A serial injection of TFO provided simultaneously the response of perfectly matched, 5′- and 3′-mismatched triplexes, as well as that of a control, which mainly reflected bulk index change. All the sensorgrams were then corrected by subtraction of the control (Fig. 2). Ten concentrations of TFO (0.5, 0.75, 1, 1.5, 2, 3, 4, 6, 8, 12 µM) were used to determine the association rate constant (kass) from kapp (kapp = kass[TFO] + kdiss). SPR experiments were carried out at different temperatures with a 4°C interval for each triple helix below its Tm value in order to measure the activation energies associated with association and dissociation (Eass and Ediss).
Figure 2.
Corrected SPR sensorgrams of the D, 5mD and 3mD triplexes (A–C, respectively) at different TFO concentrations (0.5, 0.75, 1, 1.5, 2, 3, 4, 6, 8, 12 µM from bottom to top) at 23°C. The apparent association rate constants (kapp) are plotted versus TFO concentration and analyzed by linear regression (D). Also shown are the Arrhenius plots of the association and dissociation rate constants (kass and kdiss) (E and F, respectively). Triplexes D, 5mD and 3mD are indicated by circles, squares and triangles, respectively.
Figure 2A shows the corrected sensorgram of the perfectly matched triplex D with 0.5–12 µM TFO at 23°C. The linear dependence of the apparent association rate constant (kapp) with respect to the concentration of TFO was consistent with a simple two-state model (Fig. 2D). The same experiments were carried out at five temperatures (19, 23, 27, 31 and 35°C). The rate constants (kass and kdiss) could be well aligned by an Arrhenius plot from which the activation energies (Eass and Ediss) were calculated by linear regression (Fig. 2E–F and Table 1). Therefore, all rate constants could be interpolated and compared at room temperature (25°C). The association and dissociation rate constants of the triplex D are ∼1.2 × 10³ M–1 s–1 and ∼1.1 × 10⁻⁵ s–1 at 25°C, respectively. This triplex was slow to form as compared to a duplex (the kass value of duplex formation is usually of the order of 105–106 M–1 s–1) (20–24). The dissociation process was also slow: the lifetime Ln2 / kdiss of this triplex was as long as 18 h at 25°C.
Data for the triplexes involving either a 5′-end or a 3′-end mismatch (5mD and 3mD) are also shown (Fig. 2B–F and Table 1). It was observed that a 5′-end mismatch dramatically decreased the kass value, whereas a 3′-end mismatch did not affect kass markedly (Fig. 2E). Both mismatches increased the kdiss value, notably for the 3′-end mismatch. Similar, but less pronounced, effects were also observed for the 5′- and 3′-end deletions in TFO (5dD and 3dD in Table 1). It should be noted that the same 5′-end mismatch in a shortened triplex (5m3dD versus 3dD in Table 1) had the same effects as compared to the full-length triplex (5mD versus D in Table 1).
All kinetic data of the triplex system D consistently highlight the importance of the 5′-end triplet. Two other sequence-related triplex systems (S and I) were also studied in order to assess any sequence effect. S contains the alternating T·AxT and C·GxC+ triplets in the center of the triple helix with three T·AxT triplets at both 5′ and 3′ ends. I has the inverted sequence of D. Again, all data showed the prevailing role played by 5′-end triplet (see Table 1). However, the extent of the 5′-mismatch effect depends on the sequence context.
As pH and the presence of cations influence triple helix formation, SPR experiments were also carried out under different pH and cationic conditions (Table 2) in an effort to understand the sequence effects. In particular, their effects on the association rate constants may provide an insight to delineate the possible reaction pathway of triple helix formation in the Y-motif. Raising ionic strength dramatically increased the association rate constants, whereas the dissociation rate constants were not significantly affected. Change in pH affected both rate constants. The extent of these variations is sequence-dependent. For all triplexes, a 10-fold increase in NaCl concentration led to a 50–100-fold increase in the association constant, whereas the dissociation was marginally affected by ionic strength. The addition of 10 mM MgCl2 led to a much faster association process (31-fold for D, 21-fold for S and 30-fold for I) and a slower dissociation (3-fold for D, 4-fold for S and 2-fold for I). For the three triplex systems examined, a 0.4 U increase in pH led to a ∼2-fold decrease in the association constant and to an important increase in the dissociation process (13-fold for D, 6-fold for S and I), resulting in a markedly reduced thermal stability (ΔTm ∼ 10°C). These results are summarized in Table 2.
DISCUSSION
Triple helix formation and influence of hairpin loop
Triple helix formation was evidenced by SPR and DNA melting experiments (Fig. 2 and Tables 1–3). The 1:1 stoichiometry of the reaction was evidenced by the ratio of RUeq and RUmax [the measured resonance unit at equilibrium (RUeq) versus the calculated one based on a 1:1 reaction (RUmax)] (Fig. S2 in the Supplementary Material). In the presented experiments, the hairpin loop was located at the 5′ side of the target oligopurine strand 3 bp away from the duplex–triplex junction. Additional experiments were performed where the location of the hairpin loop was reversed (at the 3′ side of the oligopurine strand) on the symmetrical system (Fig. S3A in the Supplementary Material). The reversion of the hairpin loop had little effect on the dissociation rate constants. A significant increase in the association rate constants was observed but the difference in three triplexes remained, i.e. the kass values of the perfect triplex S and the triplex with a 3′-end mismatched triplet 3mS were close and ∼4-fold higher than that of the triplex with a 5′-end mismatched triplet 5mS (Fig. S3B in the Supplementary Material). This control experiment demonstrated that the 5′/3′ asymmetry is neither the trivial result of the polarized attachment of the duplex oligonucleotide to the sensor chip surface nor the result of the hairpin loop location. The influence of hairpin loop on the association rate constant may be explained in light of the mechanism of triple helix formation (see Fig. S3C in the Supplementary Material).
Validition of kinetic measurements by BIAcore
The comparison of the data deduced from kinetic measurements of triplex formation by SPR at the interface of a sensor chip with those calculated from DNA melting experiments by UV spectrophotometry in solution on the same triplex is important in order to validate the kinetic data measured in this work.
From the rate constants (kass and kdiss) and the associated activation energies (Eass and Ediss) obtained by SPR, it is possible to calculate: (i) the equilibrium dissociation constant [KDBIA(TmUV)] as the ratio of rate constants extrapolated at the measured TmUV [kdiss(TmUV) / kass(TmUV)]; (ii) the melting temperature (TmBIA) by determination of temperature where KDBIA = 1 µM; (iii) the enthalpy of the interaction from activation energies (ΔH°BIA = Eass – Ediss).
Overall, the data deduced from SPR on the three full-length and perfectly matched triplexes studied in this work (D, S and I; Table 3) agreed with those obtained by melting experiments. The consistency of the data obtained separately by two techniques provides a validation of the rate constants and the associated activation energies measured by SPR.
Association rate constant depends on the nature of 5′-side base triplets
Regardless of their sequences, a single 5′-end mismatched C·GxT triplet caused an ∼4-fold decrease in the association rate constant (D versus 5mD, 3dD versus 5m3dD and S versus 5mS in Table 1), whereas an identical mismatch at the 3′ end left kass nearly unchanged or even slightly increased (D versus 3mD, S versus 3mS and I versus 3mI in Table 1). It is interesting to note that the deletion of a single T either at the 5′ or 3′ end of TFO only decreases kass by 25 and 7%, respectively (D versus 5dD and D versus 3dD in Table 1). Therefore, the presence of a dangling T at the 5′ end (as occurred in a C·GxT mismatch) is more detrimental to kass than the removal of the terminal nucleotide of the TFO (5mD versus 5dD in Table 1).
When considering the sequence of base triplets at the 5′ side of triplexes while keeping the composition of base triplets constant throughout triplexes, it emerged that the value of kass was decreased by ∼2.5-fold (in the 6.2–6.6 pH range) when the cluster composed of alternating T·AxT and C·GxC+ triplets was shifted from the 3′ side to the 5′ side of the triplex (Table 3). When pH was raised from 6.2 to 6.6, the values of kass were reduced by 2.6-, 1.7- and 1.5-fold in the triplexes I, S and D, respectively (Table 3). These observations were consistent with: (i) the necessity of cytosine protonation required for a Y-motif triplex, concomitant with triplex formation (assuming that the state of cytosine protonation of single-stranded TFOs was not greatly influenced by their sequence in the three studied systems); (ii) the importance of the 5′-side base triplets, clearly a key factor in the association of TFO with its target duplex.
In addition, for all triplexes, an increase in the concentration of NaCl (0.1–1 M) had a major impact on kass but nearly no effect on kdiss (Table 2) with notable sequence dependence: a 10-fold increase in the concentration of NaCl, boosted the kass by 54-, 60- and 116-fold in the triplexes I, S and D, respectively. The difference in NaCl effect could be explained by both an intrinsic competition between the binding of monocation and cytosine protonation and the involvment of C·GxC+ triplets at the 5′ side in the association phase of triplex formation. It is worth noting that the addition of 10 mM of divalent cations (MgCl2) in the buffer containing 0.1 M NaCl had an almost similar effect for all three triplexes regardless of their sequences. The mean value of kass was boosted up to 21–31-fold whereas that of kdiss was reduced by ∼2–4-fold. This last observation shows that the Mg2+ dications mainly favor triplex formation by increasing the association rate constant.
Taken together, all the above-mentioned observations, i.e. the effect of sequence, triplet mismatch/deletion, pH, cations and ionic strength, on the three studied triplexes, which are identical in base composition, consistently point to the key role of the 5′-side base triplets in the association rate constant of Y-motif triple helix formation.
Sequence-dependent dissociation rate constant
For a given length and base triplet composition, the dissociation rate constant of the triplexes notably depends on their sequence. The slowest dissociation was observed for the triplex with a symmetric sequence (S). An increase in pH from 6.2 to 6.6 speeded up the kdiss of triplex D by 13-fold whereas that of triplexes S and I was increased by only 6-fold (Table 2). It is also worth noticing that a pH increase affects triplex dissociation much more than association.
When examining the effect of base triplet mismatches of all three triplex systems, it turns out that: (i) a terminal mismatched C·GxT triplet greatly increases the kdiss for all triplexes; (ii) a terminal C·GxT mismatch within an alternating T·AxT and C·GxC+ triplet cluster accelerated dissociation by a factor of 8–12 (5mI and 3mD in Table 1, respectively) whereas an identical mismatch within a T·AxT triplet cluster either increased the dissociation by 4-fold or had no significant effect on dissociation (5mD and 3mI in Table 1, respectively); (iii) for a triplex with a symmetrical sequence, a 5′-end mismatch had a 2-fold greater effect on kdiss than a 3′-end mismatch (5mS versus S and 3mS versus S in Table 1). It is worth noticing that the deletion of a T·AxT triplet in an alternating T·AxT and C·GxC+ triplet cluster had a ∼2-fold greater effect on dissociation than the same deletion in a T·AxT triplet cluster (3dD versus D and 5dD versus D in Table 1). It is also noted that an end-mismatched C·GxT triplet caused three to four times faster dissociation than the corresponding deletion of a T·AxT triplet (Table 1). The same trends were observed for other mismatched (i.e. T·AxC) or deleted triplets in other triplexes (data not shown).
The sequence dependence of dissociation rate constants shown above strongly suggests that a cluster composed of alternating T·AxT and C·GxC+ base triplets is likely a core element in Y-motif triple helix formation. Any alteration of this core element (mismatch or deletion) was detrimental to triplex formation mainly by facilitating the dissociation process. In addition, a 5′-end mismatch has an intrinsically higher penalty than its 3′-end analog, as shown in the triplex S with a symmetrical sequence.
Activation energies
In parallel with the observations that the 3′-end mismatch or deletion had little effect on the association rate constant, it was found that the same alteration contributed to a rather small decrease of the activation energy for the association reaction (Eass) in the range of –0.5 to –0.8 kcal mol–1, which depends on triplex sequence, mismatch and deletion (Table 1). On the other hand, the same mismatch or deletion at the 5′ end of the triplex appeared to greatly affect Eass. The extent of variation also depends on triplex sequence, mismatch and deletion (in the range of –5.4 to +0.5 kcal mol–1).
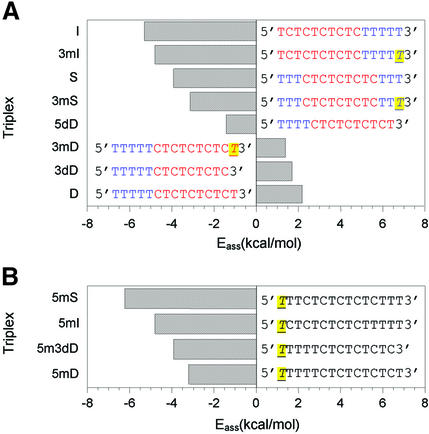
In an attempt to sort out any sequence effect on Eass, triplexes were ranked according to the value of their Eass, except those involving a 5′-end mismatch, which were separately ranked (Fig. 3A and B). It becomes evident that the value of Eass mainly depends on the sequence on the 5′ side of the triplex: the more adjacent T·AxT triplets on the 5′ side of the triplex, the higher (less negative or more positive) the association activation energy (Fig. 3A).
Figure 3.
Histogram of the association activation energy (Eass) as a function of the sequence at the 5′ end of triplexes. T indicates a mismatched G·CxT triplet.
It is interesting to note that a 5′-end mismatch such as that in triplexes 5mD and 5m3dD had a similar value of Eass as that of the triplexes 3mS and S, respectively (Fig. 3B and A). The TFO containing 5′-TTTTTCTC sequence (where T designates the T base involved in a mismatched C·GxT triplet) behaves as a TFO having a 5′-TTTCTCT sequence rather than a 5′-TTTTCTC sequence. Therefore, it seems that a 5′-end mismatch imposes a constraint on its nearest neighbor and decreases its ability to participate in the initial association (nucleation) process.
An increase of 0.4 pH units (from 6.2 to 6.6) had no effect on Eass for the triplex D, which contains a T·AxT triplet tract at the 5′ side, whereas it increased Eass by ∼1.5 kcal mol–1 for the triplexes I and S, which contain T·AxT and C·GxC+ triplets at the 5′ side (data not shown).
The value of the dissociation activation energy Ediss also depends on the sequence of triplexes. However, no clear consistency was found as it was dependent on mismatch and deletion in some cases, or remained constant in other cases (Table 1).
Mechanism of pyrimidine-motif triple helix formation
The current work provides new insights into the mechanism of Y-motif triplex formation. All our data consistently show that the association rate constant is governed by the nature of base triplets at the 5′ end of the triplex. The most striking example of this behavior is the effect of mismatch in the triplex with symmetric sequence. A mismatched C·GxT triplet at the 5′ end of the triplex dramatically decreased kass by 4-fold, whereas the same mismatch at the 3′ end had only a marginal 9% effect on kass. Similar effects were observed for the other two triplexes (D and I in Table 1), albeit the extent of kass variations was somewhat sequence dependent. Our data provide clear evidence that the nucleation takes place on the 5′ side of the triplex, and that there is a strong 5′→3′ directional preference, which has not been seen in nucleic acids so far.
Under given experimental conditions, a careful analysis of the activation energy associated with kass reveals that a correlation exists between the value of Eass (positive or negative) and the sequence at the 5′ side of the triplex. The more alternating C·GxC+ triplets on the 5′ side of the triplex, the more negative the association activation energy (Fig. 3A). This is consistent with our observation that a tract of alternating T·AxT and C·GxC+ triplets at the 5′ side of the triplex has a greater stabilizing potential for triple helix formation as compared to a T·AxT triplet tract. Having taken into account the variation of Eass and the sequence at the 5′ side of the triplex, it may be proposed that the size of nucleus depends on the sequence that participates in the nucleation step: the weaker the base triplets, the longer the nucleus. In this study, the absolute Eass values are relatively small as compared to those obtained in our previous study of a 22mer triplex (from –16 to –28 kcal mol–1 depending on ionic strength) (13). It was not possible to calculate the size of the nucleus according to the nucleation-zipping model (20,21) as we previously did (13), probably due to the short size of the triplexes investigated here. In addition, the model does not take into consideration the nature of base pairs or base triplets involved in the nucleation step. It should be noted that when the length of triplex is much longer than its nucleus size, the Eass value should be a constant governed by base triplets involved in the nucleation.
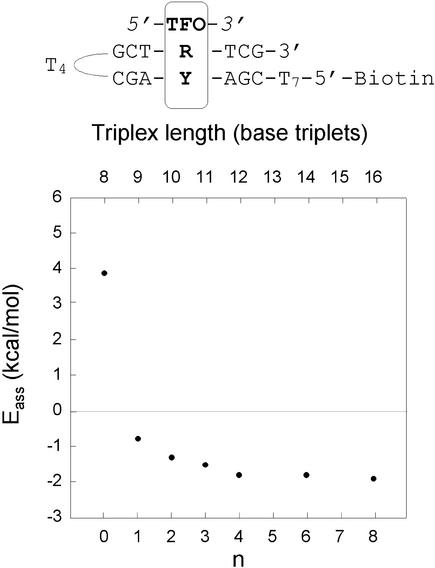
An additional experiment was further carried out to check the nucleation model. Triple helix formation of a series of TFOs, (TC)4Tn, where n = 0, 1, 2, 3, 4, 6 and 8, were assayed by BIAcore at different temperatures in the 10 mM sodium cacodylate buffer (pH 6.0), in the presence of 100 mM NaCl and 10 mM MgCl2. This experiment was performed at pH 6.0, in order to permit triplex formation with the shortest TFO (n = 0). The Eass values varied sharply from positive (n = 0) to negative (n ≥ 1) as the size of the Tn tail increased, and they remained constant for n ≥ 4 (Fig. 4). It was not possible to study TFO shorter than (TC)4, probably because its length is close to the critical nucleus size. These experiments qualitatively support the nucleation-zipping model.
Figure 4.
Association activation energies (Eass) of a series of TFOs, 5′-(TC)4Tn-3′, where n = 0, 1, 2, 3, 4, 6, 8; the length in base triplets is also given. The measures were performed in a 10 mM sodium cacodylate buffer (pH 6.0), 100 mM NaCl and 10 mM MgCl2. The coefficients of linear regression for the calculated Eass were in the range 0.97–0.99.
Is this directional nucleation-zipping mechanism a peculiar feature of the Y-motif triple helix, or is this a general feature of nucleic acids association? It is generally believed that nucleation in duplex formation may take place anywhere and then propagate in both directions. This is probably the case for a long DNA polymer. However, it remains to be seen whether the reaction pathway leading to duplex formation by short oligomers might have any directional preference. Our preliminary study shows that other triplex motifs involving the T·AxT, T·AxA and C·GxG base triplets in reverse Hoogsteen configuration exhibit similar features (J.-S. Sun, unpublished data). They are consistent with previous reports (30,31) showing that the nature of the bases at the 3′ side of TFO seems to be a key factor of triplex stability (the third strand orientation of these triplexes is opposite to that in the Y-motif triplex).
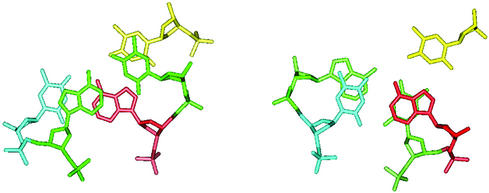
A plausible explanation of such a directional nucleation-zipping model comes from a molecular modeling study by conformational energy minimization of the structure of the junction between a double and a triple helix. Figure 5 shows that the first base pair on the 5′ side of the triplex overlaps well with all three bases in the first base triplet at the 5′ junction, whereas the base pair on the 3′ side of the triplex stacks only with the Watson–Crick base pair of the base triplet at the 3′ junction. The base stacking at the 5′ junction between the preceding base pair and the first base triplet was ∼0.7 kcal mol–1 stronger than that between the last base triplet and the next base pair at the 3′ junction. The difference in the base stacking interaction is due to the right-handedness of nucleic acids. As a consequence of such structural and energetic features, a nucleation at the 5′ end should be favored since once the very first base triplet is formed, formation of a second base triplet (in the 5′→3′ direction) would not disrupt the stacking between the first base triplet and its 5′-side base pair neighbor, whereas the reverse processing would cause a partial rearrangement of the base pair with respect to the 3′ first base triplet and rearrangement between the second triplet with it 5′ base pair, and so on.
Figure 5.
Structure of the duplex–triplex junction from a previously published energy minimized model (32). The nucleotides involved in the base triplet are colored in blue, red and yellow for Watson–Crick base pair and TFO, respectively. The Watson–Crick base pair next to the junction is colored in green. The 5′ axis of the oligopurine strand comes out of the plan. The 5′ and the 3′ junctions are shown on the left and right, respectively. Hydrogen atoms are omitted for clarity.
In summary, the kinetic study of triple helix formation by SPR provides evidence that the mechanism of a pyrimidine-motif triple helix formation proceeds from the 5′ side to the 3′ end of the triplex according to the nucleation-zipping model. Preliminary results suggest that this is a general feature of any triple helix formation. The right-handedness of natural DNA helical structures is likely responsible for the observed 5′→3′ directional nucleation-zipping reaction pathway. Understanding the mechanism of triple helix formation is not only of fundamental interest but also should help design better TFOs for gene targeting and for efficient control of gene expression.
SUPPLEMENTARY MATERIAL
Supplementary Material is available at NAR Online.
Acknowledgments
ACKNOWLEDGEMENTS
We thank M. Rougée and L. Lacroix for helpful discussions. The authors thank ANRS and INSERM for supporting the acquisition of BIAcore2000. This work was supported in part by an ARC grant (no. 4321) to J.L.M.
REFERENCES
- 1.Le Doan T., Perrouault,L., Praseuth,D., Habhoud,N., Decout,J.L., Thuong,N.T., Lhomme,J. and Hélène,C. (1987) Sequence-specific recognition, photocrosslinking and cleavage of the DNA double helix by an oligo-[α]-thymidylate covalently linked to an azidoproflavine derivative. Nucleic Acids Res., 15, 7749–7760. [DOI] [PMC free article] [PubMed] [Google Scholar]
- 2.Moser H. and Dervan,P.B. (1987) Sequence-specific cleavage of double helical DNA by triple helix formation. Science, 238, 645–650. [DOI] [PubMed] [Google Scholar]
- 3.Maher L.J. III (1996) Prospects for the therapeutic use of antigene oligonucleotides. Cancer Invest., 14, 66–82. [DOI] [PubMed] [Google Scholar]
- 4.Giovannangeli C. and Hélène,C. (1997) Progress in developments of triplex-based strategies. Antisense Nucleic Acid Drug Dev., 7, 413–421. [DOI] [PubMed] [Google Scholar]
- 5.Chan P.P. and Glazer,P.M. (1997) Triplex DNA: fundamentals, advances, and potential applications for gene therapy. J. Mol. Med., 75, 267–282. [DOI] [PubMed] [Google Scholar]
- 6.Praseuth D., Guieysse-Peugeot,A.L. and Hélène,C. (1999) Triple helix formation and the antigene strategy for sequence-specific control of gene expression. Biochim. Biophys. Acta, 1489, 181–206. [DOI] [PubMed] [Google Scholar]
- 7.Sun J.S. and Hélène,C. (1993) Oligonucleotide-directed triple-helix formation. Curr. Opin. Struct. Biol., 3, 345–356. [DOI] [PubMed] [Google Scholar]
- 8.Radhakrishnan I. and Patel,D.J. (1994) DNA triplexes: solution structures, hydration sites, energetics, interactions, and function. Biochemistry, 33, 11405–11416. [DOI] [PubMed] [Google Scholar]
- 9.Sun J.S., Garestier,T. and Hélène,C. (1996) Oligonucleotide directed triple helix formation. Curr. Opin. Struct. Biol., 6, 327–333. [DOI] [PubMed] [Google Scholar]
- 10.Plum G.E. (1997) Thermodynamics of oligonucleotide triple helices. Biopolymers, 44, 241–256. [Google Scholar]
- 11.Gilbert D.E. and Feigon,J. (1999) Multistranded DNA structures. Curr. Opin. Struct. Biol., 9, 305–314. [DOI] [PubMed] [Google Scholar]
- 12.Maher L.J. III, Dervan,P.B. and Wold,B.J. (1990) Kinetic analysis of oligodeoxyribonucleotide-directed triple-helix formation on DNA. Biochemistry, 29, 8820–8826. [DOI] [PubMed] [Google Scholar]
- 13.Rougée M., Faucon,B., Mergny,J.L., Barcelo,F., Giovannangeli,C., Garestier,T. and Hélène,C. (1992) Kinetics and thermodynamics of triple-helix formation: effects of ionic strength and mismatches. Biochemistry, 31, 9269–9278. [DOI] [PubMed] [Google Scholar]
- 14.Sarai A., Sugiura,S., Torigoe,H. and Shindo,H. (1993) Thermodynamic and kinetic analyses of DNA triplex formation: application of filter-binding assay. J. Biomol. Struct. Dyn., 11, 245–252. [DOI] [PubMed] [Google Scholar]
- 15.Yang M., Ghosh,S.S. and Millar,D.P. (1994) Direct measurement of thermodynamic and kinetic parameters of DNA triple helix formation by fluorescence spectroscopy. Biochemistry, 33, 15329–15337. [DOI] [PubMed] [Google Scholar]
- 16.Bates P.J., Dosanjh,H.S., Kumar,S., Jenkins,T.C., Laughton,C.A. and Neidle,S. (1995) Detection and kinetic studies of triplex formation by oligodeoxynucleotides using real-time biomolecular interaction analysis (BIA). Nucleic Acids Res., 23, 3627–3632. [DOI] [PMC free article] [PubMed] [Google Scholar]
- 17.Protozanova E. and Macgregor,R.B.,Jr (1996) Kinetic footprinting of DNA triplex formation. Anal. Biochem., 243, 92–99. [DOI] [PubMed] [Google Scholar]
- 18.Taylor M.J. and Dervan,P.B. (1997) Kinetic analysis of sequence-specific alkylation of DNA by pyrimidine oligodeoxyribonucleotide-directed triple-helix formation. Bioconjug. Chem., 8, 354–364. [DOI] [PubMed] [Google Scholar]
- 19.Asensio J.L., Dosanjh,H.S., Jenkins,T.C. and Lane,A.N. (1998) Thermodynamic, kinetic, and conformational properties of a parallel intermolecular DNA triplex containing 5′ and 3′ junctions. Biochemistry, 37, 15188–15198. [DOI] [PubMed] [Google Scholar]
- 20.Pörschke D. and Eigen,M. (1971) Co-operative non-enzymic base recognition. 3. Kinetics of the helix-coil transition of the oligoribouridylic–oligoriboadenylic acid system and of oligoriboadenylic acid alone at acidic pH. J. Mol. Biol., 62, 361–381. [DOI] [PubMed] [Google Scholar]
- 21.Craig M.E., Crothers,D.M. and Doty,P. (1971) Relaxation kinetics of dimer formation by self complementary oligonucleotides. J. Mol. Biol., 62, 383–401. [DOI] [PubMed] [Google Scholar]
- 22.Blake R.D. and Fresco,J.R. (1966) Polynucleotides. VII. Spectrophotometric study of the kinetics of formation of the two-stranded helical complex resulting from the interaction of polyriboadenylate and polyribouridylate. J. Mol. Biol., 19, 145–160. [DOI] [PubMed] [Google Scholar]
- 23.Blake R.D., Massoulié,J. and Fresco,J.R. (1967) Polynucleotides. VIII. A spectral approach to the equilibria between polyriboadenylate and polyribouridylate and their complexes. J. Mol. Biol., 30, 291–308. [PubMed] [Google Scholar]
- 24.Blake R.D., Klotz,L.C. and Fesco,J.R. (1968) Polynucleotides. IX. Temperature dependence of kinetics of complex formation in equimolar mixtures of polyriboadenylate and polyribouridylate. J. Am. Chem. Soc., 90, 3556–3562. [DOI] [PubMed] [Google Scholar]
- 25.Cantor C.R., Warshaw,M.M. and Shapiro,H. (1970) Oligonucleotide interactions. III. Conformational differences between deoxy- and ribodinucleoside phosphates. Biopolymers, 9, 1059–1077. [DOI] [PubMed] [Google Scholar]
- 26.Wilson W.D., Hopkins,H.P., Mizan,S., Hamilton,D.D. and Zon,G. (1994) Thermodynamics of DNA triplex formation in oligomers with and without cytosine bases: influence of buffer species, pH, and sequence. J. Am. Chem. Soc., 116, 3607–3608. [Google Scholar]
- 27.Fukada H. and Takahashi,K. (1998) Enthalpy and heat capacity changes for the proton dissociation of various buffer components in 0.1 M potassium chloride. Proteins, 33, 159–166. [PubMed] [Google Scholar]
- 28.Marky L.A. and Breslauer,K.J. (1987) Calculating thermodynamic data for transitions of any molecularity from equilibrium melting curves. Biopolymers, 26, 1601–1620. [DOI] [PubMed] [Google Scholar]
- 29.Rich R.L. and Myszka,D.G. (2000) Advances in surface plasmon resonance biosensor analysis. Curr. Opin. Biotechnol., 11, 54–61. [DOI] [PubMed] [Google Scholar]
- 30.Cheng A.J. and Van Dyke,M.W. (1994) Oligodeoxyribonucleotide length and sequence effects on intermolecular purine–purine–pyrimidine triple-helix formation. Nucleic Acids Res., 22, 4742–4747. [DOI] [PMC free article] [PubMed] [Google Scholar]
- 31.Arimondo P., Barcelo,F., Sun,J.S., Maurizot,J.C., Garestier,T. and Hélène,C. (1998) Triple helix formation by (G,A)-containing oligonucleotides: asymmetric sequence effect. Biochemistry, 37, 16627–16635. [DOI] [PubMed] [Google Scholar]
- 32.Kane S.A., Hecht,S.M., Sun,J.S., Garestier,T. and Hélène,C. (1995) Specific cleavage of a DNA triple helix by FeII.bleomycin. Biochemistry, 34, 16715–16724. [DOI] [PubMed] [Google Scholar]
Associated Data
This section collects any data citations, data availability statements, or supplementary materials included in this article.


