

Abstract
The mammalian lens consists of an aged core of quiescent cells enveloped by layers of mature fully elongated cells and younger, continuously elongating transcriptionally active cells. The fiber cell maturation is initiated when fiber cells cease to elongate. The process of maturation represents a radical switch from active elongation to a life-long quiescence and has not been studied previously. It may also include critical stages of preparation for the organelle removal and denucleation. In the present study, we used laser capture microdisection (LCM) microdissection and RNA amplification to compare global gene expression profiles of young elongating and mature, non-elongating fiber cells. Analysis of microarray data from three independent dye-swap experiments identified 65 differentially expressed genes (FDR < 0.1) with greater than 2-fold change in expression levels. Microarray array results for a group of randomly selected genes were confirmed by quantitative RT-PCR. These micro-array results provide clues to understanding the molecular pathways underlying lens development. The identified changes in the profile of gene expression reflected a shift in cell physiology characterizing the lens fiber maturation.
Keywords: Lens, Differentiation, Microarray, Gene expression profiling, Laser capture microdissection, RNA amplification
Abbreviations: LCM, laser capture microdisection
1. Introduction
The lens of the eye has become an important model system for studies of fundamental biological processes, such as cellular differentiation and aging. The lens tissue is composed of the tightly packed mass of fiber cells enveloped by a monolayer of epithelial cells on the anterior side. Lens fibers are ribbon-like cells that differentiate continuously from the lens epithelium throughout life [1]. This differentiation requires dramatic changes in shape, length, volume, protein content and removal of the organelle complement leading to an increase in transparency of the mature fibers in the core of the lens [2]. The differentiation of the lens fiber cells consists of two intense phases: first, the cells differentiate from the lens epithelium in order to begin elongation [3,4] and second, after elongation is accomplished the deeply buried fibers eliminate organelles and convert to quiescence [5]. More subtle changes occur between these intense phases, including fiber cell maturation, which coincides temporally with a true syncytium formation in the core of the lens [6,7]. The maturation phase represents a radical switch from active elongation to a life-long quiescence. Although this phase includes critical stages of cell preparation for the organelle removal and denucleation, accumulation of crystrallins and cell fusion, it has not been previously explored. Investigations of the molecular events of the first differentiation event have been facilitated by the superficial location of the transforming cells and the availability of a lens epithelium cell culture model [8,9]. In contrast, studies of the second differentiation phase occurring in the deeper layers of the tissue are more challenging, in part due to the lack of an appropriate cell culture model [8–10]. These obstacles also complicate the use of microarray transcriptional profiling, which has been so far restricted to sampling the whole lenses [11,12] or epithelial cell explants [13–15] at different ages. Direct gene expression profiling of the deeper layers of the lens has been impossible for two main reasons: (1) lack of differentiation-specific in vivo labeling that would allow dividing a featureless mass of maturing fibers into fractions with distinct differentiation status and (2) lack of a precise microdissection technique. Such precise differentiation-specific partitioning has become possible only recently because of the generation of several novel GFP-expressing mouse models [16] and development of the LCM technique [17,18]. Lenses of TgN(GFPU)5Nagy mice possess “variegated” mosaic GFP labeling outside the syncytium, which allows the separation of “variegated” elongating cells from uniformly labeled maturing cells. Also, recent advances in linear RNA amplification methods [19,20] ensured reliable preparation of RNA probes from ultra-small samples generated by LCM. The combination of these technical innovations has made it possible to perform direct transcriptional profiling of LCM-dissected lens fibers [21,22].
In this work, we sought to compare global gene expression in fully elongated, maturing fiber cells in the syncytium, with younger, actively elongating cells derived from the region outside the syncytium borders. To identify molecular pathways associated with lens differentiation, we characterized changes in gene expression by differential microarray profiling of these tightly spaced lens regions.
2. Materials and methods
2.1. Animals
Mice were housed in animal care facilities according to NIH guidelines (NIH Publication No. 86-23, 1985) and University of Miami IA-CUC approved protocols. All experiments were performed in compliance with the ARVO statement for use of animals in ophthalmic and vision research. The transgenic mouse strain used in this study TgN(GFPU)5Nagy (Jackson Laboratory, Bar Harbor, ME, originally generated in the laboratory of Andras Nagy [16]) express GFP ubiquitously and has no detectable lens abnormalities. Mouse lenses at P5 possess fiber cells at all stages of differentiation; in addition they are significantly easier to process for high quality microscopy and LCM samples then more aged ones. Animals were euthanized by CO2 inhalation according to the IACUC approved protocol.
2.2. Tissue fixation and preparation
Lenses were removed and immediately fixed using 4% paraformaldehide/PBS or methanol-based UMFIX reagent (Sakura Finetek USA, Inc.). To map the exact location of both elongating and maturing fibers on the lens slices, 4% paraformaldehide/PBS fixed lenses were vibratome-sliced (Vibratome 1000, St. Louis, MO) as described previously [23] and the GFP expression pattern was captured by confocal microscopy. For RNA extraction, lens UMFIX-fixed tissue was sliced into 5 μm-thick paraffin sections and microdissected using LCM (Leica Microsystems, Bannockburn, IL). The mid-saggital slices were used both for syncytium border measurements and for LCM. Control measurements confirmed that similar rates of shrinkage in paraformaldehyde- and UMFIX-fixed samples did not affect the precision of LCM dissection (data not shown).
Fiber cell samples were dissected out of 5 μm-thick slices. In one experiment we typically processed about 40 slices pooled from P5 littermate lenses, which was sufficient to collect the minimum of 200 zone-specific cells. This sample size provided a reliable representation of RNA species in experimental procedures originally designed and tested for only 1–10 cells [21,22,24].
2.3. Microscopy
Lenses were fixed in 4% paraformaldehyde/PBS and sectioned with a vibratome as described previously [25]. Localization of the syncytium border defined by the abrupt change of GFP labeling pattern was captured by confocal microscopy as described previously [23]. In brief, GFP fluorescence was visualized using an LSM510 instrument (Carl Zeiss, NY) equipped with an argon laser at 488 nm excitation and a 515–565 nm band pass emission filter. Physical parameters of the zones containing young and maturing fibers were measured in fixed lens slices using the software provided by Zeiss (Fig. 1A).
Fig. 1.

Maturing and young fibers were discriminated in the TgN(GFPU5)Nagy mouse lenses using contrasting GFP labeling patterns (A). Mature fibers (Mt) were localized within the region of uniform GFP labeling, whereas young (Yg) fibers localized exclusively to the variegated region at the lens periphery. Paraffin sections of P5 lenses were microdissected by LCM using measurements performed on the contralateral eye (red and blue arrows correspond to the inner borders of the maturing and young fibers) (B). Cells cut from each of the two regions were collected. Bar is 50 mkm.
2.4. Lens microdissection and RNA extraction
Cells from elongating and maturing fiber regions were dissected out using the Leica DMLA laser capture microscope (Leica Microsystems, Bannockburn, IL). The cut-out pieces containing captured cells were placed directly into tubes containing the lysis buffer supplied in the Absolutely RNA® nanoprep kit (Stratagene, La Jolla, CA) and total RNA was extracted and purified using the Absolutely RNA nanoprep kit according to the manufacturer’s protocol. Caps briefly placed onto the section without laser activation were used as negative controls. Samples from several age-matched lenses were pooled together to obtain differentiation-specific samples for microarray analysis.
2.5. RT-PCR
The quality of the extracted RNA was determined by RT-PCR using primers for mouse β-actin and low copy genes (Table 1 and Fig. 2) and MessageSensor™ RT Kit (Ambion, USA). Following conditions were used for one step RT-PCR: initial reverse transcription for 30 min at 50 °C, followed by Taq activation at 95 °C for 15 min, followed by 40 cycles at 94 °C, 45 s; 58 °C, 45 s; 72 °C, 1 min; and hold for 5 min at 72 °C.
Table 1.
Primers used in RT-PCR analysis
| Kpnb3 | Forward | GTGAATGTGGAGGAGGTCT |
| Reverse | TCAGTCCACAATCCTCCAG | |
| Ivns1abp | Forward | GGCTCTGATCCATATGGTC |
| Reverse | CATCAAAGCCACCACCTAC | |
| Pfkfb3 | Forward | TTGAATGTAGAATCGGTGAGC |
| Reverse | CATCTCGGCTTTAGTGCTTC | |
| Gadd45b | Forward | GGGGGATTTTGCAATCTTCT |
| Reverse | CGGTGAGGCGATCCTGA | |
| Srcasm | Forward | CGCCTCGAGTCACACATATG |
| Reverse | TTTAGAGAGCTGGCCCTTTG | |
| App | Forward | GACAAACATCAAGACGGAAG |
| Reverse | TTCTGCTGCATCTTGGAGAG | |
| Cd9 | Forward | TGGAGCAGTGGGTATCGGCATC |
| Reverse | TAAATTGAACCCCCGGATCCCTC | |
| Stx11 | Forward | GTTCGGGGTTGGCTGGAG |
| Reverse | CTCTGCAAGCCGATCCTTC | |
| Adam12 | Forward | ATAGGCATTGTGGGAAGGTC |
| Reverse | CCGTCCCACAGCTTCAGTC | |
| Crybb3 | Forward | GAGGCAGAAGTATCCCCAGA |
| Reverse | GGAGGGACAGGAGAATGTCA | |
| Actb | Forward | CACCCTGTGCTGCTCACC |
| Reverse | GCACGATTTCCCTCTCAG |
Fig. 2.
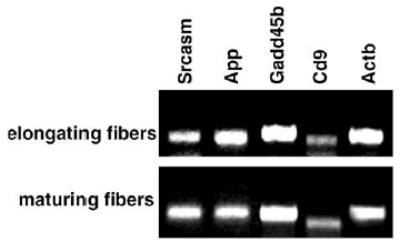
The quality of the extracted RNA from elongating and maturing zones in the lens was determined by RT-PCR using primers for mouse Actb (β-actin), Gadd45b, App, Cd9, Srcasm.
2.6. RNA amplification and labeling
Target RNA amplification and labeling with Cy-3 or Cy-5 dyes from CyDye Post-labeling Reactive Dye Pack (Amersham, USA) was carried out in two rounds using the Amino Allyl MessageAmp™ aRNA Kit (Ambion) as specified by the manufacturer. Quality and size distribution of the targets were determined by the Agilent 2100 Bioanalyzer (Agilent Technologies, USA). The Amino Allyl MessageAmp aRNA Kit is configured to incorporate the modified nucleotide 5-(3-aminoallyl)-UTP (aaUTP) into the aRNA during in vitro transcription. Once purified and fragmented, the dye labeled aRNA was used for micro-array hybridization.
2.7. Array hybridization
Labeled and amplified RNA from three different biological experiments were hybridized to the 22K Mouse Oligo microarrays (Agilent Technologies) according to the manufacturer’s instructions. For each biological replicate we performed two technical subreplicates using a dye-swap.
2.8. Image analysis and data processing
The microarrays were scanned at 10 μm resolution using a GenePix 4000A scanner (Axon Instruments at Molecular Devices) and the resulting images were analyzed with the software package GenePix Pro 5.1 (Axon Instruments at Molecular Devices). Data extracted from the images were transferred to the software package Acuity 4.0 (Axon Instruments) for normalization and statistical analysis. Each array was normalized for signal intensities across the whole array and locally, using Lowess normalization. For further analysis genes were selected according to the following quality criteria: (1) at least 90% of the pixels in the spot had intensity higher than background plus two standard deviations; (2), there were less than 2% saturated pixels in the spot; (3) signal to noise ratio (defined as ratio of the background subtracted mean pixel intensity to standard deviation of background) was 3 or above for each channel; (4) the spot diameter was between 110 and 150 μm; (5) the regression coefficient of ratios of pixel intensity was 0.6 or above. To identify significantly expressed genes we used one-class SAM (Significant Analysis of Microarray, http://www-stat.stanford.edu/~tibs/SAM) [26] analysis and NIA Array Analysis ANOVA (http://lgsun.grc.nia.nih.gov/ANOVA) tool. The following criteria were used: with SAM the FDR (False Discovery Rate) was less than 0.5% and the average fold change was greater than 2.0; for NIA AN-OVA the FDR was less than 10%, Bayesian adjustment of error variance was implemented and mean error variance was calculated using a sliding window of 1000 probes. NIA ANOVA software performs calculation of the FDR values for individual genes; these values are included into Tables 2 and 3. All primary microarray data are available at the GEO web site (http://www.ncbi.nih.gov/geo/; series GSE2083). Selected genes were classified according to Gene Ontology category “biological process” using Onto-Express (http://vor-tex.cs.wayne.edu/Projects.html) [27,28].
Table 2.
Genes with elevated expression in the maturing fibers
| GenBank Accession Number | Gene product | Expression ratio | FDR (ANOVA) | Biological process |
|---|---|---|---|---|
| Signal transduction | ||||
| AK034430 | Latrophilin 2 (Lphn2) | 2.46 | 0.00378 | |
| NM_172615 | RIKEN cDNA 1700021K19 gene (1700021K19Rik) | 2.21 | 0.02717 | |
| NM_008715 | DEAD/H (Asp-Glu-Ala-Asp/His) box polypeptide 26 (Ddx26) | 2.29 | 0.00284 | |
| Cytoskeleton organization and biogenesis | ||||
| NM_023668 | Nuclear distribution gene E-like homolog 1 (Ndel1) | 2.09 | 0.03422 | |
| AK077135 | Myosin 18B (Myo18B) | 2.22 | 0.00032 | |
| Apoptosis | ||||
| NM_008655 | Growth arrest and DNA-damage-inducible 45 β (Gadd45b) | 3.90 | 0 | |
| NM_013863 | Bcl2-associated athanogene 3 (Bag3) | 2.33 | 0.00304 | |
| NM_019957 | Deoxyribonuclease II β (Dnase2b/Dlad) | 2.85 | 0.00027 | |
| Endocytosis and exocitosis | ||||
| NM_028733 | Protein kinase C and casein kinase substrate in neurons 3 (Pacsin3) | 2.05 | 0.04356 | |
| AK017897 | Syntaxin 11 (Stx11) | 4.75 | 0 | |
| Metabolism | ||||
| NM_145835 | Lactase-like (Lctl) | 2.30 | 0.00235 | |
| Unknown | ||||
| AK032259 | RIKEN cDNA 3110001E11 gene (3110001E11Rik) | 2.95 | 0 | |
| NM_172275 | FLN29 gene product (Fln29-pending) | 2.05 | 0.02598 | |
| NM_172641 | RIKEN cDNA 9930023K05 gene (9930023K05Rik) | 2.45 | 0.00193 |
Table 3.
Genes with lowered expression in the maturing fibers
| GenBank Accession Number | Gene product | Expression ratio | FDR (ANOVA) | Biological process Signal transduction |
|---|---|---|---|---|
| NM_009790 | Calmodulin 1 (Calm1) | −2.07 | 0.0478 | |
| NM_009861 | Cell division cycle 42 homolog (S. cerevisiae) (Cdc42) | −2.16 | 0.08763 | |
| NM_008760 | Osteoglycin (Ogn) | −2.24 | 0.00242 | |
| NM_010696 | Lymphocyte cytosolic protein 2 (Lcp2) | −2.45 | 0.02637 | |
| NM_054102 | Influenza virus NS1A binding protein (Ivns1abp) | −2.51 | 0.00029 | |
| NM_025618 | Sorcin (Sri) | −2.83 | 0.01369 | |
| NM_011239 | RAN binding protein 1 (Ranbp1) | −2.01 | 0.0193 | |
| Cytoskeleton organization and biogenesis | ||||
| NM_146243 | ARP2 actin-related protein 2 homolog (yeast) (Actr2) | −2.03 | 0.03162 | |
| NM_009510 | Villin 2 (Vil2) | −2.26 | 0.00538 | |
| NM_008538 | Myristoylated alanine rich protein kinase C substrate (Marcks) | −2.12 | 0.00818 | |
| NM_138744 | Synovial sarcoma, X breakpoint 2 interacting protein (Ssx2ip) | −2.29 | 0.00541 | |
| Development and cell differentiation | ||||
| NM_010825 | Myeloid ecotropic viral integration site-related gene 1 (Mrg1/Meis2) | −2.29 | 0.00539 | |
| NM_008885 | Peripheral myelin protein (Pmp22) | −2.36 | 0.03025 | |
| NM_011857 | Odd Oz/10-m homolog 3 (Drosophila) (Odz3) | −2.15 | 0.003 | |
| NM_021881 | Quaking (Qk) | −2.02 | 0.02641 | |
| Cell cycle | ||||
| NM_019914 | ALL1-fused gene from chromosome 1q (Af1q-pending) | −2.11 | 0.01548 | |
| NM_146207 | Cullin 4A (Cul4a) | −2.65 | 0.00173 | |
| NM_015781 | Nucleosome assembly protein 1-like 1 (Nap1l1) | −2.82 | 0.00025 | |
| Transport | ||||
| NM_178405 | ATPase, Na+/K+ transporting, α2 polypeptide (Atp1a2) | −2.08 | 0.00891 | |
| NM_023579 | Karyopherin (importin) β3 (Kpnb3) | −2.83 | 0 | |
| NM_020573 | Oxysterol binding protein-like 1A (Osbpl1a) | −2.10 | 0.0134 | |
| AK083630 | Src activating and signaling molecule (Srcasm) | −3.55 | 0 | |
| NM_009037 | Reticulocalbin (Rcn) | −2.50 | 0.0005 | |
| NM_013703 | Very low density lipoprotein receptor (Vldlr) | −2.10 | 0.03991 | |
| NM_013898 | Translocase of inner mitochondrial membrane 8 homolog a (yeast) (Timm8a) | −2.23 | 0.01784 | |
| Cell adhesion | ||||
| NM_007664 | Cadherin 2 (Cdh2) | −3.74 | 0 | |
| BC034120 | Vitrin (Vit) | −2.08 | 0.00981 | |
| ECM | ||||
| NM_009984 | Cathepsin L (Ctsl) | −2.79 | 0.00029 | |
| J04694 | Procollagen, type IV, α1 (Col4a1) | −2.12 | 0.06809 | |
| Regulation of transcription | ||||
| NM_026003 | SWI/SNF related, matrix associated, actin dependent regulator of chromatin, subfamily a, member 2 (Smarca2) | −3.95 | 0 | |
| BC043450 | Zinc finger protein 198 (Zfp198) | −2.53 | 0.00053 | |
| NM_024186 | Single-stranded DNA binding protein 2 (Ssbp2) | −2.07 | 0.03019 | |
| Metabolism | ||||
| NM_145942 | 3-Hydroxy-3-methylglutaryl-coenzyme A synthase 1 (Hmgcs1) | −2.34 | 0.0361 | |
| NM_019868 | Heterogeneous nuclear ribonucleoprotein H2 (Hnrph2) | −2.10 | 0.07653 | |
| NM_133232 | 6-Phosphofructo-2-kinase/fructose-2,6-biphosphatase 3 (Pfkfb3) | −2.42 | 0.00097 | |
| NM_007933 | Enolase 3, β muscle (Eno3) | −2.19 | 0.01283 | |
| NM_145360 | Isopentenyl-diphosphate δ isomerase (Idi1) | −2.55 | 0.00033 | |
| NM_025573 | Splicing factor, arginine/serine rich 9 (Sfrs9) | −2.09 | 0.00778 | |
| NM_053188 | Steroid 5α-reductase 2 (Srd5a2) | −3.32 | 0.00274 | |
| Unknown | ||||
| NM_012056 | FK506 binding protein 9 (Fkbp9) | −2.59 | 0.00778 | |
| NM_026618 | DNA segment, Chr 11, ERATO Doi 99, expressed (D11Ertd99e) | −2.05 | 0.04342 | |
| NM_053194 | Expressed sequence AI114950 (AI114950) | −2.71 | 0.00887 | |
| AK029831 | RIKEN cDNA 6620401M08 gene (6620401M08Rik) | −2.86 | 0.0009 | |
| AK011900 | RIKEN cDNA 2610206D03 gene (2610206D03Rik) | −2.36 | 0.00928 | |
| NM_144846 | RIKEN cDNA 0910001A06 gene (0910001A06Rik) | −2.04 | 0.018 | |
| NM_016809 | RNA binding motif protein 3 (Rbm3) | −2.62 | 0.00016 | |
| AA755091 | RIKEN cDNA 1190005I06 gene (1190005I06Rik) | −2.06 | 0.01361 | |
| NM_023215 | RIKEN cDNA 2500003M10 gene (2500003M10Rik) | −2.10 | 0.00407 | |
| NM_172779 | RIKEN cDNA 6330505F04 gene (6330505F04Rik) | −2.55 | 0.00035 | |
| AK048051 | RIKEN cDNA 1810011E08 gene (1810011E08Rik) | −2.25 | 0.01065 | |
| BC008232 | Mus musculus, clone IMAGE:2647796, mRNA | −2.41 | 0.00105 |
Note: “minus” sign in expression ratio column is used solely to indicate the decrease in expression level.
2.9. Verification of microarray data
The microarray gene expression data were verified by quantitative RT-PCR for a group of randomly selected genes (Tables 1 and 4). cDNA was synthesized using the Message SensorTM RT Kit and real-time RT-PCR was performed with gene specific primers using the QuantiTect SYBR Green PCR kit (Qiagen, Valencia, CA) on a Bio-Rad I-Cycler. The PCR conditions were as follows: 95 °C, 15 min; 45 cycles at 94 °C, 30 s; 58 °C, 30 s; 72 °C, 1 min. The measured transcript abundance was normalized to the level of Actb (β-actin) for all samples. The size of the amplified PCR product was confirmed by gel electrophoresis.
Table 4.
Validation of microarray data for randomly selected genes by quantitative RT-PCR
| Real time RT-PCR (expression ratio) | Array (expression ratio) | Confirmed by real-time PCR | |
|---|---|---|---|
| Kpnb3 | −3.5 | −2.83 | Yes |
| Ivns1abp | −2.4 | −2.51 | Yes |
| Pfkfb3 | −10.4 | −2.42 | Yes |
| Srcasm | −5.1 | −3.55 | Yes |
| Gadd45b | 2.6 | 3.90 | Yes |
| Stx11 | 2.2 | 4.75 | Yes |
| Adam12a | 1.2 | 1.14 | Yes |
| Crybb3a | 1.0 | 1.22 | Yes |
| Cd9b | 3.0 | 5.56 | Yes |
Two genes with less then 2-fold change were tested for the false negative signals.
The gene with more then 2-fold change in expression detected in two out of three experiments.
Note: “minus” sign in expression ratio column is used solely to indicate the decrease in expression level.
3. Results and discussion
To characterize changes associated with the shift from elongation to maturation that precede organelle loss in lens fiber cells, we used the TgN(GFPU)5Nagy mouse strain to permit differentiation-specific staging of lens fiber cells in vivo. This strain exhibits a mosaic GFP expression pattern in many tissues, including lens, most likely due to position effect variegation phenomenon [23]. The lenses of TgN(GFPU)5Nagy mice exhibit contrasting GFP labeling patterns in young, superficial fibers, compared with older, maturing fibers: a superficial layer of young cells retains the mosaic (variegated) GFP expression pattern while the maturing fibers become uniformly fluorescent (Fig. 1A). As shown previously, an abrupt change from mosaic into the uniformly labeled fiber mass occurs when cells reach a specific differentiation stage and connect to the core syncytium [23]. At this stage elongation is accomplished and maturation begins. In this work we used the well-defined border of the syncytium as a marker separating young elongating fiber cells from a cohort of cells in which the maturation process leading to organelle degradation and quiescence has been initiated. Microscopic visualization allowed us to microdissect zones containing sub-populations of elongating and maturing fibers, enabling us to characterize the gene expression profile of cell at a discrete stage of differentiation.
We microdissected young and maturing fibers as follows: (1) young fibers containing only variegated fibers located outside (at least 30 μm or six cell layers away from the border) of the uniformly labeled syncytium; (2) maturing fibers containing uniformly labeled (syncytial) fibers located internally to the young ones (Fig. 1A). We reasoned that variegated fibers from the border of the syncytium should be included into “maturing fiber” sample in order to detect potential early transcription of genes responsible for fiber maturation and syncytium formation. Therefore, in a typical experiment we shifted borders of the dissected zones six cell layers or 30 μm (approximately one “differentiation day” of the mouse lens) closer to the lens surface (Fig. 1A). We used LCM, a technology capable of precise, RNA-safe microdissection at a single-cell resolution to prepare samples of the fixed tissue and extract high quality RNA for amplification and labeling. A minimum gap of 10 μm was used between the two dissected regions to avoid overlap and contamination between the subpopulations of sampled cells. One lens from each animal was used for LCM microdissection and RNA extraction; the lens from the contra-lateral eye was used to define the position of the GFP border by microscopy (Fig. 1A and B).
The high quality mRNA extracted from LCM microdissected lens tissue ensured successful amplification, labeling and reproducibility of microarray profiles. Linear RNA amplification of the samples used a T7-RNA polymerase-based technique, which is widely used for labeling of the low-yield RNA samples recently [19,20]. Despite concerns raised about possible alteration in the original transcript abundance during the amplification steps, recent studies showed that the ratios of gene expression levels in similarly amplified samples remained intact [29–31]. The results of qPCR verification of our micro-array data fully support these conclusions and thus assessment of differential gene expression using RNA amplification can be performed with a high degree of confidence. Microarray data from three independent biological experiments were analyzed using the NIA ANOVA tool and SAM software to determine significantly differentially expressed genes. Genes that met the criteria (see Section 2) set for both methods and showed expression differences exceeding 2-fold are presented in Tables 2 and 3. We found that 65 genes were differentially expressed in excess of 2-fold in the maturing fibers cells compared with young elongating fibers. About 25% of genes were activated in maturing fibers; 75% were downregulated. Differential expression was verified for a group of randomly selected genes using quantitative RT-PCR (Table 4).
The differentiation of lens fiber cells involves extensive metabolic, morphologic and functional changes [32]. Because the lens is an avascular tissue, metabolic activity gradually decreases in fibers that became buried inside the tissue and lose direct exposure to the nutritious ocular humors. These gradual changes should be reflected as differences between the two transcriptional profiles we obtained in this study. Indeed, the expression of many genes encoding metabolic enzymes was decreased in the buried, maturing fibers (Table 3).
In contrast to gradual changes in metabolism-related genes, fiber maturation implies turning on a specific group of pathways for cell remodeling. It is now widely appreciated that fiber cell differentiation utilizes components of the apoptotic machinery (including caspases 3, 6 and 8) while controlling the extent of apoptosis with anti-apoptotic proteins [33–37]. Despite a well-documented activity of apoptotic proteases in the developing lens [4,5], transcriptional activation of the corresponding genes is not necessarily correlated with cell differentiation in time (Bassnett, personal communication). This discrepancy can be explained by the fact that major apoptotic “effector” proteases are activated post-translationally via enzymatic cleavage of inactive pro-proteins rather then at the transcriptional level [38,39]. The microarray analysis revealed several classes of apoptosis-related genes that were activated transcriptionally during fiber maturation (Table 2). For example, expression of Gadd45b, the upstream activator of p38 in the TGFβ-induced apoptotic pathway [40], was activated (3.9-fold) in maturing fibers. Additionally, Dlad expression was elevated 2.85-fold in maturing fibers, reflecting transcriptional activation of this pathway prior to the start of organelle loss. DLAD (DNase II-like acid DNase, also called DNase IIbeta) is responsible for the degradation of nuclear DNA in apoptosis and during lens cell differentiation [5,34]; alteration of this process causes nuclear cataract [41,42]. Further, expression of the co-chaperone transcript Bag3 was elevated in the maturing fibers. Bag3 participates in apoptosis regulation by interacting with several apoptosis-modulating factors. Bag3 overexpression has been shown to inhibit apoptosis induced via Bax or Fas pathways in the HeLa cell line [43] and by IL-3 deprivation in the murine hematopoietic cell line 32D [44]. At the same time, BAG3 downregulation enhanced the apoptotic response to chemotherapy in human primary B chronic lymphocytic leukemia cells [45]. Our data confirm previous reports that the balance of specific pro- and anti-apoptotic signals modulates lens fiber maturation and identifies potential mediators of apoptosis in the developing lens.
During lens fiber maturation, the protein-permeable inter-cellular communication pathway is initiated, leading to the formation of a true syncytium in the lens core [6,7]. This developmentally regulated pathway is likely facilitated by cell–cell fusions. [6]. Cell–cell fusions, which utilize molecular machinery distinct from the SNARE-regulated fusion of vesicles, are the focus of numerous studies as they are also intimately involved in forming developmental syncytia in gametes, osteoclasts, macrophages, placenta trophoblasts and skeletal muscle [46]. We examined our data for the evidence of transcriptional activation of previously identified as well as potential fusogenic proteins that may be implicated in lens syncytium formation. Unexpectedly, our data did not show transcriptional activation of the potentially “fusogenic” genes ITGNB1, MFR, CD47 and Adam12 in the maturing fibers. However, the CD9 and Pacsin3 both showed 2-fold increased expression (Tables 2 and 4). CD9 has been demonstrated to play a critical role in regulating myoblast and gamete fusion [47,48] and Pacsin3 is known to bind and activate potentially fusogenic Adam12, implicated in fusion of myoblasts and osteoclasts [49]. These data suggest that a CD9-mediated fusion pathway is active in the lens and that Adam12 activity may also be involved in this process via Pacsin3 but that it may be regulated at the post-translational level.
An intriguing feature of maturing lens fibers is the large up-regulation of the Stx11 gene (4.75-fold), a member of the SNARE family. SNAREs are small coiled-coil proteins required for specific membrane fusion events and are associated with secretory and endocytic pathways in eukaryotic cells [50]. Despite their previous implication only in vesicle fusion, a recent study raised the theoretical possibility that Stx11 facilitates plasma membrane fusion [51]. Alternatively, maturing fibers might activate Stx11-mediated secretory pathways upon physical disconnection from the awashing ocular humors at the end of the elongation phase. In conclusion, the described changes in the gene expression profiles in this study reflected a shift in cell physiology, characteristic of the beginning of fiber maturation process. Our analysis suggests that genes previously shown to be implicated cell fusion are likely to be regulated post-translationally in the lens and have identified potentially novel players in syncytium-forming pathways. Future work will define the role of these genes in the developing lens.
Acknowledgments
We thank Dr. Vladimir Vincek for his expert technical assistance and the gift of the UM FIX solution, Dr. Chia-Yang Liu for expert advice in histology preparations, Dr. Abigail Hackam for the help with the manuscript preparation and the staff of the DNA Microarray Core Facility University of Miami for high quality microarray hybridizations and data preparation. This study was supported by NIH Grants R01-EY14232 (V.S.), a Research to Prevent Blindness (RPB) Career Development Award (V.S.), an unrestricted Grant to the Department of Ophthalmology from RPB and an unrestricted Grant P30-EY014801 to the Bascom Palmer Eye Institute.
References
- 1.Bhat SP. The ocular lens epithelium. Biosci Rep. 2001;21:537–600. doi: 10.1023/a:1017952128502. Review. [DOI] [PubMed] [Google Scholar]
- 2.Piatigorsky J.1981Lens differentiation in vertebrates. A review of cellular and molecular features Differentiation 19134187Review. [DOI] [PubMed] [Google Scholar]
- 3.Beebe DC, Compart PJ, Johnson MC, Feagans DE, Feinberg RN. The mechanism of cell elongation during lens fiber cell differentiation. Dev Biol. 1982;92:54–63. doi: 10.1016/0012-1606(82)90149-x. [DOI] [PubMed] [Google Scholar]
- 4.Bassnett S, Beebe DC. Coincident loss of mitochondria and nuclei during lens fiber cell differentiation. Dev Dyn. 1992;194:85–93. doi: 10.1002/aja.1001940202. [DOI] [PubMed] [Google Scholar]
- 5.Bassnett S. Lens organelle degradation. Exp Eye Res. 2002;74:1–6. doi: 10.1006/exer.2001.1111. Review. [DOI] [PubMed] [Google Scholar]
- 6.Shestopalov VI, Bassnett S. Expression of autofluorescent proteins reveals a novel protein permeable pathway between cells in the lens core. J Cell Sci. 2000;113:1913–1934. doi: 10.1242/jcs.113.11.1913. [DOI] [PubMed] [Google Scholar]
- 7.Shestopalov VI, Bassnett S. Development of a macromolecular diffusion pathway in the lens. J Cell Sci. 2003;116:4191–4200. doi: 10.1242/jcs.00738. [DOI] [PMC free article] [PubMed] [Google Scholar]
- 8.Bassnett S, Beebe DC. Localization of insulin-like growth factor-1 binding sites in the embryonic chicken eye. Invest Ophthalmol Vis Sci. 1990;31:1637–1680. [PubMed] [Google Scholar]
- 9.Beebe DC, Parmelee JT, Belcher KS. Volume regulation in lens epithelial cells and differentiating lens fiber cells. J Cell Physiol. 1990;143:455–464. doi: 10.1002/jcp.1041430308. [DOI] [PubMed] [Google Scholar]
- 10.Shestopalov VI, Bassnett S. Three-dimensional organization of primary lens fiber cells. Invest Ophthalmol Vis Sci. 2000;41:859–922. [PubMed] [Google Scholar]
- 11.Mansergh FC, Wride MA, Walker VE, Adams S, Hunter SM, Evans MJ. Gene expression changes during cataract progression in Sparc null mice: differential regulation of mouse globins in the lens. Mol Vis. 2004;10:490–511. [PubMed] [Google Scholar]
- 12.Wride MA, Mansergh FC, Adams S, Everitt R, Minnema SE, Rancourt DE, Evans MJ. Expression profiling and gene discovery in the mouse lens. Mol Vis. 2003;9:360–396. [PubMed] [Google Scholar]
- 13.Segev F, Mor O, Segev A, Belkin M, Assia EI. Downregulation of gene expression in the ageing lens: a possible contributory factor in senile cataract. Eye. 2005;19:80–85. doi: 10.1038/sj.eye.6701423. [DOI] [PubMed] [Google Scholar]
- 14.Hawse JR, Hejtmancik JF, Huang Q, Sheets NL, Hosack DA, Lempicki RA, Horwitz J, Kantorow M. Identification and functional clustering of global gene expression differences between human age-related cataract and clear lenses. Mol Vis. 2003;9:515–552. [PMC free article] [PubMed] [Google Scholar]
- 15.Ruotolo R, Grassi F, Percudani R, Rivetti C, Martorana D, Maraini G, Ottonello S. Gene expression profiling in human age-related nuclear cataract. Mol Vis. 2003;9:538–586. [PubMed] [Google Scholar]
- 16.Hadjantonakis AK, Gertsenstein M, Ikawa M, Okabe M, Nagy A. Generating green fluorescent mice by germline transmission of green fluorescent ES cells. Mech Dev. 1998;76:79–90. doi: 10.1016/s0925-4773(98)00093-8. [DOI] [PubMed] [Google Scholar]
- 17.Todd R, Lingen MW, Kuo WP. Gene expression profiling using laser capture microdissection. Expert Rev Mol Diagn. 2002;2:497–507. doi: 10.1586/14737159.2.5.497. Review. [DOI] [PubMed] [Google Scholar]
- 18.Eltoum IA, Siegal GP, Frost AR. Microdissection of histologic sections: past, present, and future. Adv Anat Pathol. 2002;9:316–338. doi: 10.1097/00125480-200209000-00006. Review. [DOI] [PubMed] [Google Scholar]
- 19.Van Gelder RN, von Zastrow ME, Yool A, Dement WC, Barchas JD, Eberwine JH. Amplified RNA synthesized from limited quantities of heterogeneous cDNA. Proc Natl Acad Sci USA. 1990;87:1663–1670. doi: 10.1073/pnas.87.5.1663. [DOI] [PMC free article] [PubMed] [Google Scholar]
- 20.Carter MG, Hamatani T, Sharov AA, Carmack CE, Qian Y, Aiba K, Ko NT, Dudekula DB, Brzoska PM, Hwang SS, Ko MS. In situ-synthesized novel microarray optimized for mouse stem cell and early developmental expression profiling. Genome Res. 2003;13:1011–1032. doi: 10.1101/gr.878903. [DOI] [PMC free article] [PubMed] [Google Scholar]
- 21.Kamme F, Zhu J, Luo L, Yu J, Tran DT, Meurers B, Bittner A, Westlund K, Carlton S, Wan J. Single-cell laser-capture microdissection and RNA amplification. Methods Mol Med. 2004;99:215–238. doi: 10.1385/1-59259-770-X:215. [DOI] [PubMed] [Google Scholar]
- 22.Kelz MB, Dent GW, Therianos S, Marciano PG, McIntosh TK, Coleman PD, Eberwine JH. Single-cell antisense RNA amplification and microarray analysis as a tool for studying neurological degeneration and restoration. Sci Aging Knowledge Environ. 2002;9 doi: 10.1126/sageke.2002.1.re1. Review. [DOI] [PubMed] [Google Scholar]
- 23.Shestopalov VI, Missey H, Bassnett S. Delivery of genes and fluorescent dyes into cells of the intact lens by particle bombardment. Exp Eye Res. 2002;74:639–688. doi: 10.1006/exer.2002.1191. [DOI] [PubMed] [Google Scholar]
- 24.Kamme F, Salunga R, Yu J, Tran DT, Zhu J, Luo L, Bittner A, Guo HQ, Miller N, Wan J, Erlander M. Single-cell microarray analysis in hippocampus CA1: demonstration and validation of cellular heterogeneity. J Neurosci. 2003;23:3607–3622. doi: 10.1523/JNEUROSCI.23-09-03607.2003. [DOI] [PMC free article] [PubMed] [Google Scholar]
- 25.Shestopalov VI, Bassnett S. Exogenous gene expression and protein targeting in lens fiber cells. Invest Ophthalmol Vis Sci. 1999;40:1435–1478. [PubMed] [Google Scholar]
- 26.Tusher VG, Tibshirani R, Chu G. Significance analysis of microarrays applied to the ionizing radiation response. Proc Natl Acad Sci USA. 2001;98:5116–5137. doi: 10.1073/pnas.091062498. [DOI] [PMC free article] [PubMed] [Google Scholar]
- 27.Khatri P, Draghici S, Ostermeier GC, Krawetz SA. Profiling gene expression using onto-express. Genomics. 2002;79:266–336. doi: 10.1006/geno.2002.6698. [DOI] [PubMed] [Google Scholar]
- 28.Draghici S, Khatri P, Martins RP, Ostermeier GC, Krawetz SA. Global functional profiling of gene expression. Genomics. 2003;81:98–104. doi: 10.1016/s0888-7543(02)00021-6. [DOI] [PubMed] [Google Scholar]
- 29.Baugh LR, Hill AA, Brown EL, Hunter CP. Quantitative analysis of mRNA amplification by in vitro transcription. Nucleic Acids Res. 2001;29:e29. doi: 10.1093/nar/29.5.e29. [DOI] [PMC free article] [PubMed] [Google Scholar]
- 30.Pabon C, Modrusan Z, Ruvolo MV, Coleman IM, Daniel S, Yue H, Arnold LJ., Jr Optimized T7 amplification system for microarray analysis. Biotechniques. 2001;31:874–879. doi: 10.2144/01314mt05. [DOI] [PubMed] [Google Scholar]
- 31.Poirier GMC, Erlander MG. Postdifferential display: parallel processing of candidates using small amounts of RNA. Methods. 1998;16:444–452. doi: 10.1006/meth.1998.0699. [DOI] [PubMed] [Google Scholar]
- 32.Bassnett, S. and Beebe, D.C. (2004) in: Development of the Ocular Lens Lovicu (Lovicu, F.J. and Robinson, M.L., Eds.), Cambridge University Press, Cambridge, UK.
- 33.Bassnett S. Fiber cell denucleation in the primate lens. Invest Ophthalmol Vis Sci. 1997;38:1678–1765. [PubMed] [Google Scholar]
- 34.Bassnett S, Mataic D. Chromatin degradation in differentiating fiber cells of the eye lens. J Cell Biol. 1997;137:37–49. doi: 10.1083/jcb.137.1.37. [DOI] [PMC free article] [PubMed] [Google Scholar]
- 35.Dahm R, Gribbon C, Quinlan RA, Prescott AR. Changes in the nucleolar and coiled body compartments precede lamina and chromatin reorganization during fibre cell denucleation in the bovine lens. Eur J Cell Biol. 1998;75:237–283. doi: 10.1016/S0171-9335(98)80118-0. [DOI] [PubMed] [Google Scholar]
- 36.Dahm R. Lens fibre cell differentiation – a link with apoptosis? Ophthalmic Res. 1999;31:163–246. doi: 10.1159/000055530. Review. [DOI] [PubMed] [Google Scholar]
- 37.Wride MA, Parker E, Sanders EJ. Members of the bcl-2 and caspase families regulate nuclear degeneration during chick lens fibre differentiation. Dev Biol. 1999;213:142–198. doi: 10.1006/dbio.1999.9375. [DOI] [PubMed] [Google Scholar]
- 38.Shi Y. Caspase activation: revisiting the induced proximity model. Cell. 2004;117:855–863. doi: 10.1016/j.cell.2004.06.007. Review. [DOI] [PubMed] [Google Scholar]
- 39.Danial NN, Korsmeyer SJ. Cell death: critical control points. Cell. 2004;116:205–224. doi: 10.1016/s0092-8674(04)00046-7. Review. [DOI] [PubMed] [Google Scholar]
- 40.Yoo J, Ghiassi M, Jirmanova L, Balliet AG, Hoffman B, Fornace AJ, Jr, Liebermann DA, Bottinger EP, Roberts AB. Transforming growth factor-beta-induced apoptosis is mediated by Smad-dependent expression of GADD45b through p38 activation. J Biol Chem. 2003;278:43001–43008. doi: 10.1074/jbc.M307869200. [DOI] [PubMed] [Google Scholar]
- 41.Evans CJ, Aguilera RJ. DNase II: genes, enzymes and function. Gene. 2003;322:1–15. doi: 10.1016/j.gene.2003.08.022. Review. [DOI] [PubMed] [Google Scholar]
- 42.Nishimoto S, Kawane K, Watanabe-Fukunaga R, Fukuyama H, Ohsawa Y, Uchiyama Y, Hashida N, Ohguro N, Tano Y, Morimoto T, Fukuda Y, Nagata S. Nuclear cataract caused by a lack of DNA degradation in the mouse eye lens. Nature. 2003;424:1071–1075. doi: 10.1038/nature01895. [DOI] [PubMed] [Google Scholar]
- 43.Lee JH, Takahashi T, Yasuhara N, Inazawa J, Kamada S, Tsujimoto Y. Bis, a Bcl-2-binding protein that synergizes with Bcl-2 in preventing cell death. Oncogene. 1999;18:6183–6190. doi: 10.1038/sj.onc.1203043. [DOI] [PubMed] [Google Scholar]
- 44.Antoku K, Maser RS, Scully WJ, Jr, Delach SM, Johnson DE. Isolation of Bcl-2 binding proteins that exhibit homology with BAG-1 and suppressor of death domains protein. Biochem Biophys Res Commun. 2001;286:1003–1010. doi: 10.1006/bbrc.2001.5512. [DOI] [PubMed] [Google Scholar]
- 45.Romano MF, Festa M, Pagliuca G, Lerose R, Bisogni R, Chiurazzi F. BAG3 protein controls B-chronic lymphocytic leukaemia cell apoptosis. Cell Death Differ. 2003;10:383–385. doi: 10.1038/sj.cdd.4401167. [DOI] [PubMed] [Google Scholar]
- 46.Jahn R, Lang T, Sudhof TC. Membrane fusion. Cell. 2003;112:519–542. doi: 10.1016/s0092-8674(03)00112-0. Review. [DOI] [PubMed] [Google Scholar]
- 47.Kaji K, Oda S, Miyazaki S, Kudo A. Infertility of CD9-deficient mouse eggs is reversed by mouse CD9, human CD9, or mouse CD81; polyadenylated mRNA injection developed for molecular analysis of sperm-egg fusion. Dev Biol. 2002;247:327–361. doi: 10.1006/dbio.2002.0694. [DOI] [PubMed] [Google Scholar]
- 48.Tachibana I, Hemler ME. Role of transmembrane 4 superfamily (TM4SF) proteins CD9 and CD81 in muscle cell fusion and myotube maintenance. J Cell Biol. 1999;146:893–904. doi: 10.1083/jcb.146.4.893. [DOI] [PMC free article] [PubMed] [Google Scholar]
- 49.Mori S, Tanaka M, Nanba D, Nishiwaki E, Ishiguro H, Higashiyama S, Matsuura N. PACSIN3 binds ADAM12/meltrin alpha and up-regulates ectodomain shedding of heparin-binding epidermal growth factor-like growth factor. J Biol Chem. 2003;278:46029–46063. doi: 10.1074/jbc.M306393200. [DOI] [PubMed] [Google Scholar]
- 50.Ungar D, Hughson FM. SNARE protein structure and function. Annu Rev Cell Dev Biol. 2003;19:493–517. doi: 10.1146/annurev.cellbio.19.110701.155609. Review. [DOI] [PubMed] [Google Scholar]
- 51.Hu C, Ahmed M, Melia TJ, Sollner TH, Mayer T, Rothman JE. Fusion of cells by flipped SNAREs. Science. 2003;300:1745–1754. doi: 10.1126/science.1084909. [DOI] [PubMed] [Google Scholar]