Abstract
Repressor ω regulates transcription of genes required for copy number control, accurate segregation and stable maintenance of inc18 plasmids hosted by Gram-positive bacteria. ω belongs to homodimeric ribbon-helix-helix (RHH2) repressors typified by a central, antiparallel β-sheet for DNA major groove binding. Homodimeric ω2 binds cooperatively to promotors with 7 to 10 consecutive non-palindromic DNA heptad repeats (5′-A/TATCACA/T-3′, symbolized by →) in palindromic inverted, converging (→←) or diverging (←→) orientation and also, unique to ω2 and contrasting other RHH2 repressors, to non-palindromic direct (→→) repeats. Here we investigate with crystal structures how ω2 binds specifically to heptads in minimal operators with (→→) and (→←) repeats. Since the pseudo-2-fold axis relating the monomers in ω2 passes the central C–G base pair of each heptad with ∼0.3 Å downstream offset, the separation between the pseudo-2-fold axes is exactly 7 bp in (→→), ∼0.6 Å shorter in (→←) but would be ∼0.6 Å longer in (←→). These variations grade interactions between adjacent ω2 and explain modulations in cooperative binding affinity of ω2 to operators with different heptad orientations.
INTRODUCTION
Gene expression in prokaryotes is primarily regulated by helix–turn–helix proteins that bind specifically to palindromic operators whereas recognition of arrays of direct or inverted repeats by transcriptional, homodimeric ribbon-helix-helix (RHH2) repressors like ω protein is less frequent (1). Structures are known for RHH2 repressors Arc (2), CopG (3) and MetJ (4) bound to their cognate operators that are bent by 50° to 60°. MetJ2 binds symmetrically to two to five consecutive 8 bp long palindromic repeats. By contrast, CopG2 and Arc2 bind asymmetrically to half sites of palindromic operators that are spaced by 10 and 11 bp, respectively. When bound to these operators, interactions between adjacent RHH2 contribute to high affinity and cooperative association.
Repressor ω is a global regulator of and encoded by broad-host-range and low-copy number plasmids belonging to the inc18 family that are stably maintained in Gram-positive bacteria (5–7). ω was originally isolated from Streptococcus pyogenes plasmid pSM19035 where ω2 controls promoter regions located upstream of genes involved in plasmid copy number control (PcopS), plasmid partitioning (Pδ) and post-segregational killing (Pω) if the plasmid is lost. These promoters comprise arrays of ten, nine or seven consecutive 7 bp repeats (heptads, symbolized by →), organized as: PcopS, (→→←→→←→→←→); Pδ, (→→→→→→→←←) and Pω, (→→←→→←←) (1), see Supplementary Figure 9.
Binding of ω2 to a single heptad or to heptads separated by one or more additional base pair is poor (kD >500 nM), but tight if operators include at least two consecutive heptads and tightens further with increasing number of heptads. In addition, the affinity depends on heptad arrangement as shown by 6-fold reduced affinity of ω2 for diverging repeats (←→) (kD ∼120 nM) compared to heptads in direct (→→) or converging (→←) arrangement (kD ∼20 nM) (8). Multiple repeat binding sites are also found for eukaryotic operators that interact cooperatively with monomeric and therefore asymmetric transcription factors (1). However, these repeats show different base pair spacings and protein–protein interactions in direct and inverted orientation (9).
In wild type (wt) ω2, the N-terminal 20 residues of the 71 residues long ω monomers are probably unstructured as suggested by secondary structure prediction (10) and were cleaved during crystallization (Δ20ω2). The structure features a typical RHH-fold comprising a 2-fold symmetrical β-sheet with antiparallel pairing of residues 28–32 of each monomer followed by α-helices α1 (34–46) and α2 (51–66) (11).
We describe here the crystal structures of an N-terminal deletion mutant (see Results) with 19 residues removed, hereafter Δ19ω, in complex with two minimal operators comprising two heptads in (→→) and (→←) arrangement. It was of interest to elucidate the structural determinants for high specificity, affinity and cooperative binding of ω repressor to minimal binding sites and to extrapolate these to natural operators with different heptad arrangements.
Unintentionally, both complexes cocrystallized with free operator DNA. Free (→→)-DNA allowed us to compare structural changes in DNA induced by repressor binding, whereas free (→←)-DNA was ill-defined in the electron density and could not be fully modeled. The complex between Δ19ω2 and (←→)-DNA dissociated during gel filtration and could not be crystallized.
MATERIALS AND METHODS
Plasmid construction
For expression of Δ19ω in Escherichia coli, wt ω gene missing the first 19 codons was cloned into NcoI–BamHI-cleaved pET28a (Novagen) to render pET28a-Δ19ω. The described (1) pHP14-borne ω gene (pHP14ω) was modified to pHP14Δ19ω containing promoter Pω, the ribosomal binding site and the Met start codon fused to codon 20 of ω gene. pHP14ω mutants pHP14ωThr29Ala and pHP14ωHis38Val were generated by site-directed mutagenesis. The plasmids were transferred into Bacillus subtilis strain BG511 (Pω:lacZ, recA4) as described (1).
β-galactosidase assay
β-galactosidase assays (Table 1) were performed as described (1) except that the centrifuged B.subtilis cells were resuspended and lysed by the addition of 0.1% SDS (final concentration 0.0025%) and chloroform.
Preparation of protein–DNA complexes
Δ19ω2 was expressed in E.coli according to (1), the cell paste was resuspended in buffer A [50 mM Tris–HCl (pH 7.5), 50 mM NaCl] and lysed (French Press). The crude extract was processed (1), except that after the phosphocellulose step the fractions were pooled, diluted 5-fold with buffer A and loaded on a POROS 20 HE column (Applied Biosystems). Δ19ω2 was eluted with 50–1000 mM NaCl gradient in buffer A. Concentrated fractions were gel filtrated on Superdex75 (GE Healthcare) run with buffer B [20 mM Tris–HCl (pH 7.5), 300 mM NaCl].
Complementary oligonucleotides were purified by high-performance liquid chromatography (HPLC), mixed at 1:1 molar ratio, hybridized and purified using a MonoQ column (GE Healthcare). Eluted DNA was dialyzed against 20 mM Tris–HCl (pH 7.5), 100 mM KCl and 30 mM NaCl. Δ19ω2 was added at 2.1:1 molar ratio and purified by gelfiltration (SuperdexS75). Fractions of Δ19ω2/DNA were concentrated to 10.5 mg/ml for crystallization.
Crystallization
Using hanging-drop vapor diffusion, crystals with space group C2 grew from drops made of 2 µl of [Δ19ω2]2-(→→) solution or 2 µl of [Δ19ω2]2-(→→) (bp A9–T6′ exchanged by bp G9–C6′) solution and 2–3 µl precipitant solution [150 mM KH2PO4 (pH 7.0), 2.4 M Na2-malonate, 2% 6-amino-caproic acid].
Crystals of [Δ19ω2]2-(→←) grew in space group P21 under similar conditions when precipitant solution contained 150 mM Na/KPO4 (pH 7.0), 2.4 M Na2-malonate and 2 to 3% 2-methyl-2,4-pentanediol. In all cases crystal quality was improved by micro-seeding.
Data collection, structure determination and refinement
X-ray data were collected at 100 K at the Protein Structure Factory beamline BL14.1 of Free University Berlin at BESSY and processed with HKL2K (12); Table 2.
The structure of [Δ19ω2]2-(→→) was determined by molecular replacement in PHASER (13) with Δ20ω2 (PDB code 1IRQ) modeled to 8 bp idealized B-DNA. After manual building of [Δ19ω2]2-(→→) and restrained refinement in REFMAC5 (14), Fo-Fc maps showed additional electron density for another DNA molecule but not for additional Δ19ω2. This second DNA molecule was build manually starting from ideal B-form DNA. In the final model the asymmetric unit consists of one [Δ19ω2]2-(→→) and one free (→→)-DNA. Δ19ω molecules A′ and B could be modeled with all residues 19–71, but A and B′ only with residues 23–71 and 25–71, respectively, see Figures 1 and 2 for assignment of A, A′, B, B′.
Figure 1.
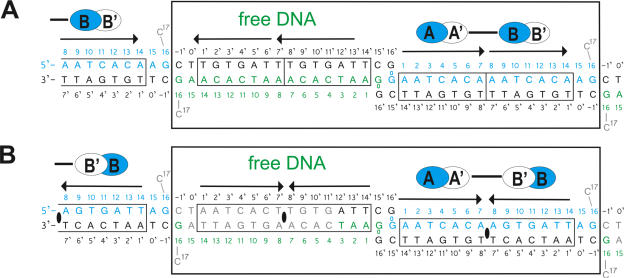
DNA used for cocrystallization and arrangement of (A) [Δ19ω2]2-(→→) and (B) [Δ19ω2]2-(→←) and free DNAs in the crystal asymmetric units (large boxes). Subunits sharing the same protein–DNA interactions Δ19ωA/B shown in blue and Δ19ωA′/B′ in white ovals. Solid bars indicate subunits interacting through helices α1, α1′. The pseudo-2-fold axis relating Δ19ω2 and bound heptads in [Δ19ω2]2-(→←) indicated by black ellipses in (B). Heptads with sequence 5′-AATCACA/T-3′ outlined by arrows, and nucleotides are numbered 0 to 17 and −1′ to 16′, respectively. Top strands of free DNA in green. Grey nucleotides C17 in both structures and 4 to 15 bp of free DNA in [Δ19ω2]2-(→←) could not be modeled due to poor electron density.
Figure 2.
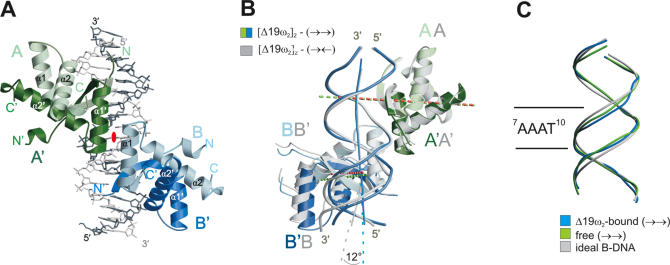
(A) Structure of [Δ19ω2]2-(→→). DNA backbone trace in light grey for top strand and dark grey for bottom strand, see Figure 1. Δ19ω monomers A/A′ and B/B′ in light and dark green and blue, respectively, helices α1 and α2 labeled with white letters. Helices α1′ of A′ and α1 of B related by a pseudo-2-fold axis perpendicular to the paper plane (red ellipse) form the Δ19ω2···Δ19ω2 interface. (B) Superimposition of Δ19ωA/A′ of [Δ19ω2]2-(→→) (green) and Δ19ωA/A′ of [Δ19ω2]2-(→←) (grey) to show slight positional differences of Δ19ω B/B′ associated with palindromic symmetry in (→←). Pseudo-2-fold axes relating monomers in Δ19ω2 indicated by dashed lines colored green for [Δ19ω2]2-(→→) and red for [Δ19ω2]2-(→←). Helices α1, α1′ involved in Δ19ω2···Δ19ω2 interactions superimpose well allowing cooperative binding in both complexes. DNA in [Δ19ω2]2-(→←) is locally kinked by 12° at the centre (bp G11–C4′) of heptad A8–T14, and Δ19ω2 are ∼0.6 Å closer (vertical distance between pseudo-2-fold axes) than in [Δ19ω2]2-(→→), see text. (C) Phosphate backbone of the 14 bp operator regions of operator DNA free (→→) in green and Δ19ω2-bound (→→) in blue superimposed on ideal B-DNA (grey).
The structure determination of [Δ19ω2]2-(→→) mutant with bp A9–T6′ replaced by bp G9–C6′ used difference Fourier technique applied to the isomorphous crystal structure of [Δ19ω2]2-(→→), see Table 2.
The structure of [Δ19ω2]2-(→←) was determined in MOLREP (15) using [Δ19ω2]2-(→→) as search model. One [Δ19ω2]2-(→←) was found, and after restrained refinement sparse electron density indicated only four additional bases for free (→←)-DNA that could not be modeled completely, Figure 1B. Molecule B′ could be modeled with all residues, B with residues 25–71 and A, A′ with residues 22–71.
For refinement of all three structures in Refmac5 TLS groups were assigned and refined for each polypeptide chain and oligonucleotide, see Table 2 for statistics. No non-crystallographic symmetry was used during refinements. Model quality was examined by Whatcheck and Procheck (16) showing that φ, ψ torsion angles of most amino acids in all three structures are within the most favored, some are in additionally allowed and none are in forbidden areas of the Ramachandran plot. Figures were generated with MOLSCRIPT (17) and Raster3D (18). Analysis of DNA parameters used program Curves (19).
RESULTS
Δ19ω2 protein
Cocrystallization of wt ω2 with operator DNA yielded only crystals with poor X-ray diffraction, but was successful with Δ19ω. In vitro, Δ19ω2 binds specifically to promoter PcopS with 2-fold lower affinity (kD ∼12 nM) (see Supplementary Figure 10) compared to wt ω2 (kD ∼6 nM) (8), and likewise plasmid-borne Δ19ω gene product represses Pω utilization in vivo 2-fold weaker compared to wt ω gene (Table 1). This suggests that even without the N-terminal 19 residues, ω2 still binds strongly (only 2-fold weaker) and specifically to DNA heptads in both, in vitro and in vivo gene regulation.
Table 1.
Utilization of Pω:lacZ in the presence of ω variants in B.subtilis cells
| Gene provided in trans | β-galactosidase activity |
|---|---|
| Pω:lacZ | |
| None | 310 |
| pHP14 (control) | 298 |
| ω | 7 |
| Δ19ω | 13 |
| ωThr29Ala | 314 |
| ωHis38Val | 52 |
The β-galactosidase activity is expressed in Miller units.
Crystal unit cells contain free and Δ19ω2 bound operator DNA
The crystal structures of Δ19ω2 bound to two minimal operators formed by 17 bp DNAs with C, G overhangs and comprising direct (→→) and inverted (→←) heptads (Figures 1 and 2) were determined by molecular replacement at 2.45 and 2.6 Å resolution, respectively (Table 2). The asymmetric units of both complexes contain two Δ19ω2 bound to operator DNAs ([Δ19ω2]2-(→→) and [Δ19ω2]2-(→←)) which in turn interact with the ends to free operator DNAs (→→) and (→←), respectively, to form pseudo-continuous DNA (Figures 1 and 3).
Table 2.
Crystallographic data and refinement statistics
| [Δ19ω2]2-(→→)≡(→→) | [Δ19ω2]2-(→←)≡(→←) | [Δ19ω2]2-(→→)≡(→→) A9–T6′ replaced by G9–C6′ | |
|---|---|---|---|
| Space group | C2 | P21 | C2 |
| Unit cell parameters (Å) | 44.6, 75.0, 219.4 | 76.0, 42.5, 103.7 | 44.6, 76.1, 220.0 |
| β (°) | β = 108.8 | β = 107.16 | β = 109.3 |
| Resolution range (Å) | 30.0–2.45 | 30.0–2.6 | 30.0–2.9 |
| Observed reflections | 83 105 | 46 759 | 38 486 |
| Unique reflections | 25 244 | 18 516 | 14 113 |
| Completeness (%)a | 97.4 (81.7) | 92.8 (72.2) | 88.7 (72.1) |
| 〈I/σ(I)〉a | 12.7 (3.0) | 11.7 (3.1) | 12.1 (2.5) |
| Rsym (%)a,b | 6.4 (38) | 11.3 (29) | 10.3 (37) |
| Refinement statistics | |||
| Total atoms | 3189 | 2609 | 3134 |
| Solvent atoms | 72 | 51 | 32 |
| Rwork (%) | 22.7 | 22.5 | 24.3 |
| Rfree (%) | 26.0 | 25.9 | 27.4 |
| Root mean square deviationsc | |||
| Bond lengths (Å) | 0.011 | 0.009 | 0.014 |
| Bond angles (°) | 1.4 | 1.1 | 1.5 |
| B factors (Å2) | 1.6 | 1.7 | 1.6 |
| B factorsd | |||
| Δ19ω A, B, A′, B′ (Å2) | 41.6, 43.2, 44.8, 40.2 | 30.8, 32.3, 33.0, 36.4 | 38.0, 39.7, 37.6, 43.5 |
| [Δ19ω2]2-bound DNA (Å2) | 44.1, 41.9 | 34.9, 34.6 | 41.4, 38.2 |
| Free DNA (Å2) | 75.8, 82.0 | Free DNA incomplete | 65.8, 85.3 |
aValues in parentheses refer to the outer resolution shell.
b, where Ihkl is the observed intensity and <I> is the average intensity obtained from multiple observations of symmetry-related reflections.
cComputed with PROCHECK.
dAverage B factors calculated for all atoms in each chain.
Figure 3.
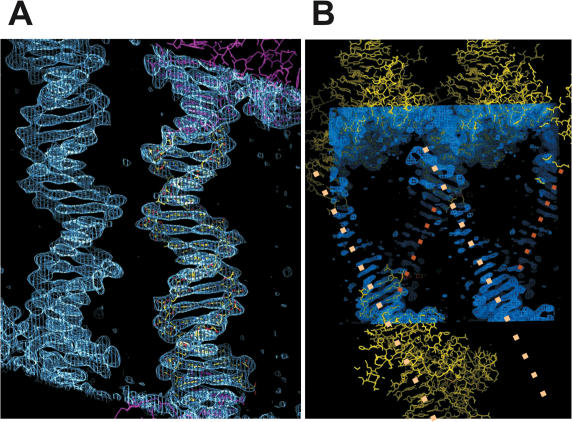
2F0-Fc electron density distribution contoured at 1.2 σ level; view perpendicular to crystallographic b, c planes with the c-axes vertically oriented. (A) Parallel free DNAs (yellow) in [Δ19ω2]2-(→→)≡(→→) are at ∼5 Å shortest distance to each other and stack at both ends with Δ19ω2-bound DNAs (magenta). Free DNA is not involved in any further crystal contacts. (B) Discontinous electron density for free DNA in [Δ19ω2]2-(→←)≡(→←). Modeled complexes of [Δ19ω2]2-(→←) and modeled bases of free DNA (see Figure 1B) in yellow. The central parts of free DNA marked by dotted lines (4 to 15 bp, Figure 1B) could not be modeled due to patchy electron density. The shortest distance between free DNAs is ∼8 Å and they are at an angle of ∼40°.
On the ‘left’ sides of free DNA (Figure 1), nucleotides C17 of free and Δ19ω2-bound DNA are not in helical arrangement and not seen in the electron density as they are disordered but were confirmed by MALDI-TOF-spectrometry of dissolved crystals (data not shown). Both, [Δ19ω2]2-bound and free DNAs, stack with bp G16–C-1′ that are related by pseudo-2-fold symmetry.
On the ‘right’ sides of free DNA (Figure 1), the two 3′-G16′ overhangs lie in the minor groove of the adjacent duplex and interact with both 5′-G0 to form two consecutive G16′*(G0–C15′) base-triplets (Supplementary Figure 11) with similar geometry as reported (20–22).
In the crystals of Δ19ω2 bound to (→→) in space group C2 and bound to (→←) in space group P21 (Table 2), both [Δ19ω2]2–DNA complexes interact by protein–protein contacts to form layers parallel to the crystallographic a, b planes. The crystallographic a, b-axes in space group P21 correspond to b, a-axes in C2 thus reflecting space group and lattice packing similarities. The pseudo-continuous DNA helices (Figures 1 and 3) are oriented in c-direction. The doubled c-axis in C2 relative to that in P21 is due to the C-centering, and the DNA helices are parallel to the c-axis at shortest inter-helix distance of ∼5 Å in [Δ19ω2]2-(→→)≡(→→) (base-triplets indicated by ≡), possibly stabilized by bridging water. By contrast, in [Δ19ω2]2-(→←)≡(→←) the pseudo-continuous DNA helices are parallel to the crystallographic a, c plane but inclined at an angle of ∼40° towards the c-axis and at least ∼8 Å apart, and poor electron density (Figure 3B) indicates that they are partially disordered as shown by B factors >100 Å2. Consequently, bp 4 to 15 of free (→←)-DNA in [Δ19ω2]2-(→←)≡(→←) could not be modeled (Figures 1B and 3B).
In both crystal unit cells (space groups C2 and P21, Table 2), the DNA-bound Δ19ω2 show minor structural changes compared to the X-ray structure of free Δ20ω2 (11). This concerns the loop connecting α-helices α1 and α2 [residues 46–48, 2.0 Å root mean square (r.m.s.) deviation for superimposed Cα-Atoms] and to a minor extent the β-sheet (residues 27–32, 0.8 Å r.m.s. deviation).
Since gel permeation chromatography of [Δ19ω2]2-(→→) at 20 mM Tris–HCl (pH 7.5), 150 mM NaCl indicated an apparent molecular mass of 40 kDa (calculated Mw = 33.4 kDa), we assume that under crystallization conditions with 2.4 M Na2-malonate, the complexes associate pairwise through base-triplets G16′*(G0–C15′) to form the complex [Δ19ω2]2-(→→)≡(→→)-[Δ19ω2]2. If one [Δ19ω2]2-(→→) of this complex forms layers mediated by protein–protein contacts as in the present structures, it appears that the other [Δ19ω2]2-(→→) has to release [Δ19ω2]2 for packing reasons, thereby giving rise to the crystallized [Δ19ω2]2-(→→)≡(→→). The other crystal contact with only DNA–DNA stacking interactions is more flexible than the base-triplets and permits formation of a regular crystal lattice. The same crystallization scenario applies for [Δ19ω2]2-(→←).
Protein–DNA interactions
Formation of G16′*(G0–C15′) base-triplets induces distortions at the 5′ ends of heptads A1–A7 as indicated by different, partly water-mediated interactions to Δ19ω2 compared to heptads A8–A14 in (→→) and A8–T14 in (→←), Figures 4 and 5. For this reason, we focus here on protein–DNA interactions for the less distorted dimer Δ19ωB/B′ bound to heptad A8–A14 of [Δ19ω2]2-(→→) (Figures 2A and 4(left)). In both structures, for each Δ19ω2-bound heptad the direct (not water-mediated) protein–DNA contacts are comparable.
Figure 4.
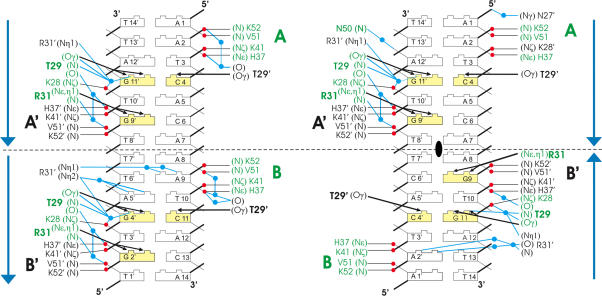
Schematic representation of interactions between Δ19ω2 and DNA in [Δ19ω2]2-(→→) (left) and [Δ19ω2]2-(→←) (right). The orientation of heptads is indicated by blue arrows and palindromic symmetry by the black ellipse. Yellow bases specifically interact with Δ19ω2. Residues labeled green for Δ19ω A/B and black for Δ19ω A′/B′. Hydrogen bonds to phosphate oxygens (red) in thin black lines, specific hydrogen bonds to bases in the major groove in black arrows, blue lines indicate water (blue dots) mediated hydrogen bonds. K28 (K28′) and Arg31 (Arg31′) interact differently in subunits A/B and A′/B′.
Figure 5.
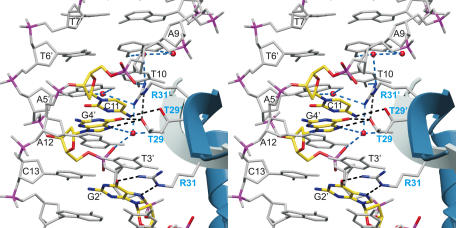
Stereo view of specific interactions between Δ19ω B/B′ and bound heptad A8–A14 in [Δ19ω2]2-(→→). Water molecules; red spheres, hydrogen bonds; dashed lines, phosphorus atoms; magenta, directly contacted bp C11–G4′ and base G2′ in yellow.
In the major grooves, base pair specific interactions are formed with Thr29 and Arg31 located on the β-sheet. Thr29Oγ and Thr29′Oγ of Δ19ωB and B′ bind specifically to the central bp G4′–C11, and Arg31Nɛ,η hydrogen bond with base G2′ (Figure 4(left)). In contrast, the corresponding Arg31′ of Δ19ωB′ hydrogen bonds with Nɛ′ to Thr29Oγ of Δ19ωB and with Nη1′,η2′ through three water molecules to bases G4′, A5′ and A9, Figures 4 and 5.
To see whether Δ19ω2 would bind symmetrically to a palindromic heptad featuring two G to provide both, Arg31 and Arg31′, with potential binding partners, we determined the 2.9 Å resolution crystal structure of [Δ19ω2]2 in complex with a mutated (→→) where bp A9–T6′ was replaced by G9–C6′ (heptad sequence: 8AGTCACA14, Table 2). However, the same interaction pattern was found as in the original heptad. This agrees with similar (2-fold weaker) binding of wt ω2 to mutated (→→) with the same replacement in the first heptad (1AGTCACA7) compared to the original operator (8). A referee suggested to test the binding of Δ19ω2 to heptads with pseudo-palindromic symmetry, 5′-TGTCACA-3′. In view of the binding geometry of Δ19ω2 to 8AGTCACA14, we question whether this would provide novel knowledge. This is because the 5′-AAT- or 5′-AGT-ends of the heptads contact Δ19ω2 in all cases exclusively through unspecific interactions with phosphate groups or are mediated by water molecules (Figure 4A and B). Hence, base pair exchanges in this part of the heptads should not significantly affect binding of Δ19ω2.
Backbone phosphates of all four heptads contact helices α1 and α2 of Δ19ω subunits with pseudo-2-fold symmetry (Figure 4). In Δ19ωB, the 5′-phosphate of A9 caps the N-terminus of α2 by hydrogen bonding to peptide amides of V51 and K52 in a pattern known for RHH2 proteins and other repressors (4,23), and His37Nε, K41Nζ of α1 bind to the 5′-phosphate of T10. Corresponding residues of Δ19ωB′ interact with 5′-phosphates of G2′ and T3′. However, K28Nζ located on the β-sheet of Δ19ωB forms a salt-bridge with the 5′-phosphate of G4′ whereas K28′Nζ on Δ19ωB′ is >5 Å away from the corresponding 5′-phosphate of C11.
The asymmetry in the binding of each Δ19ω2 to its particular heptad is reflected by superimposition of Cα atoms of monomers (A on A′ and B on B′, Figure 2A) in each Δ19ω2 showing 0.6 Å r.m.s. deviation partly associated with structural differences in the loops connecting helices α1 and α2 (residues 46–48) and in the β-strands. When Δ19ω2 dimers are superimposed on each other in the same orientation (A on B and A′ on B′), i.e. the bound heptads point in the same direction, r.m.s. deviation of only 0.3 Å confirms that all Δ19ω2-heptad interactions are similar.
Thr29 is essential for specific operator binding
To test the importance of Thr29 for heptad sequence recognition in vivo studies were conducted showing that ω2Thr29Ala failed to completely repress promoter Pω utilization (Table 1). Binding of ω2Thr29Ala to PcopS operator DNA embedded in 300 bp DNA was tested by electrophoretic mobility shift assays (EMSA) (Supplementary Figure 10). Protein–DNA complexes formed with Δ19ω2 but ωThr29Ala required ∼100-fold higher concentration (compared to Δ19ω2) that yielded prominent but unspecific binding to PcopS as confirmed by DNase I footprinting (data not shown).
Δ19ω2···Δ19ω2 interactions
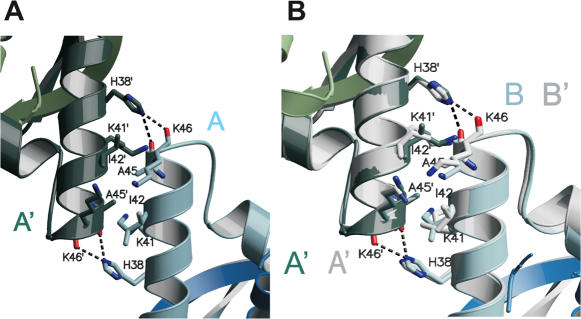
Protein–DNA interactions in both complexes bury 1610 Å2 of solvent accessible surface area. Another 550 Å2 are buried by interaction of pseudo-2-fold axis related α1 helices of adjacent monomers A′ and B in [Δ19ω2]2-(→→) and A′ and B′ in [Δ19ω2]2-(→←), respectively (Figure 1 and Figure 2A and B). In detail, bifurcated hydrogen bonds between His38Nε and Ala45′O/Lys46′O are augmented by hydrophobic contacts between Ile42, Ala45 of both subunits (Figure 6). Positions of His38 and His38′ are identical in both complexes whereas the hydrophobic side-chain of Ile42 adopts different rotamers without affecting the size of the buried interface. These interactions ensure cooperative binding when several ω2 associate with multiple heptad repeats as found in natural operators.
Figure 6.
Interactions at the Δ19ω2···Δ19ω2 interface (A) between helices α1′ and α1 of subunits A′ and B of [Δ19ω2]2-(→→), (see Figure 2A). The Δ19ω2 are related by a pseudo-2-fold axis perpendicular to the paper plane (red ellipse). Residues with contacts <4 Å to neighbor helix are depicted with side-chains, colors as in Figure 2. Bifurcated hydrogen bonds between His38 (His38′) and Ala45O/Lys46O to Ala45′O/Lys46′O of the other subunit in dashed lines. (B) Superimposition as in Figure 2B with view on the dimer–dimer interface to show that dimer–dimer interactions are comparable in both structures.
To test the importance of His38, plasmid-borne ωHis38Val was constructed to remove the bifurcated hydrogen bonds but to maintain the hydrophobic character of the interface. ω2His38Val repressed Pω utilization in vivo with ∼7-fold lower efficiency than wt ω2 (Table 1), indicating the important role of His38 for cooperative binding between ω2 and multiple consecutive heptads.
Conformation of free and Δ19ω2-bound DNA
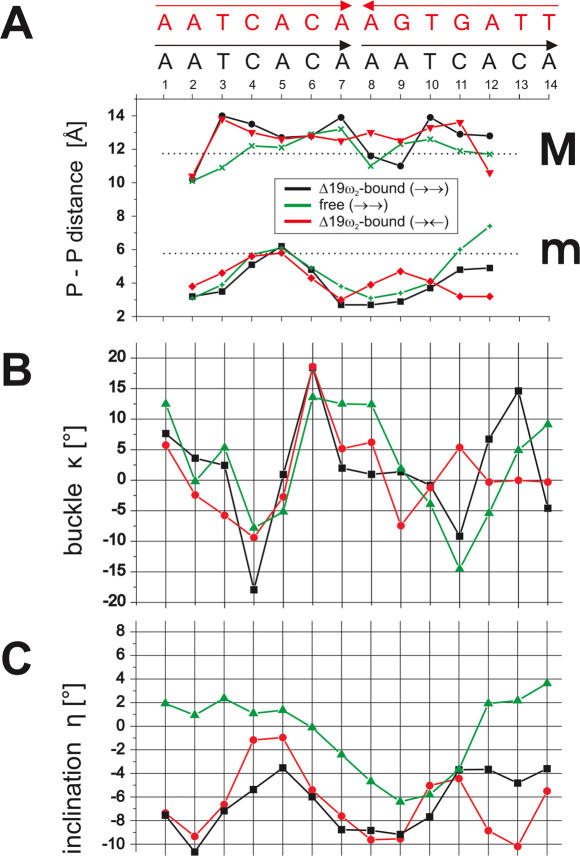
The DNAs in [Δ19ω2]2-(→→) and [Δ19ω2]2-(→←) are nearly straight B-form with average helical twist of 36° (range 23° to 43°; Supplementary Figure 12), but show distinct features. The major groove width in [Δ19ω2]2-(→→) shows strong modulation depending on nucleotide sequence, being ∼13 to ∼14 Å except for the 7AAAT10 tract (∼11 to 12 Å) compared to 11.7 Å for ideal B-DNA (24). In contrast, the major groove width in [Δ19ω2]2-(→←) is more continuous (∼13 to ∼14 Å) due to the palindromic symmetry (Figure 7A). In the 7AAAT10 tract of [Δ19ω2]2-(→→) and in the 7AAGT10 tract of [Δ19ω2]2-(→←) the minor groove is narrowed to ∼2.7 and ∼4 Å, respectively, compared to 5.7 Å in ideal B-DNA (24) due to an average negative base pair inclination of −8° (Figure 7C), as frequently found for A-tracts (25). This is associated in 7AAAT10 of [Δ19ω2]2-(→→) with binding of a single spine of four water molecules, one in each base step as reported in (26). Strong opposite buckles of the C–G bp in the 4CAC6 (−15°, 15°) and 11CAC13 (−10°, 15°) segments of [Δ19ω2]2-(→→) (Figure 7B) widen the major groove to ∼13 Å to accommodate the β-sheet, and adjacent (up- and downstream) minor grooves are narrowed (Figure 7A). Similarly, in [Δ19ω2]2-(→←) the C–G bp in segment 4CAC6 show comparable buckles of −10°, 19° but in 9GTG11 the buckles are reduced to −8°, 5°. Of the four heptads, three feature two subsequent CA steps that are known for their ability to bend B-DNA through positive roll (20,27,28). However, the CA steps do not exhibit unusual structure except for a moderate slide movement of ∼1 Å at the central C–G bp where Δ19ω2 binds to both bases (Supplementary Figure 12).
Figure 7.
Comparison of operator DNA free and in complex with Δ19ω2. (A) Minor (m) and major (M) groove widths along the central 11 bp of each operator, as measured by shortest P-P distances (less two phosphate group radii, 5.8 Å) indicated by horizontal dotted black lines for ideal B-DNA (24), 5.7 Å and 11.7 Å, respectively, Note minor groove narrowing in the 7AAAT10 tract of in Δ19ω2-bound and free (→→) DNA and reduced narrowing in 7AAGT10 tract of (Δ19ω2)2-(→←). (B) Base pair buckle κ (°) and (C) inclination angles η (°) of each operator.
In the crystal lattice, free (→→)-DNA contacts Δ19ω2-bound (→→)-DNA with both ends to form pseudo-continuous helices (Figure 1) and is not distorted by any further crystal contacts (Figure 3A). Interestingly, free (→→)-DNA shows comparable structural features as found for Δ19ω2-bound (→→)-DNA (Figure 2C). In the 7AAAT10 tract of free (→→)-DNA, base pair inclination angles are negative, and the minor groove is narrowed to ∼3.5 Å whereas the major groove is overall widened to an average of 12.5 Å. Additionally, strong opposite buckles are observed for C–G base pair in both CAC segments that are comparable to Δ19ω2-bound (→→)-DNA (Figure 7B). These observations suggest that the described significant deviations from ideal B-DNA are a consequence of nucleotide sequence and not induced by binding to Δ19ω2 (Figures 2C and 7).
However, conformational changes upon repressor binding concern base pair parameters helical twist, roll and slide (Supplementary Figure 12). In free (→→)-DNA these parameters cluster around values assigned to ideal B-DNA, but show a negative roll of ∼−6° and positive slide of ∼1 Å for the central G11′–C4 and G4′–C11 bp of both heptads, and helical twist angles for bp A5–T10′ and A12–T3′ decrease to ∼25° in Δ19ω2-bound (→→)-DNA. Since these deviations are similar for both heptads of [Δ19ω2]2-(→→) they can be attributed to Δ19ω2 binding. Such comparison is not possible with free (→←)-DNA as it could not be modeled completely.
Comparison of [Δ19ω2]2-(→→) and [19ω2]2-(→←)
The pseudo-2-fold axis relating the monomers in Δ19ω2 passes with ∼0.3 Å downstream (5′→3′) offset through the central G–C bp of each heptad. Consequently, these symmetry axes are separated by 7 bp in [Δ19ω2]2-(→→) but they are 0.6 Å closer in [Δ19ω2]2-(→←), see Figure 2B. Despite the different dimer–dimer separations helices α1 and α1′ forming the Δ19ω2…Δ19ω2 interfaces superimpose well in both complexes, consistent with similar dissociation constants (kD ∼20 nM). In contrast, the separation between the two Δ19ω2 will be ∼0.6 Å wider in diverging heptads [Δ19ω2]2-(←→). Assuming that the interaction pattern between Δ19ω2 and heptads with (←→) orientation is similar as with (→→) and (→←) heptad orientations, the expected ∼0.6 Å longer α1···α1 contacts are probably less favorable and diminish cooperativity. This agrees with the 6-fold weaker affinity of wt ω2 to heptads in (←→) arrangement, the finding that [Δ19ω2]2-(←→) dissociated during gel filtration, and the drastically reduced binding affinity to heptad repeats spaced by one or more additional base pair (8).
Whereas DNA in [Δ19ω2]2-(→→) is nearly straight, the superimposition in Figure 2B reveals a kink of ∼12° at the G11–C4′ bp at the centre of the heptad bound to dimer B/B′ of [Δ19ω2]2-(→←). This kink is associated with ∼12° rotation of dimer B/B′ of [Δ19ω2]2-(→←), the rotational pivot point being located in the Δ19ω2···Δ19ω2 interface. By virtue of these two motions, the position and orientation of helix α1′ of subunit B′ remain almost as in [Δ19ω2]2-(→→) and similar Δ19ω2···Δ19ω2 interactions explain comparable dissociation constants of both complexes.
Structural model of ω2-bound to natural operators
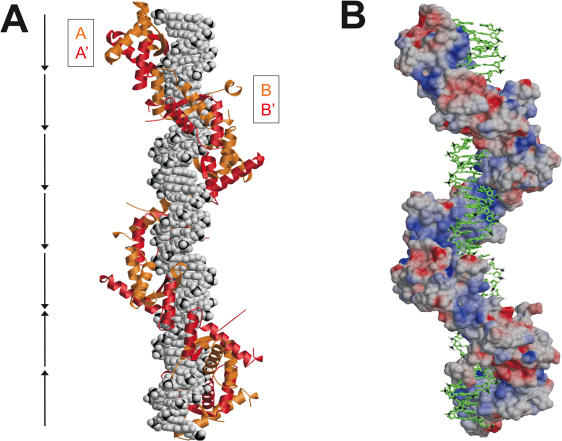
Extrapolation of the structures of [Δ19ω2]2-(→→) and [Δ19ω2]2-(→←) allowed modeling of Δ19ω2 in complex with natural Pδ promoter (Figure 8). The model implies that wt ω2 binds as left-handed matrix to right-handed, straight B-type operator DNA, each Δ19ω2 being displaced relative to its neighbor by ∼7 bp and rotated by 252°. Figure 8B shows that the negatively charged sugar-phosphate backbone of DNA faces positively charged surface of Δ19ω2.
Figure 8.
Model of seven Δ19ω2-bound heptads (→→→→→←←) of the natural promoter Pδ. (A) DNA in space filling and Δ19ω2 as orange/red ribbons, (B) DNA in stick and Δ19ω2 in surface representation colored according to electrostatic potential (negative and positive charges red and blue, respectively). The model is based on the structures of [Δ19ω2]2-(→→) and [Δ19ω2]2-(→←). Repressors form a left-handed protein-matrix winding around the nearly straight operator.
DISCUSSION
Implications of Δ19ω2-DNA structures for regulation of transcription
The inc18 family plasmids harbor genes to control their copy number, accurate segregation and stable maintenance during cell division. Since expression of these genes is regulated by the common ω2 repressor, a unique mechanism has evolved to fine-tune repressor affinity for the different operators. How this is achieved is shown by the present study. It clearly indicates that the pseudo-symmetric ω2 binds with 0.3 Å downstream (5′→3′) offset relative to the center G–C base pair of the cognate heptad. Since the operators are nearly straight B-DNA, different heptad numbers and orientations lead to different distances between α1 helices of adjacent ω2, thereby modulating cooperative interactions between ω2 and different operators. The ability to bind to palindromic as well as to non-palindromic operators is a unique feature of ω2 and is not shared by other member of the RHH2 family. We associate this with the interactions between Δ19ω2 that are related by a pseudo-2-fold rotation axis (Figure 2A and Figure 6A and B) so that they interact comparably, no matter what the orientations of adjacent heptads are, (→→), (→←) or (←→). It is unlikely that the deleted N-termini would contribute to Δ19ω2 ···Δ19ω2 interactions as the N-termini of Δ19ω2 point away from the Δ19ω2 ···Δ19ω2 interface (Figures 2A and 6A).
When RHH2 bind to DNA, we have to consider two different binding characteristics, the ‘variable’ binding of flexible side-chains of β-sheets and α1 helices to major groove and phosphate groups, respectively, and ‘stiff’ capping of N-termini of α2 helices by rigid main-chain NH hydrogen bonding to phosphates. Although Arc2, CopG2 and MetJ2 bend minimal cognate operators with two repressor binding sites by 50 to 60°, their cores do not rearrange significantly compared to free repressors and are structurally similar [r.m.s. deviations for superimposed Cα atoms 1.0 to 1.5 Å (3)]. In contrast, Arc2, CopG2 and MetJ2 superimpose on DNA-bound Δ19ω2 with higher r.m.s. deviations of 2.3 to 2.8 Å because the β-sheet of Δ19ω2 protrudes ∼3 Å less from the repressor surface and is closer to the N-termini of helices α2 (Supplementary Figure 13). Due to this geometry of Δ19ω2, the N-termini of helices α2 are in the correct position to clamp the phosphate backbones of straight operator DNA when the β-sheet is inserted into the major groove (Figures 2 and 4). In contrast, the other three repressors have to bend DNA around the more protruding β-sheet to place the phosphate backbone in hydrogen bonding distance to N-H groups of the N-termini of their helices α2. It is notable that the distances between phosphates bound by α2 helices is 5 bp in ω2 (Figure 4) but 6 bp in the other three RHH2 since DNA has to follow a longer path when bending around the protruding β-sheet.
The N-termini of RHH2 proteins are associated with different functions
The N-terminus in CopG2 has no obvious function, in MetJ2 it is involved in binding the corepressor S-adenosylmethionine whereas in free Arc2 it is disordered but forms a 310 helix upon and contributes to DNA-binding. The N-terminal residues in ω2 do not contribute to DNA-binding in vitro and in vivo as shown in the present work. However, we have recently shown that protein δ, a homolog to ParA proteins and involved in active plasmid partitioning during cell division, is activated by wt ω2 but not by Δ19ω2 (A. Cicek, F. Pratto, W. Weihofen, J.C. Alonso and W. Saenger, unpublished data). This suggests that ω2 is the yet missing ParB protein of inc18 family plasmids in the known ParA/ParB family of plasmid partitioning systems (29).
Direct and indirect readout of DNA sequence
Cocrystallized Δ19ω2-bound and free (→→)-DNA show similar phosphate backbone conformation (Figure 2C) with significant deviations from ideal B-DNA (Figure 7), indicating that conformation is predominantly dependent on DNA sequence and not induced by Δ19ω2 binding. This provides a good example for the ‘indirect’ readout of local DNA conformation by Δ19ω2 that depends on the particular nucleotide sequence (30). The combination with ‘direct’ readout resulting from interactions of ω2 repressor amino acids with heptad bases increases protein–DNA-binding specificity and affinity. This view is consistent with studies in which the heptad nucleotide sequence was mutated base pair by base pair (8). Mutations at heptad positions 2, 3 and 5 (5′-AATCACA-3′) resulted in at least 4-fold weaker binding to wt ω2, although these base pair are not directly contacted by repressor side-chains contrasting direct read out positions 4 and 6 that were much more sensitive against mutations.
Protein Data Bank accession codes
Atomic coordinates and structure factors have been deposited with the Protein Data Bank under accession codes 2bnw, 2bnz and 2cax.
SUPPLEMENTARY DATA
Supplementary Data are available at NAR Online.
Supplementary Material
Acknowledgments
The authors acknowledge beamtime and technical support at the Protein Structure Factory beamlines of Free University Berlin at BESSY/Berlin. This work was partially supported by Fonds der Chemischen Industrie to W.S., BMC2003-00150 from Dirección General de Investigación, Ministerio de Educación y Ciencia to J.C.A., and QLK3-CT-2001-00277 from the European Community to J.C.A. and W.S. Funding to pay the Open Access publication charges for this article was provided by Free University Berlin.
Conflict of interest statement. None declared.
REFERENCES
- 1.de la Hoz A.B., Ayora S., Sitkiewicz I., Fernandez S., Pankiewicz R., Alonso J.C., Ceglowski P. Plasmid copy-number control and better-than-random segregation genes of pSM19035 share a common regulator. Proc. Natl Acad. Sci. USA. 2000;97:728–733. doi: 10.1073/pnas.97.2.728. [DOI] [PMC free article] [PubMed] [Google Scholar]
- 2.Raumann B.E., Rould M.A., Pabo C.O., Sauer R.T. DNA recognition by β-sheets in the Arc repressor-operator crystal structure. Nature. 1994;367:754–757. doi: 10.1038/367754a0. [DOI] [PubMed] [Google Scholar]
- 3.Gomis-Ruth F.X., Sola M., Acebo P., Parraga A., Guasch A., Eritja R., Gonzalez A., Espinosa M., del Solar G., Coll M. The structure of plasmid-encoded transcriptional repressor CopG unliganded and bound to its operator. EMBO J. 1998;17:7404–7415. doi: 10.1093/emboj/17.24.7404. [DOI] [PMC free article] [PubMed] [Google Scholar]
- 4.Somers W.S., Phillips S.E. Crystal structure of the met repressor-operator complex at 2.8 A resolution reveals DNA recognition by β-strands. Nature. 1992;359:387–393. doi: 10.1038/359387a0. [DOI] [PubMed] [Google Scholar]
- 5.Brantl S. The copR gene product of plasmid pIP501 acts as a transcriptional repressor at the essential repR promoter. Mol. Microbiol. 1994;14:473–483. doi: 10.1111/j.1365-2958.1994.tb02182.x. [DOI] [PubMed] [Google Scholar]
- 6.Pujol C., Chedin F., Ehrlich S.D., Janniere L. Inhibition of a naturally occurring rolling-circle replicon in derivatives of the τ-replicating plasmid pIP501. Mol. Microbiol. 1998;29:709–718. doi: 10.1046/j.1365-2958.1998.00940.x. [DOI] [PubMed] [Google Scholar]
- 7.Ceglowski P., Boitsov A., Chai S., Alonso J.C. Analysis of the stabilization system of pSM19035-derived plasmid pBT233 in Bacillus subtilis. Gene. 1993;136:1–12. doi: 10.1016/0378-1119(93)90441-5. [DOI] [PubMed] [Google Scholar]
- 8.de la Hoz A.B., Pratto F., Misselwitz R., Speck C., Weihofen W., Welfle K., Saenger W., Welfle H., Alonso J.C. Recognition of DNA by ω protein from the broad-host range Streptococcus pyogenes plasmid pSM19035: analysis of binding to operator DNA with one to four heptad repeats. Nucleic Acids Res. 2004;32:3136–3147. doi: 10.1093/nar/gkh633. [DOI] [PMC free article] [PubMed] [Google Scholar]
- 9.Glass C.K. Differential recognition of target genes by nuclear receptor monomers, dimers, and heterodimers, Endocr. Rev. 1994;15:391–407. doi: 10.1210/edrv-15-3-391. [DOI] [PubMed] [Google Scholar]
- 10.Misselwitz R., de la Hoz A.B., Ayora S., Welfle K., Behlke J., Murayama K., Saenger W., Alonso J.C., Welfle H. Stability and DNA-binding properties of the ω regulator protein from the broad-host range Streptococcus pyogenes plasmid pSM19035. FEBS Lett. 2001;505:436–440. doi: 10.1016/s0014-5793(01)02865-4. [DOI] [PubMed] [Google Scholar]
- 11.Murayama K., Orth P., de la Hoz A.B., Alonso J.C., Saenger W. Crystal structure of ω transcriptional repressor encoded by Streptococcus pyogenes plasmid pSM19035 at 1.5 A resolution. J. Mol. Biol. 2001;314:789–796. doi: 10.1006/jmbi.2001.5157. [DOI] [PubMed] [Google Scholar]
- 12.Otwinowski Z., Minor W. Processing of X-ray diffraction data collected in oscillation mode. In: Carter C.W. Jr, Sweet R.M., editors. Macromolecular Crystallography Part A. Academic Press; 1997. pp. 307–326. [DOI] [PubMed] [Google Scholar]
- 13.Storoni L.C., McCoy A.J., Read R.J. Likelihood-enhanced fast rotation functions. Acta Crystallogr. D Biol. Crystallogr. 2004;60:432–438. doi: 10.1107/S0907444903028956. [DOI] [PubMed] [Google Scholar]
- 14.Murshudov G.N., Vagin A.A., Dodson E.J. Refinement of macromolecular structures by the maximum- likelihood method. Acta. Crystallogr. D Biol. Crystallogr. 1997;53:240–255. doi: 10.1107/S0907444996012255. [DOI] [PubMed] [Google Scholar]
- 15.Vagin A., Teplyakov A. MOLREP: an automated program for molecular replacement. J. Appl. Cryst. 1997;30:1022–1025. [Google Scholar]
- 16.Laskowski R.A., MacArthur M.W., Moss D.S., Thornton J.M. PROCHECK: a program to check the stereochemical quality of protein structures. J. Appl. Cryst. 1993;26:283–291. [Google Scholar]
- 17.Kraulis P.J. MOLSCRIPT: a program to produce both detailed and schematic plots of protein structures. J. Appl. Cryst. 1991;24:946–950. [Google Scholar]
- 18.Merritt E.A., Bacon D.J. Raster3D: photorealistic molecular graphics. Meth. Enzymol. 1997;277:505–524. doi: 10.1016/s0076-6879(97)77028-9. [DOI] [PubMed] [Google Scholar]
- 19.Lavery R., Sklenar H. The definition of generalized helicoidal parameters and of axis curvature for irregular nucleic acids. J. Biomol. Struct. Dyn. 1988;6:63–91. doi: 10.1080/07391102.1988.10506483. [DOI] [PubMed] [Google Scholar]
- 20.Schultz S.C., Shields G.C., Steitz T.A. Crystal structure of a CAP–DNA complex: the DNA is bent by 90 degrees. Science. 1991;253:1001–1007. doi: 10.1126/science.1653449. [DOI] [PubMed] [Google Scholar]
- 21.Spink N., Nunn C.M., Vojtechovsky J., Berman H.M., Neidle S. Crystal structure of a DNA decamer showing a novel pseudo four-way helix–helix junction. Proc. Natl Acad. Sci. USA. 1995;92:10767–10771. doi: 10.1073/pnas.92.23.10767. [DOI] [PMC free article] [PubMed] [Google Scholar]
- 22.Nunn C.M., Garman E., Neidle S. Crystal structure of the DNA decamer d(CGCAATTGCG) complexed with the minor groove binding drug netropsin. Biochemistry. 1997;36:4792–4799. doi: 10.1021/bi9628228. [DOI] [PubMed] [Google Scholar]
- 23.Aggarwal A.K., Rodgers D.W., Drottar M., Ptashne M., Harrison S.C. Recognition of a DNA operator by the repressor of phage 434: a view at high resolution. Science. 1988;242:899–907. doi: 10.1126/science.3187531. [DOI] [PubMed] [Google Scholar]
- 24.Saenger W. Principles of Nucleic Acid Structure. NY: Springer-Verlag; 1984. [Google Scholar]
- 25.Shatzky-Schwartz M., Arbuckle N.D., Eisenstein M., Rabinovich D., Bareket-Samish A., Haran T.E., Luisi B.F., Shakked Z. X-ray and solution studies of DNA oligomers and implications for the structural basis of A-tract-dependent curvature. J Mol. Biol. 1997;267:595–623. doi: 10.1006/jmbi.1996.0878. [DOI] [PubMed] [Google Scholar]
- 26.Han G.W., Kopka M.L., Cascio D., Grzeskowiak K., Dickerson R.E. Structure of a DNA analog of the primer for HIV-1 RT second strand synthesis. J. Mol. Biol. 1997;269:811–826. doi: 10.1006/jmbi.1997.1085. [DOI] [PubMed] [Google Scholar]
- 27.Chen S., Gunasekera A., Zhang X., Kunkel T.A., Ebright R.H., Berman H.M. Indirect readout of DNA sequence at the primary-kink site in the CAP–DNA complex: alteration of DNA binding specificity through alteration of DNA kinking. J. Mol. Biol. 2001;314:75–82. doi: 10.1006/jmbi.2001.5090. [DOI] [PubMed] [Google Scholar]
- 28.El Hassan M.A., Calladine C.R. Two distinct modes of protein-induced bending in DNA. J.Mol. Biol. 1998;282:331–343. doi: 10.1006/jmbi.1998.1994. [DOI] [PubMed] [Google Scholar]
- 29.Pogliano J. Dynamic cellular location of bacterial plasmids. Curr. Opin. Microbiol. 2002;5:586–590. doi: 10.1016/s1369-5274(02)00370-3. [DOI] [PubMed] [Google Scholar]
- 30.Otwinowski Z., Schevitz R.W., Zhang R.G., Lawson C.L., Joachimiak A., Marmorstein R.Q., Luisi B.F., Sigler P.B. Crystal structure of trp repressor/operator complex at atomic resolution. Nature. 1988;335:321–329. doi: 10.1038/335321a0. [DOI] [PubMed] [Google Scholar]
Associated Data
This section collects any data citations, data availability statements, or supplementary materials included in this article.


