Abstract
Withdrawal reflexes of the mollusk Aplysia exhibit sensitization, a simple form of long-term memory (LTM). Sensitization is due, in part, to long-term facilitation (LTF) of sensorimotor neuron synapses. LTF is induced by the modulatory actions of serotonin (5-HT). Pettigrew et al. developed a computational model of the nonlinear intracellular signaling and gene network that underlies the induction of 5-HT-induced LTF. The model simulated empirical observations that repeated applications of 5-HT induce persistent activation of protein kinase A (PKA) and that this persistent activation requires a suprathreshold exposure of 5-HT. This study extends the analysis of the Pettigrew model by applying bifurcation analysis, singularity theory, and numerical simulation. Using singularity theory, classification diagrams of parameter space were constructed, identifying regions with qualitatively different steady-state behaviors. The graphical representation of these regions illustrates the robustness of these regions to changes in model parameters. Because persistent protein kinase A (PKA) activity correlates with Aplysia LTM, the analysis focuses on a positive feedback loop in the model that tends to maintain PKA activity. In this loop, PKA phosphorylates a transcription factor (TF-1), thereby increasing the expression of an ubiquitin hydrolase (Ap-Uch). Ap-Uch then acts to increase PKA activity, closing the loop. This positive feedback loop manifests multiple, coexisting steady states, or multiplicity, which provides a mechanism for a bistable switch in PKA activity. After the removal of 5-HT, the PKA activity either returns to its basal level (reversible switch) or remains at a high level (irreversible switch). Such an irreversible switch might be a mechanism that contributes to the persistence of LTM. The classification diagrams also identify parameters and processes that might be manipulated, perhaps pharmacologically, to enhance the induction of memory. Rational drug design, to affect complex processes such as memory formation, can benefit from this type of analysis.
INTRODUCTION
Biochemical and gene networks are complex systems with multiple nonlinear interactions among signaling molecules and genes. This complexity often makes understanding and predicting network behaviors nonintuitive (1–3). One of the key goals of systems biology is to develop tools that may lead to a better understanding of nonlinear behaviors of biochemical and gene networks at both the molecular and systems levels (4).
A gene and protein network can be described by a mathematical model consisting of ordinary differential equations (ODEs). Bifurcation analysis is a mathematical technique that enables determination of the stability of a system with respect to a parameter (5,6). Bifurcation diagrams describe the dependence of a state variable on a continuous change in a chosen system parameter, termed a bifurcation parameter. A bifurcation is said to take place when there is a change in the number or the stability of solutions of a system. For example, steady-state solutions for the values of the dependent variables may appear, disappear, change stability, or multiple steady-state solutions may coexist. The coexistence of multiple steady-state solutions at a particular value of a bifurcation parameter is termed multiplicity (or multistability, if the solutions are stable to small perturbations). Multiplicity may occur with supralinear and positive feedback interactions among components of a system of coupled ODEs, and oscillatory dynamics may be sustained if a negative feedback loop of interactions is present. Singularity theory (for review see (7,8)) provides a systematic framework to determine how many topologically distinct bifurcation diagrams exist in a nonlinear dynamic system, and to partition the multidimensional parameter space of the model into regions in which different types of bifurcation diagrams exist. This information can be used to classify control parameters, which play a crucial role in determining system dynamics by governing transitions between qualitatively different bifurcation diagrams.
This study applies bifurcation and singularity analysis to a relatively complex signal transduction and gene network that underlies the induction of long-term memory (LTM) to examine model dynamics and determine control parameters. Sensorimotor neuron synapses of the mollusk Aplysia have been utilized extensively as a model system for the study of the cellular and molecular processes underlying learning and memory (9–13). These synapses exhibit both short- and long-term facilitation after exposure to 5-HT. Long-term facilitation (LTF) requires both activation of protein kinase A (PKA) and transcription. Molecular processes that underlie LTF have been studied in detail (for review see (13)). LTF is a correlate of long-term sensitization (LTS) of Aplysia defensive withdrawal reflexes, a form of long-term memory (LTM) (13–16). Pettigrew et al. (17) developed a mathematical model of biochemical processes that underlie the induction of LTF. The model simulates experimental observations of the time courses of activity of protein kinases essential for LTF, specifically PKA and the MAP kinase isoform termed extracellular-regulated kinase (ERK), after temporally spaced or massed exposures to 5-HT. The model also simulates induction of a gene product (Aplysia ubiquitin hydrolase, or Ap-Uch) that is essential for LTF.
This study addresses the following questions regarding the nonlinear features of the Pettigrew model:
Is a multiplicity of steady states possible?
What key control parameters determine the dynamics of the system?
What distinct steady-state system behaviors exist?
What parameter values might be predicted to enhance the induction of LTF?
Which system behaviors are robust?
Might bifurcation and singularity analysis be helpful to design drugs to improve the induction of memory?
In analyzing the dynamics of the model, this study focuses on the role of a positive feedback loop involving reciprocal induction of PKA activity and Ap-uch gene expression. The results indicate that the positive feedback loop can generate a robust and irreversible switch between a basal steady state of low PKA activity and gene expression, and a stimulated steady state of high PKA activity and gene expression. A prolonged steady state of high gene expression might contribute to the strengthening of synapses between neurons, and therefore to the induction and maintenance of LTM. Singularity theory was used to construct classification diagrams of the parameter space. These diagrams help identify molecular processes that might be manipulated, perhaps pharmacologically, to enhance the induction and maintenance of LTM. These methods of systematic analysis will also be helpful to understand a broad class of complex biological phenomena amenable to modeling, such as development and cellular differentiation (18–23), or the cell cycle (3).
METHODS
The model
For this analysis, the model of Pettigrew et al. (17) was used (see Table 1). The Pettigrew model (17) was developed to study biophysical mechanisms that may be implicated in learning and memory. Analysis of this model shows that it does not exhibit multiplicity of solutions (the coexistence of multiple steady-state solutions) with the parameter values previously published in Pettigrew et al. (17). A goal of this study is to illustrate a methodology for finding various types of bifurcation diagrams and their location in the parameter space. By altering four parameters, i.e., kApSyn, kApSynBasal, Kpka, and Kerk (new values given in Table 1), the model exhibits multiplicity and, therefore, a more diverse set of bifurcation diagrams. With these four new parameter values, the model continues to respond to stimuli as in Pettigrew et al. (17).
TABLE 1.
Long-term memory (LTM) model (17); differential equations of the LTM model and standard parameter values
| Differential equations of the LTM model and standard parameter values | ||
|---|---|---|
| Differential equations for modeling PKA activity after exposure to 5-HT and hydrolysis of PKA R-subunits by Ap-Uch: | ||
| ||
| ||
| ||
| ||
| where | ||
| ||
| Differential equations for modeling REG and pREG dynamics: | ||
| ||
| ||
| ||
| Differential equations for modeling the Raf/MEK/ERK pathway: | ||
| ||
| ||
| ||
| where | ||
| ||
| ||
| ||
| where | ||
| ||
| Differential equations for Ap-Uch synthesis: | ||
| ||
| ||
| ||
| Model parameters and their values: | ||
| Vsyn = 0.002 min−1, kfpka = 105.0 min−1, kAp-Uch = 0.007 min−1, Ap-Uch basal = 0.10, kdpka = 0.00048 min−1, τ = 250 min, kbaspka = 12 min−1, Kreg = 0.00064, ktranslation = 4 min−1, vrphos = 1 min−1, Krphos = 1.5, vdreg = 0.16 min−1, Kdreg = 0.0015, kdsm = 0.02 min−1, vmREG = 2 × 10⁻⁵ min−1, vdmreg = 0.00225 min−1, Kdmreg = 0.01, kdmreg = 3 × 10⁻⁵ min−1, kf,Raf = 0.00345 min−1, kf,MAPKK = 0.7 min−1, kf,ERK = 0.44 min−1, kb,Raf = 0.001 min−1, kb,MAPKK = 0.12 min−1, kb,ERK = 0.12 min−1, [Raftot] = 0.5, [MAPKKtot] = 0.5, [ERKtot] = 0.5, KMK = 0.08, ERKbasal = 0.015, kphos1 = 0.01 min−1, kdephos1 = 1.5 min−1, PPhos = 0.1, kphos2 = 0.005 min−1, kdephos2 = 0.5 min−1, kApSyn = 0.02 min−1, kApSynBasal = 0.0009 min−1, Kpka = 0.2, Kerk = 0.004, kdeg = 0.01 min−1. |
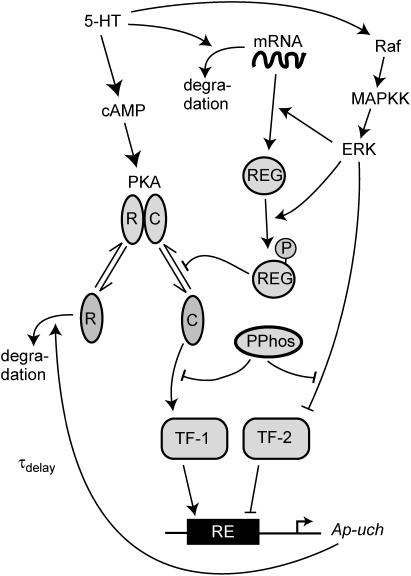
The key biochemical cascades represented by the model are illustrated in Fig. 1. Two transcription factors, TF-1 and TF-2, regulate expression of Ap-uch. When neither TF is phosphorylated, TF-2 represses Ap-uch and TF-1 has no effect. After exposure to 5-HT, ERK phosphorylates TF-2, relieving repression by TF-2, and PKA phosphorylates TF-1, allowing TF-1 to induce Ap-uch. (For further description of the model development and its validation, see (17).) Pettigrew et al. (17) assumed specific molecular identities for the two transcription factors. TF-1 was assumed to be the cAMP response element binding protein (CREB1), and TF-2 was assumed to be CREB2. However, recent results (24) suggest that induction of Ap-uch by 5-HT may not be mediated directly by CREB1 and CREB2, but rather by as yet unidentified transcription factors. Nevertheless, Ap-uch induction is regulated via the cAMP signaling pathway (25), and [cAMP] elevation activates both PKA and ERK in neurons (26,27). Therefore, it remains plausible that PKA and ERK induce Ap-uch by phosphorylating transcription factors, as the model assumes (Fig. 1).
FIGURE 1.
Schematic diagram depicting the model. Serotonin (5-HT) elevates cAMP, which binds to the PKA holoenzyme and initiates dissociation of free catalytic (C) and regulatory (R) subunits. The C subunits phosphorylate the transcription factor TF-1. TF-1 then activates Ap-uch gene expression, resulting in Ap-Uch protein synthesis. By increasing the availability of free ubiquitin, Ap-Uch enhances degradation of R subunits to sustain PKA activation, closing a PKA/TF-1/Ap-Uch positive feedback loop. 5-HT also induces translation and phosphorylation of a hypothetical protein termed REG. REG slows the reassociation of C and R subunits of PKA, sustaining intermediate-term (1–3 h) PKA activation. 5-HT also activates ERK (via Raf and MAPKK), and ERK then phosphorylates TF-2, relieving TF-2's repression of Ap-uch transcription. A basal phosphatase activity dephosphorylates TF-1 and TF-2.
The model consists of a set of 15 nonlinear differential equations (Table 1): 12 ODEs (Eqs. 1 and 5–15) and three time-delay differential equations (DDEs) (Eqs. 2–4). The dynamics of the model can be described by the time course of the activity of the catalytic subunit of PKA (heretofore referred to as PKA activity). The model represents three biochemical pathways essential for the induction of LTF. The first pathway is a positive feedback loop in which PKA phosphorylates the transcription factor TF-1, which in turn enhances the expression of the gene coding for Ap-Uch. Ap-Uch promotes degradation of the regulatory subunit of PKA, releasing a free, active catalytic subunit. The resulting increase in PKA activity closes the positive feedback loop. The second pathway is the cascade in which 5-HT activates ERK, leading to phosphorylation of TF-2, and reinforcing induction of Ap-uch by TF-1. In the third pathway, translation of a hypothetical protein, denoted REG, is induced by 5-HT. REG prolongs PKA activity for ∼1–3 h by preventing free catalytic subunit from reassociating with the regulatory subunit. This intermediate-term prolongation of PKA activity contrasts with the long-term activation of PKA by Ap-Uch, which lasts for >20 h.
In the model, long-term PKA activity is assumed to correlate with LTM. This assumption appears plausible for the following reasons. Inhibition of PKA after 5-HT exposure blocks LTF, which is a correlate of LTM (28). Also, Ap-Uch mediates long-term PKA activation (28), and inhibition of Ap-Uch function or expression blocks LTF (25).
Methods of predicting nonlinear features of the model
The 15 differential equations (Eqs. 1–15, Table 1) can be represented as a vector equation,
 |
(16) |
with initial conditions:  .
.
In Eq. 16,  is a 15-dimensional vector of nonlinear functions; x = ([cAMP], [R], [C], [RC], [REG], [pREG], [mRNAREG], [Raf], [MAPKK], [MAPKKpp], [ERK], [ERKpp], Ppka, Perk, [Ap-Uch])
  is the 15-dimensional vector of system variables; λ is the bifurcation parameter; τ denotes the time delay in Eqs. 2–4; and
  is the 38-dimensional vector of system parameters other than λ (i.e., the kinetic rate constants listed in Table 1). The full parameter space of the model,
  , is defined to include all real values for all parameters including λ. However, a restricted parameter space
  is also defined, which does not include λ, because a principle goal of bifurcation analysis is to subdivide this restricted parameter space into regions that exhibit qualitatively different dynamics when λ is varied. In practice, biochemical constraints (e.g., plausible rate constants and concentrations) constrain the portion of parameter space that is physiologically relevant. The concentration of 5-HT, [5-HT], is selected as the bifurcation parameter λ because [5-HT] is an important extracellular stimulus commonly varied in experiments, including experiments to determine a threshold for persistent PKA activation.
To use bifurcation and singularity theory to analyze the nonlinear properties of this dynamic system, steady states are first obtained by setting dx/dt = 0 in Eq. 16, yielding 15 nonlinear algebraic equations
 |
(17) |
Equation 17 does not contain the time delay τ (in Eq. 16). Although τ has a significant effect on the transient dynamics of the system and might affect the stability of some steady states, it has no effect on the existence of a steady-state solution, or on the existence and location of limit points and singular points in the steady-state bifurcation diagrams. Therefore, setting the time delay τ to zero does not alter the steady-state bifurcation and singularity analysis described in this article. Hence, we simplify the steady-state bifurcation analysis by eliminating τ. We subsequently verify the predictions of the bifurcation analysis by simulation of the full model including the time delay.
Bifurcation diagrams, singularity theory, and classification diagrams
Two bifurcation diagrams are defined to be similar if the number, order, and orientation of the steady-state solutions x change in an identical way as the bifurcation parameter λ is varied. Singularity theory (8,29,30) was used to determine the regions in the restricted parameter space (not including λ) that contain similar bifurcation diagrams, by tracing the region boundaries. Golubitsky and Schaeffer (8) showed that the boundaries consist of one of three types of hypersurfaces: a hysteresis surface (HS), an isola surface, or a double limit set (DLS). When the values of parameters are biochemically constrained to a certain range (e.g., nonnegative concentrations), a fourth type of hypersurface, a boundary limit set (BLS), subdivides the parameter space into allowed and disallowed regions. The hypersurfaces are defined within the full parameter space including λ (Eqs. 19–22, Appendix). However, their projections into the restricted parameter space are used to subdivide the restricted space into regions with qualitatively different bifurcation diagrams. DLS surfaces only exist with bifurcation diagrams displaying five or more steady-state solutions for specific values of the bifurcation parameter. The coexistence of more than three steady states was not observed in this study, and thus, DLS surfaces do not appear to exist in the parameter space of the present model.
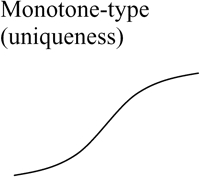
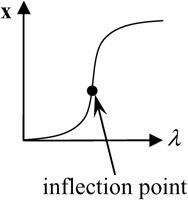
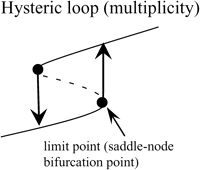
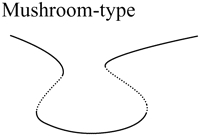
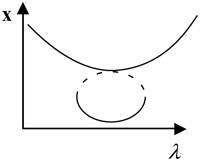
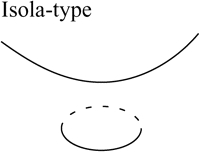
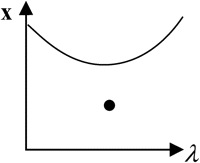
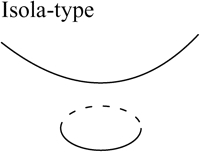
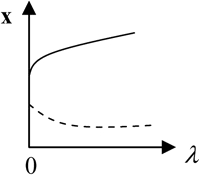
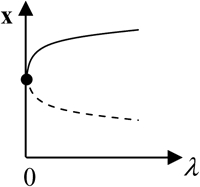
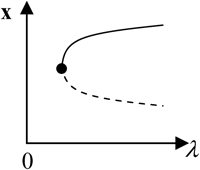
Steady-state singular points or singularities are points in the full parameter space at which the Jacobian of the function f in Eq. 17 (see Appendix) has a zero eigenvalue (7,8). Singular points are defined to be of codimension n, if n−1 parameters, in addition to the bifurcation parameter, are specified to locate the point (see Appendix). A limit point, or saddle-node bifurcation point, is a point on a bifurcation diagram where the number of steady-state solutions changes by two as the bifurcation parameter λ is varied. A limit point is a singular point of codimension-1 because only the bifurcation parameter λ needs to be specified to determine the point (Appendix, Eq. 18). HS, isola, and DLS hypersurfaces are also comprised of singular points. These singular points are of codimension-2, because, to determine the point, two parameters (λ and an additional parameter P1) are specified (Appendix, Eqs. 19, Eqs. 21, and Eqs. 22). Column 3 of Table 2 illustrates the types of bifurcation diagrams that exist at critical singular points on the various boundaries (HS, isola surface, or BLS) between the regions of the restricted parameter space. Columns 2 and 4 of Table 2 display the bifurcation diagrams obtained by universal unfolding of these hypersurfaces, with universal unfolding defined as perturbation away from the surface by a small change of a parameter other than λ (8,31). Unfolding HS leads to two possible scenarios, either a monotonically dependent bifurcation diagram with no limit point, or a hysteretic loop type bifurcation diagram (bistability) with two limit points that coalesce on the critical hysteresis surface (HS). Unfolding an isola surface causes an isolated branch of solutions to appear (see Table 2, Isola1 and Isola2). Table 2 illustrates two types of isolated branches, or isolae, i.e., elliptic and hyperbolic. Unfolding the BLS causes the limit point of the bifurcation diagram at the feasibility boundary of the bifurcation parameter λ to move either into or away from the feasibility range. All these unfolding scenarios are observed with the present model, as discussed below (Results, Fig. 3).
TABLE 2.
Schematics of universal unfolding of the bifurcation diagrams of steady-state codimension-2 singular points (7,8,31)
x is the vector of system variables, and λ is the bifurcation parameter ([5-HT] in the LTM model). (Column 1) Types of hypersurfaces in LTM model. (Column 3) Bifurcation diagrams at the codimension-2 singular points. (Columns 2 and 4) The corresponding unfolded bifurcation diagrams resulting from a small perturbation of any parameter P1 other than λ. The direction of the perturbation (increase versus decrease of P1) is opposite in columns 2 and 4. Depicted are steady states that are stable (solid lines) and unstable (dashed lines) as well as bifurcation points (solid circles). The boundary limit set for the LTM model is at λ([5-HT]) = 0.
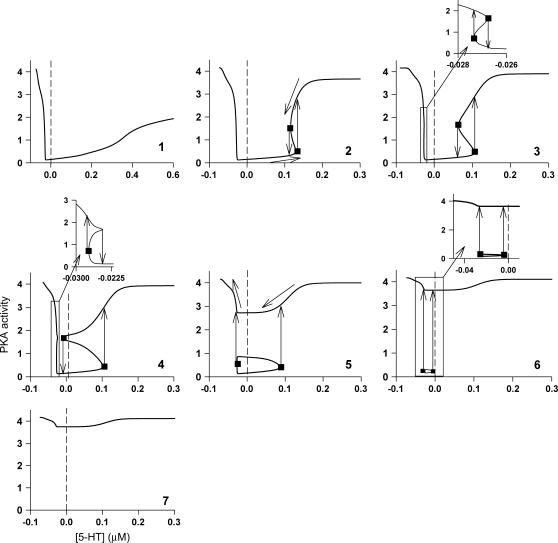
FIGURE 3.
Typical bifurcation diagrams of PKA activity versus [5-HT] at the values of kApSyn within the seven different intervals marked 1–7 of Fig. 2 B. Insets show expanded view of negative [5-HT] axis for 3, 4, and 6. Critical points are marked by squares. Arrows depict direction of trajectory mapped onto the bifurcation diagram.
In this study, singularity theory was applied to identify the qualitatively different types of steady-state bifurcation diagrams (x vs. [5-HT]) exhibited by the model of Fig. 1 (Table 1). Using two-parameter planes, curves were constructed that represent the intersections of the planes with the hypersurfaces HS, isola, and BLS. These curves are loci of codimension-2 points, and are boundaries between regions that contain qualitatively distinct steady-state bifurcation diagrams. Such a partition of a two-parameter plane into regions of distinct bifurcation diagrams is termed a classification diagram. For example, a classification diagram of the plane (kAp-Uch, kApSyn) provides the types of bifurcation diagrams that may be obtained by varying the parameters kAp-Uch and kApSyn (with all other parameters fixed).
Computational methods
An outline of the general procedure for constructing a classification diagram is as follows (see Appendix for further details). A steady-state bifurcation diagram is constructed to identify codimension-1 limit points (e.g., Fig. 2 A). These limit points are used as initial points to construct a curve, or locus, of limit points. This locus constitutes a codimension-1 diagram (e.g., Fig. 2 B). An arc-length continuation scheme (32,33) is used to construct the curve (locus of limit points) by linear extrapolation of two points on the curve to determine a third point by the Newton-Raphson iteration scheme for solving nonlinear algebraic equations (34). The codimension-1 locus contains critical points that are of type codimension-2. The codimension-2 points are then used as initial points for constructing a diagram of loci of codimension-2 singularities, termed a classification diagram (e.g., Fig. 4). To construct this diagram, the arc-length continuation scheme is applied again.
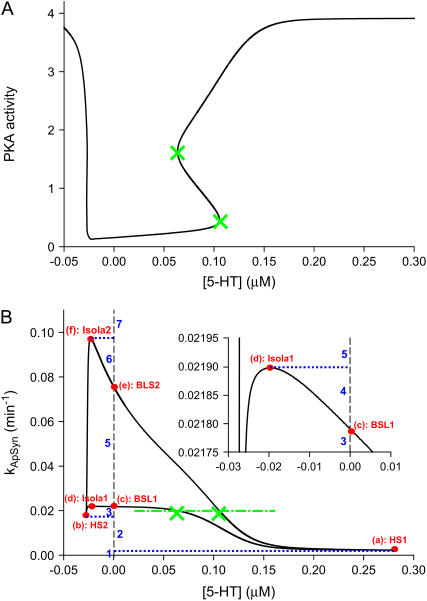
FIGURE 2.
Construction of codimension-1 diagram. (A) Bifurcation diagram of PKA activity versus [5-HT]. Limit points are marked by cross points. For this and subsequent figures, parameter values are as in Table 1 unless noted otherwise. (B) Codimension-1 diagram in the ([5-HT], kApSyn) plane illustrating the limit set (LS), loci of limit points (black curve). The two cross points on LS correspond to the two limit points in A with kApSyn = 0.02 (value in Table 1) (green dash-dot line). Six codimension-2 singular points are denoted by red dots marked a–f and labeled HS1, HS2, Isola1, Isola2, BLS1, and BSL2. These points divide the kApSyn axis into seven intervals marked 1–7 (in blue). Dotted lines show values of kApSyn where codimension-2 singular points are. The inset expands the region of Isola1 and BSL1 and shows interval 4 on the kApSyn axis.
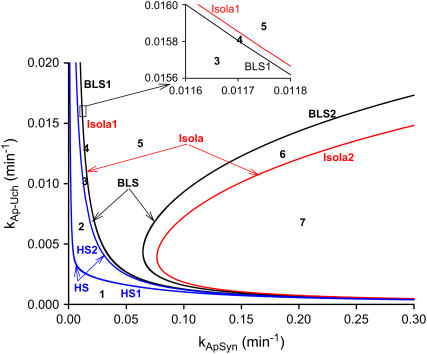
FIGURE 4.
Classification diagram constructed by the loci of six codimension-2 singular points. The (kApSyn, kAp-Uch) plane is divided into seven regions, marked 1–7, by curves that are continuations of the six codimension-2 singular points in Fig. 2 B (blue, hysteresis surface (HS); black, boundary limit set (BLS); red, Isola). Each region (1–7) with kAp-Uch = 0.007 contains a qualitatively different type of bifurcation diagram of PKA activity versus [5-HT] corresponding to the diagrams in Fig. 3, 1–7, respectively. Region 4 is very small, and an inset (above main figure) is required for its visualization.
To perform a comprehensive bifurcation and singularity analysis and locate all of the steady-state solutions, it is necessary to investigate both positive and negative ranges of the bifurcation parameter, [5-HT]. After completing the overall bifurcation and singularity analysis, the singularity analysis can be simplified and focus on the physiologically relevant range [5-HT] ≥ 0, as is illustrated in Figs. 5–8. The analysis, carried out on both positive and negative values of the bifurcation parameter before simplification to physiological values, is necessary to locate all steady-state solutions.
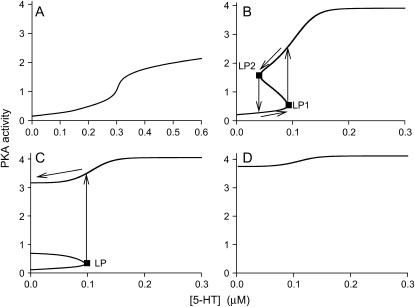
FIGURE 5.
Bifurcation diagrams of PKA activity versus [5-HT] for nonnegative [5-HT]. (A) Unique steady-state branch of low PKA activity for kApSyn = 0.0022. (B) Bistability with a reversible switch for kApSyn = 0.015. (C) Bistability with an irreversible switch and three steady states at [5-HT] = 0 for kApSyn = 0.03. (D) Unique steady-state branch of high PKA activity for kApSyn = 0.1.
FIGURE 8.
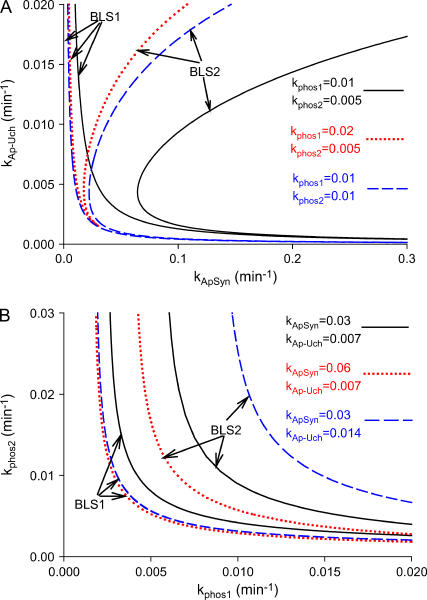
The size and location of the irreversible-switch domain, shown in Figs. 6 c and 7 c, can be altered by parameter values. (A) Effects of doubling kphos1 or kphos2 on the boundaries of the domain, BLS1 and BLS2. Depicted are kphos1 = 0.01 and kphos2 = 0.005 (default values) (solid curves); kphos1 doubled to 0.02 (dotted curves); kphos2 doubled to 0.01 (dashed curves). (B) Effects of doubling kApSyn or kAp-Uch. Depicted are default values: kApSyn = 0.03 and kAp-Uch = 0.007 (solid curves); kApSyn doubled to 0.06 (dotted curves); and kAp-Uch doubled to 0.014 (dashed curves).
FIGURE 6.
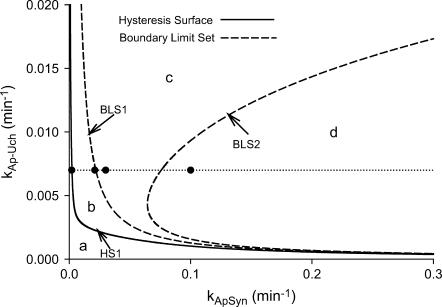
Simplified codimension-2 classification diagram for nonnegative [5-HT] in the (kApSyn, kAp-Uch) plane. The plane is divided into four regions (a–d) by curves that are continuations of three codimension-2 singular points; HS1, BLS1, and BLS2 (Fig. 2 B). The solid circles (at kAp-Uch = 0.007) in each region correspond to the bifurcation diagrams of PKA activity versus [5-HT] shown in Fig. 9 A.
FIGURE 7.
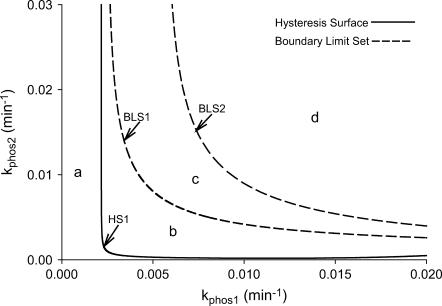
Simplified codimension-2 classification diagram for nonnegative [5-HT] in the (kphos1, kphos2) plane. The parameter plane is divided into four regions, marked a–d, by curves that are continuations of three codimension-2 singular points; HS1, BLS1, and BLS2 (Fig. 2 B).
Computations were performed on a PC with a Pentium 4 processor (2 GHz). Constructing codimension-2 diagrams required several minutes (<10 min to generate the diagram of Fig. 2 B) and under 1 h to generate the classification diagram of Fig. 4. The method should scale linearly for higher-order models.
RESULTS
Construction of the limit set identifies seven distinct bifurcation diagrams
To begin to analyze the steady-state features of the model, a bifurcation diagram was constructed (Fig. 2 A) to provide initial codimension-1 points. The bifurcation diagram exhibits multiplicity with three steady states of PKA activity within a range of [5-HT] (0.064 < [5-HT] < 0.105), The lower and upper branches are stable and the middle branch is unstable. Beyond this range of [5-HT], the diagram exhibits a single stable branch, low PKA activity for [5-HT] < 0.064, and high PKA activity for [5-HT] > 0.105.
To further examine the steady-state solutions of the model, the PKA/Ap-Uch positive feedback loop (see Methods) was analyzed in greater detail. The synthesis of Ap-Uch plays a key role in regulating the strength of the positive feedback loop, because Ap-Uch is induced by PKA activation and subsequently hydrolyzes the R subunits of PKA to support long-term PKA activation. Using the two limit points (marked by crosses) in Fig. 2 A as initial codimension-1 points, a codimension-1 diagram was constructed in the parameter plane of the Ap-Uch synthesis rate constant (kApSyn) versus the bifurcation parameter [5-HT] (Fig. 2 B). To construct this diagram, the locus of limit points, also called the limit set (LS), was traced using an arc-length continuation scheme (see Methods). The two crosses marked on the LS in Fig. 2 B correspond to the two limit points in Fig. 2 A with kApSyn = 0.02 (standard value in Table 1). The LS in the (kApSyn,[5-HT]) plane is a closed loop.
Six codimension-2 singular points were found on LS, denoted in Fig. 2 B as HS1, HS2, Isola1, Isola2, BLS1, and BLS2. These singular points divide the range of kApSyn into seven intervals labeled 1–7 in Fig. 2 B. Each interval represents a distinct region of parameter space that is described by a different bifurcation diagram (see Fig. 3).
Bifurcation diagrams in each of these seven intervals were characterized. In interval 1 of Fig. 2 B where kApSyn is less than the critical value of HS1, PKA activity is a monotonic function of [5-HT] (bifurcation diagram in panel 1 of Fig. 3), because no limit point exists in this interval. PKA activity is at a very low level at [5-HT] = 0. In interval 2 in which kApSyn is greater than HS1, multiplicity appears. The bifurcation diagram exactly at the HS1 point is schematized in Table 2 (HS). After crossing HS1, the bifurcation diagram exhibits two limit points, a hysteresis loop, and an interval of [5-HT] with three steady states of PKA activity. A diagram from interval 2 is shown in panel 2 of Fig. 3, in which a hysteresis loop is illustrated by the transitions between the two branches of stable steady-state solutions, which occur upon reaching the two limit points.
Upon increasing kApSyn to intervals 3 and 4, another hysteresis surface point, HS2, is crossed. Two new limit points, and a narrow range of multiplicity between them, appear at negative [5-HT] (panels 3 and 4 of Fig. 3, insets). The bifurcation diagrams in panels 3 and 4 of Fig. 3, with four coexisting limit points, are of the mushroom type (8). In interval 4 (see Fig. 2 B, inset and the segment of the LS between BLS2 and HS1), a line with fixed kApSyn intersects the LS curve at four points, only one of which is at positive [5-HT]. In the corresponding bifurcation diagram (panel 4 of Fig. 3), only one limit point is at positive [5-HT]. By further increasing kApSyn in Fig. 2 B, HS1 and HS2 merge at the point (d: Isola1). Here, an isola hypersurface intersects the (kApSyn,[5-HT]) plane. The bifurcation diagram at Isola1 is illustrated in Table 2 (Isola1, hyperbolic), in which the two branches of the mushroom merge at the value of [5-HT] at Isola1. The number of limit points decreases from four to two. Upon crossing Isola1, kApSyn goes to intervals 5 and 6. An isola of steady-state solutions appears (panels 5 and 6 of Fig. 3). For those values of [5-HT] at which three steady states of PKA activity coexist, the lower and upper states are stable whereas the middle state is unstable (5–8). However, with an isola, the two stable steady-state branches are not connected to each other. Therefore, the system cannot pass from one branch to the other through a hysteresis mechanism or loop. However, isolae demonstrate a mechanism of irreversible, nonhysteretic transition between steady states. For example, suppose in either panel 5 or 6 of Fig. 3 that the system is initialized in the lower steady state. Then, upon increasing [5-HT], the lower steady state will disappear (right boundary of isola) and the system will transit to the upper steady state. The transition is irreversible in that if [5-HT] is then decreased to zero, the upper steady state remains stable, and PKA activity remains high. However, a brief but large dynamic perturbation of system variables or parameters might cause a state transition in either direction by forcing the system out of the basin of attraction of either steady state.
With a further increase of kApSyn, the isola shrinks to a point at Isola2 (Fig. 2 B, corresponding bifurcation diagram in Table 2 (Isola2, elliptic)). By crossing Isola2 to interval 7, the isola disappears, leaving only a unique steady state of high PKA activity (panel 7 of Fig. 3).
In addition to the effects of the HS and isola points (Fig. 2 B) on the model behavior, the effects of the boundary limit set (BLS) points also need to be considered to characterize the complete set of steady-state behaviors of the model. The BLS is the hypersurface in the full parameter space of limit points located at zero [5-HT] (i.e., at the physically meaningful boundary of [5-HT]). Fig. 2 B shows two codimension-2 singular points on the LS loop, denoted BLS1 and BLS2, at which the BLS hypersurface intersects the (kApSyn,[5-HT]) plane. At BLS1, one limit point in the  bifurcation diagram is at zero [5-HT] (see BLS in Table 2). BLS1 divides the kApsyn interval containing a mushroom-type bifurcation diagram into two subdomains, intervals 3 and 4 in Fig. 2 B. Typical diagrams in these intervals are illustrated in panels 3 and 4 of Fig. 3, respectively. Upon unfolding BLS1 (i.e., perturbing kApSyn slightly above or below BLS1), either one steady-state solution (panel 3) or three solutions (panel 4) appear at [5-HT] = 0. At BLS2, the right limit point of the isola is at zero [5-HT], while the other limit point lies in negative [5-HT] (not shown). In Fig. 2 B, BLS2 divides the isola interval into two subdomains, intervals 5 and 6. Typical bifurcation diagrams are shown in panels 5 and 6 of Fig. 3, respectively. In Fig. 2 B, the curve that connects BLS2 and HS1 represents a threshold of 5-HT stimulation. If [5-HT] remains to the right of this curve, then the lower steady state of PKA activity no longer exists (the system is to the right of the lower limit points in Fig. 2 A or panels 2–5 of Fig. 3). The system will transit to the only stable state, of high PKA activity.
It is evident from the above that the LS in Fig. 2 B plays a key role in bifurcation analysis. The LS enables rapid determination of all qualitatively different bifurcation diagrams of PKA activity versus [5-HT] that can be obtained at different values of a system parameter (kApSyn). Furthermore, the LS allows for the identification of codimension-2 singular points (HS, isola, BLS points in Fig. 2 B). These points, and the associated hypersurfaces, are needed to characterize the effect of changing two or more parameters on the dynamics of the system. Specifically, loci of these codimension-2 points in the plane of any two parameters P1 and P2 (in the parameter space P) can be constructed. A classification diagram of these loci subdivides the plane into regions, each of which manifests a qualitatively different type of (x,λ) bifurcation diagram.
The loci of six codimension-2 singular points partition a key classification diagram into seven regions
In addition to kApSyn, a second parameter that determines the strength of the PKA/Ap-Uch positive feedback loop is kAp-Uch. The rate constant kAp-Uch describes degradation of the R subunit of PKA by Ap-Uch, enhancing the catalytic (C) activity of PKA (Fig. 1, Eqs. 2–4 in Table 1). Therefore, a classification diagram in the (kApSyn,kAp-Uch) plane, illustrating qualitative changes in dynamics as these parameters are varied, is likely to provide significant insight into regulation of the model's behavior. By continuation (varying kAp-Uch, see Methods) of the six codimension-2 singular points (in Fig. 2 B) in the (kApSyn,kAp-Uch) plane, this classification diagram of Fig. 4 was constructed. At any point on a codimension-2 curve, the bifurcation diagram of PKA activity versus [5-HT] is qualitatively like that of the corresponding codimension-2 singular point in Table 2. For example, at any point on the Isola1 curve, the bifurcation diagram will show an isola pinching off from another branch of stable solutions (Table 2). At any point within a region between curves in Fig. 4, the bifurcation diagram is qualitatively like the corresponding diagram in Fig. 3. For example, throughout region 2 of Fig. 4, the bifurcation diagram is like that of panel 2 of Fig. 3, with two limit points and a hysteresis interval of [5-HT] between the limit points. Three steady states will be present within this [5-HT] interval, and only one steady state will be present for all other values of [5-HT]. The specific diagrams of Fig. 3 lie along the line kAp-Uch = 0.007 min−1 in Fig. 4.
Only a subset of bifurcation diagrams is present for physiologically relevant 5-HT concentrations
By using the loci of codimension-1 singular points (LS in Fig. 2 B), different bifurcation diagrams (Fig. 3) can be derived and insights can be obtained into the ways in which these diagrams transit between each other via codimension-2 singular points (Table 2). Loci of these codimension-2 points partition classification diagrams (Fig. 4) into regions with distinct bifurcation diagrams. Analogous diagrams exist for any two parameters other than [5-HT]). These results were derived allowing [5-HT] to vary over negative, zero, and positive values. Physiologically, only nonnegative [5-HT] is relevant. Can the portions of bifurcation diagrams at negative [5-HT] be neglected and a simplified analysis derived that focuses on physiological significance?
To address this question, the seven bifurcation diagrams of Fig. 3 were further inspected. By neglecting the portions of diagrams with negative [5-HT], the diagrams can be reclassified into four types. In panel 1 of Fig. 3, the PKA activity exhibits a unique, monotonically increasing function for [5-HT]  , but because the PKA/Ap-Uch positive feedback is weak (low kApSyn), PKA activity remains low. In panels 2 and 3 of Fig. 3, PKA activity manifests three steady-state values within a positive range of [5-HT]. In panels 4 and 5 of Fig. 3, PKA activity manifests three steady states within a range that includes [5-HT] = 0. In panels 6 and 7 of Fig. 3, a unique steady state again exists, but because the PKA/Ap-Uch positive feedback is strong (high kApSyn), PKA activity is high even at zero [5-HT]. These bifurcation diagrams with [5-HT]
  are plotted in Fig. 5. Fig. 5, A–D, corresponds to panels 1–7 of Fig. 3 as follows: Fig. 5 A to panel 1; Fig. 5 B to panels 2 and 3; Fig. 5 C to panels 4 and 5; and Fig. 5 D to panels 6 and 7.
There are three codimension-2 singular points with either positive or zero [5-HT] in Fig. 2 B: HS1, BLS1, and BLS2. These three points divide the range of kApSyn into four intervals, a, b, c, and d. The intervals a–d correspond to the intervals 1–7 of Fig. 2 B as follows: a to 1; b to 2 and 3; c to 4 and 5; and d to 6 and 7. The corresponding bifurcation diagram in interval a, below HS1, is shown in Fig. 5 A. Interval b, bounded by HS1 and BLS1, has the bifurcation diagram shown in Fig. 5 B. In interval b, a line with fixed kApSyn will intersect the LS in Fig. 2 B at two points for [5-HT]  0. These points correspond to the two limit points in the bifurcation diagram shown in Fig. 5 B (LP1 and LP2). In interval c of kApSyn, bounded by BLS1 and BLS2, the bifurcation diagram corresponds to Fig. 5 C. A line with fixed kApSyn in Fig. 2 B intersects the LS at only one point for [5-HT]
  0, and the corresponding bifurcation diagram in Fig. 5 C also shows one limit point. In interval d, with kApSyn above BLS2, the bifurcation diagram corresponds to Fig. 5 D and has no limit point for [5-HT]
  0.
0.
The bifurcation diagram in Fig. 5 B illustrates a hysteretic loop between two limit points. Such a structure is termed a reversible switch or toggle switch, because alterations in [5-HT] can carry the system to the left or right of both limit points, inducing transitions of PKA activity between the upper and lower steady states. This multiplicity is termed bistability since the upper and lower solutions are stable whereas the middle solution is unstable. The limit point with larger [5-HT], LP1, defines a threshold of [5-HT] required to induce high PKA activity. Physiologically, such a threshold might act as a filter, by which a weak 5-HT stimulus can be regarded as noise and neglected. A saturation of PKA activity was also observed in this bifurcation diagram for [5-HT] > ∼0.16. Saturation might help to protect neurons against excessive gene induction and energy expenditure in response to frequent stimuli.
Although Fig. 5 loses part of the detailed information about how these bifurcation diagrams originate (Fig. 3) and transit between each other, it is derived from the overall bifurcation and singularity theory, and focuses on the physiologically relevant concentrations of 5-HT. A classification diagram similar to Fig. 4, but restricted to [5-HT]  0, can be constructed (Fig. 6) by continuing the codimension-2 singular points of Fig. 2 B that have nonnegative [5-HT] (HS1, BLS1, and BLS2) in the kApSyn-kAp-Uch plane. Regions a–d bounded by the loci of these singular points have the bifurcation diagrams illustrated in Fig. 5, A–D, respectively.
Bifurcation analysis reveals a robust irreversible switch
The type of bifurcation diagram is largely determined by the strength of the positive feedback loop in which PKA activity and Ap-uch expression reciprocally enhance each other (Fig. 1). Whereas Fig. 5 B displays a bifurcation diagram that is analogous to a reversible switch (kApSyn = 0.015), increasing the strength of the positive feedback generates a bifurcation diagram analogous to an irreversible switch (Fig. 5 C, kApSyn increased to 0.03). For Fig. 5 C, the system switches from the off-state (low PKA activity) to the on-state of high activity upon crossing the limit point LP where the off-state ceases to exist. However, because only one limit point exists for nonnegative [5-HT], the system remains at high PKA activity if [5-HT] is then reduced to zero. In the classification diagram of the (kApSyn, kAp-Uch) plane (Fig. 6), the reversible and irreversible switches lie within regions b and c, respectively. At first glance, it might appear that the irreversible switch originates from the broken hysteretic loop of Fig. 5 B. However, the analysis indicates that the irreversible switch originates from an isola bifurcation (Figs. 3 and 4), since interval 5 of kApSyn in Fig. 2 B, where the isola exists, is much larger than interval 4, with the broken hysteretic loop. If the positive feedback is very strong, the bifurcation diagram of PKA activity versus [5-HT] again manifests a unique steady state, with high PKA activity even at zero [5-HT] (Fig. 5 D). This would be analogous to an unphysiological state of constant kinase overactivity.
In the classification diagram of Fig. 6, region c, which corresponds to the irreversible-switch bifurcation diagram, is relatively large. This observation suggests that, generically, the irreversible switch will be preserved for small parameter variations. However, the (kApSyn,kAp-Uch) plane is only one of the possible slices through the restricted parameter space. Does the irreversible-switch region retain substantial size if the parameter space is examined using different parameters? To address this question, the (kphos1,kphos2) parameter plane was used to construct an analogous classification diagram (Fig. 7) (kphos1 is the rate constant with which PKA phosphorylates TF-1; kphos2 is the rate constant with which ERK phosphorylates TF-2). Although Figs. 6 and 7 appear somewhat different, their essential characteristics are similar. In both figures, one hysteretic surface (HS1) and two boundary limit sets (BLS1 and BLS2) divide the plane into four regions that correspond to the topologically distinct bifurcation diagrams in Fig. 5, A–D. As in Fig. 6, the region corresponding to the irreversible switch (region c in Fig. 7) remains relatively large. The other regions a, b, and d also remain of substantial size. This result strengthens the conclusion that the irreversible switch, as well as the dynamics represented in the other regions, are robust to small parameter variations.
To further assess the robustness of the irreversible switch, the effects of some large parameter changes on region c, Figs. 6 and 7, were examined. Fig. 8 A illustrates the consequences of doubling either kphos1 or kphos2. It is evident that the size of region c decreases somewhat upon doubling kphos1 or kphos2. The shift of the BLS2 boundary to the left is more significant than that of BLS1. However, the region is still substantially large. In particular, when kAp-Uch is high, a large range of kApSyn generates an irreversible switch. Fig. 8 B exhibits the consequences of doubling either kAp-Uch or kApSyn. Increasing kApSyn does not significantly alter the size of the irreversible switch region bounded by BLS1 and BLS2. Increasing kAp-Uch can considerably enlarge the irreversible switch domain. These results illustrate that the irreversible switch exists in a substantial region of parameter space, and is robust to large parameter changes. This robustness suggests that the irreversible switch mechanism might be observed to function in vivo.
Simulations verify steady-state bifurcation analysis
The above bifurcation analyses do not consider the time delay τ (Eq. 16) in the original model of Fig. 1. The presence of a time delay cannot eliminate any of the steady states in Figs. 2–8. However, a delay can affect the dynamic behavior as the system evolves toward steady states, and may alter their stability. Therefore, it is important to complement the steady-state analyses with simulations in which the system is initially far from steady state.
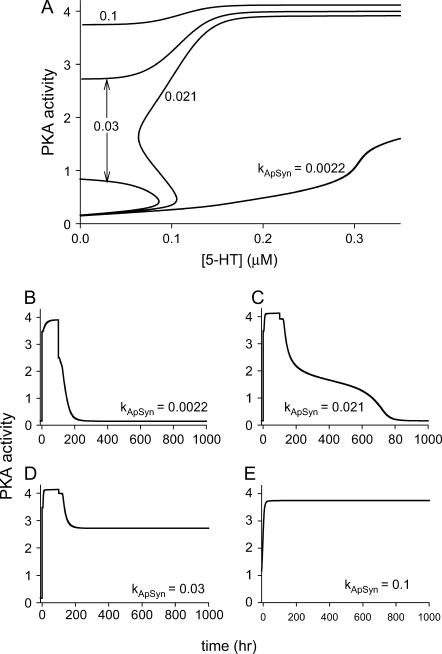
Four distinct steady-state bifurcation diagrams are plotted in Fig. 9. As kApSyn is increased, a monotonic steady state of low PKA activity (kApSyn = 0.0022) changes to a hysteretic loop with two limit points and three steady states of PKA activity between these points (kApSyn = 0.021). At higher kApSyn (0.03), an irreversible switch is obtained, with only one limit point at positive [5-HT] and three steady states at [5-HT] = 0. At yet higher kApSyn (0.1), only one steady state exists, with high PKA activity. These four bifurcation curves correspond to the four regions of Fig. 6 and are marked in Fig. 6 by the dots on the line kAp-Uch = 0.007 min−1.
FIGURE 9.
Dynamic simulations of full LTM model. (A) Typical examples of four qualitatively different steady-state bifurcation diagrams of PKA activity versus [5-HT] (≥0) are plotted together. These diagrams correspond to the black dots in Fig. 6. (B–E) Time courses of four simulations with 100 h of 10 μM 5-HT stimulation beginning at t = 0. Parameter values correspond to the four bifurcation diagrams in A.
Fig. 9, B–E, illustrate simulations of the model (Table 1) with the time delay (τ = 250 min). By applying a long (100 h) stimulus, these simulations verify the stability of the steady states in Fig. 9 A. With kApSyn = 0.0022, 100 h of 10 μM 5-HT stimulation elevates PKA activity to a plateau (Fig. 9 B). The activity returns to its baseline rapidly after the stimulus ends, and this baseline corresponds to the lowest steady state in Fig. 9 A with [5-HT] = 0. With kApSyn = 0.021 (the reversible switch bifurcation diagram in Fig. 9 A), similar dynamics to Fig. 9 B are observed (Fig. 9 C). However, after the same 5-HT stimulation, PKA activity slowly returns to the steady-state value (in Fig. 9 A with [5-HT] = 0, kApSyn = 0.021). With kApSyn = 0.03 (the irreversible switch bifurcation diagram in Fig. 9 A), a prolonged stimulus of 10 μM 5-HT induces a transition to a high, stable level of PKA activity. This state remains stable when [5-HT] returns to 0 μM at t = 100 h, and PKA activity is permanently locked in a high state (Fig. 9 D). Finally, with very strong positive feedback (kApSyn = 0.1) (Fig. 9 E), PKA activity converges to the highest stable state of Fig. 9 A even with [5-HT] fixed at 0 μM.
The model (Table 1) contains three delay differential equations (DDEs) (Eqs. 2–4). To locate the steady-state solutions, limit points, and singular points, the model in vector form (Eq. 16) was reduced to the algebraic system (Eq. 17) without time delay. Time delays do not alter the existence of a steady state, or the locations of codimension-1 and -2 steady-state singular points (35). The focus of this article is to use steady-state singularity analysis to compute the singular points and construct classification diagrams of parameter space to determine the regions in which different steady-state bifurcation diagrams exist. This analysis is invariant to the presence of a time delay.
Analyses of DDEs and ODEs do differ in terms of the procedure to determine the stability of a steady state. Time delays may destabilize a steady state under certain conditions. In this study, we did not systematically investigate how the time delay affects the stability of steady states through analysis of the eigenvalues of linearized DDEs. Instead, we verified the stability of several key steady-state solutions on the different bifurcation diagrams in Fig. 9 A by simulation of the model using different values of τ. For example, we investigated the stability of the upper steady-state branch of the irreversible switch at [5-HT] = 0 (with kApSyn = 0.03) in Fig. 9 A. A delay equal to or smaller than that used by Pettigrew et al. (17) (τ ≤ 250 min) has a negligible impact on the transients as the system converges to the stable steady state. Increasing the delay 20-fold to 5000 min causes the system to converge to the steady state by way of damped oscillations with small amplitude. With yet a longer time delay (10,000 min), the amplitude of the damped oscillation increases, but the stability is still not altered. Similar results were found for the lower steady-state branch of the irreversible switch (with kApSyn = 0.03) in Fig. 9 A. The middle steady-state branch is unstable, therefore it cannot be reached with transient simulations. We also examined the stability of steady-state solutions of the three other bifurcation diagrams in Fig. 9 A and found that the stability is not altered by time delays as large as 5000 min. Therefore, we conclude that physiologically reasonable time delays do not alter the stability of the steady states in the parameter space that we investigated.
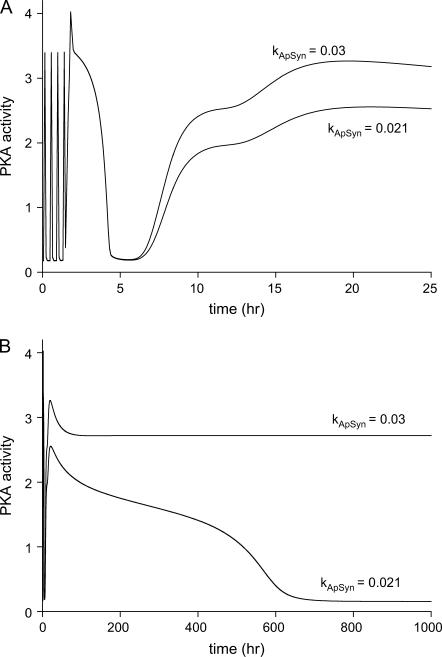
By applying pulsed stimulation protocols, which are often implemented experimentally (27,28), simulations were performed in the parameter regimes of the reversible switch (kApSyn = 0.021) and irreversible switch (kApSyn = 0.03) (Fig. 10). After five pulses of 5-HT (10 μM for 5 min, with an interstimulus interval of 20 min), PKA activity is strongly activated at ∼24 h in both cases (Fig. 10 A). However, PKA activity gradually drops to its baseline in the reversible switch case after removing 5-HT, whereas PKA activity remains at high level in the irreversible switch case (Fig. 10 B). After three pulses of 5-HT, PKA activity is only slightly and briefly elevated in both cases (not shown). Thus, three pulses of 5-HT are subthreshold, whereas five pulses cross the threshold for long-term PKA activation. Empirically, five pulses of 5-HT, but not three, induce long-term PKA activation (36), as well as LTF (10,37). In vivo, four or five spaced shocks to Aplysia induce long-term sensitization (LTS) of withdrawal reflexes, whereas three shocks do not (11). These observations suggest the threshold stimulus duration for long-term PKA activation (five pulses) corresponds to a threshold for the formation of LTS, a simple form of LTM.
FIGURE 10.
Time courses of PKA activity. (A) Twenty-five hours during and after five pulses of 5-HT (10 μM for 5 min, interstimulus interval of 20 min). The time courses correspond, respectively, to the values of kApSyn for the reversible (0.021) and irreversible (0.03) switches in Fig. 9 A. (B) Same as A, except continued for 1000 h.
For the value of kApSyn (0.021) corresponding to the reversible switch, the simulation protocol of Fig. 10 was repeated, varying the amplitude of the 5-HT stimulus. These simulations illustrated a dynamic threshold for stimulus amplitude at ∼7.5 μM [5-HT]. This stimulus is the minimum amplitude to induce high PKA activity by using the five-pulse stimulation protocol. However, the steady-state threshold for PKA activity in Fig. 9 A is just above a 5-HT stimulus of ∼0.106 μM. This steady-state threshold is the minimal stimulus amplitude to induce high PKA activity by continuous 5-HT application or very long stimulus duration. A simulation with [5-HT] held at 0.15 μM, slightly above the steady-state threshold, showed that to induce high PKA activity, ∼4500 min of stimulation was required.
DISCUSSION
Analyses with parameters unconstrained, and with parameters restricted to physiological ranges, are important for characterizing the model
The classification diagram of parameter space in Fig. 6 is a simplified version of Fig. 4 that considers only the three codimension-2 singular points for [5-HT] ≥ 0 in Fig. 2 B. It might appear that if analysis focuses on physiologically relevant parameter values, a subset of the singular points may suffice to classify parameter space. However, for a complete analysis it is necessary to investigate both the positive and negative ranges of the bifurcation parameter [5-HT]. This analysis is based on locating the limit points of the model, some of which are at negative [5-HT] (Fig. 2 B), to characterize the possible bifurcation diagrams. The limit points are used to locate the codimension-2 singular points (Fig. 2 B), which mark the boundaries between various types of bifurcation diagrams (Fig. 3). In our analysis, most of these singular points are at negative [5-HT] (Fig. 2 B). Only after identifying these points, and the intervals between them, can we classify the different types of bifurcation diagrams and construct specific examples (Fig. 3). If only positive values of the bifurcation parameter are examined, we risk missing a boundary between regions in the full classification diagram (Fig. 4), as well as incorrectly identifying the transitions between them (see Table 2).
For example, examining negative [5-HT] allows us to locate the BLS2 limit point. BLS2 represents the boundary between regions c and d in the classification diagram (Fig. 6) corresponding to the bifurcation diagrams of the irreversible switch type (Fig. 5 C) and monotonic type (Fig. 5 D), respectively. The irreversible switch is a potential mechanism for the induction or maintenance of LTM. In addition, without the analysis with negative [5-HT], it is not possible to establish that the bifurcation diagrams containing an irreversible switch (Fig. 5 C, corresponding to both intervals 4 and 5 of kApSyn in Fig. 2 B) mainly originate from a broken isola bifurcation, and not from a broken hysteretic loop. The origin of the irreversible switch can be observed from Figs. 2 B and 4, in which interval or region 5 (corresponding to the isola bifurcation diagram in Fig. 3, panel 5) is large, whereas interval or region 4 (corresponding to the hysteretic bifurcation diagram in Fig. 3, panel 4) is small (see Fig. 2 B, inset).
Bifurcation analysis and simulation complement each other
Simulation is essential to study the temporal evolution of a model, whereas bifurcation analysis provides a steady-state view. These two methods of analysis complement each other, as illustrated by comparing the simulations of Figs. 9, B–E, and 10 with the bifurcation diagrams of Fig. 9 A. Simulations with the full model (Table 1) including the time delay τ are consistent with steady-state features of bifurcation diagrams derived without τ. This comparison emphasizes the necessity of performing both steady-state analysis and simulations to understand the complex interactions within a biochemical network. Bifurcation analysis systematically characterizes the parameter space to determine regions that generate qualitatively different steady-state or oscillatory solutions. For complex models, this analysis is necessary, because it is computationally impractical to characterize the dynamics by a very large number of random or systematic simulations throughout the multidimensional parameter space. In contrast, simulations can generate time courses of system variables that provide detailed information on how the variables respond to stimuli and interact with each other. Simulations also provide insights into the methods that may be used to reach steady states (e.g., by determining the minimum stimulus amplitude and duration required to reach a specific steady state).
Irreversible switch dynamics may contribute to the formation of LTM
Irreversible switches have been suggested to be important for cellular differentiation and development (18–23); entry into mitosis in the cell cycle (3); ligand-induced autocrine growth factor signaling (38); Sonic Hedgehog signaling (39); and long-term memory formation (40–44). The common feature is conversion of a transient stimulus into an irreversible response through the activation of a network of intrinsically reversible signaling molecules and gene products.
Several types of irreversible switches have been proposed to contribute to the maintenance of LTM. Lisman and Fallon (41) and Roberson and Sweatt (44,45) suggested several possible switches that might sustain long-term changes in the strength of synapses. Lisman and co-workers (43,46,47) proposed CaMKII activity may be sustained indefinitely by positive feedback in which active, phosphorylated CAMKII multimers further phosphorylate their subunits, and this CAMKII activity might maintain long-lasting synaptic strengthening or potentiation (LTP) and therefore LTM. Iyengar and co-workers (40,48) showed that a feedback loop involving protein kinase activities and second messengers (including protein kinase C, Raf, MAP kinase kinase, and MAP kinase) can produce a bistable molecular switch at a synapse, which when activated may induce LTP. Kandel and co-workers proposed a positive feedback mechanism for protein oligomerization (49–51) that may be important for sustaining persistent modification of synaptic structure, allowing for LTM. The irreversible switch exhibited by the present model is similarly based on a positive feedback loop, with reciprocal induction of PKA activation and Ap-uch expression (see Methods). Such a switch (Figs. 5 C and 6) could maintain long-lasting PKA activation, transcription factor (TF) phosphorylation, and gene induction in response to relatively brief stimuli, and could therefore be important for consolidation of LTM, which is known to require gene expression.
Switches based on positive feedback loops, such as the irreversible switch (Fig. 5 C), are commonly described by deterministic ODEs or DDEs, which use chemical concentrations as continuous variables. This representation implicitly assumes that the number of molecules in the system is sufficiently large to ensure that deterministic, mass-action kinetics can describe the dynamics. However, if the copy numbers of some key kinases, or other molecular species, in the feedback loop are relatively low (e.g., tens), then stochastic noise and fluctuations in molecular copy numbers may induce spontaneous transitions between states (23,52). Therefore, molecular noise may be a key factor that affects the robustness of the bistable switch when the copy numbers of molecules are low.
Whether the PKA/Ap-Uch positive feedback loop does, in fact, play an important role in the formation of LTM remains to be determined experimentally. If this loop exhibits switchlike behavior, then a relatively brief activation of PKA by an agonist that elevates cAMP levels, such as forskolin or 5-HT, should induce a subsequent, long-lasting (many hours or days) phase of PKA activation and Ap-uch expression. Indeed, in Aplysia neuronal ganglia, application of five 5-min pulses of 5-HT induces PKA activation measured 24 h later (36). Although this result is compatible with long-lasting positive feedback, the time course of PKA activation needs to be examined at additional time points. Crucially, concomitant long-lasting induction of Ap-uch would need to occur to support the hypothesis that brief stimuli can induce irreversible switchlike activation of the positive feedback. Furthermore, a molecular pathway from PKA activation to Ap-uch gene induction should be identified. As discussed above (see Methods), Ap-uch does not appear to be induced via phosphorylation of the CREB1 transcriptional activator. However, PKA activation could lead to phosphorylation of an unspecified TF that induces Ap-uch. A major goal of this article, not dependent on these model details, is to point out that positive feedback loops may be important for sustaining long-lasting kinase activation and gene expression to induce, or maintain, LTM.
We note that in vivo, any biochemical switch associated with the induction of LTM is not likely to remain irreversible. It is likely that processes of molecular turnover, not represented in the present model, would tend to return kinase activities and synaptic strengths to average levels. For example, several current theories of long-term synaptic plasticity envision homeostatic mechanisms that rescale synaptic weights over time (53,54).
Classification diagrams can help predict effects of drugs or other environmental stimuli
Classification diagrams of parameter space (e.g., Figs. 4 and 6–8) provide boundaries within the parameter space that differentiate among multiple bifurcation diagrams and multiple stimulus-response outcomes (e.g., hysteresis or irreversible switches). Classification diagrams help to determine which dynamic features are robust to variation of parameter values. Only those bifurcation diagrams that occupy a region of significant size in multiple classification diagrams (e.g., Figs. 6 c and 7 c, and perturbations of this region in Fig. 8) are likely to describe the physiological dynamics.
Codimension-1 bifurcation diagrams analogous to Fig. 2 B can be used to determine parameters that, if varied by pharmacological or environmental intervention, would have a major qualitative effect on the dynamics of the system. For example, Fig. 2 B illustrates that a compound affecting the rate of Ap-uch transcription or protein synthesis (the rate constant kApSyn) would significantly alter the dynamics (e.g., by changing hysteretic behavior to monotonic or irreversible-switch behavior). Diagrams similar to Fig. 2 B can be combined with considerations of which parameters could be altered relatively selectively by chemical or other stimuli. In this way, potential targets could be identified for drug design and therapy, as well as for toxins or other environmental stimuli.
Classification diagrams analogous to Figs. 4 and 6 provide a visual map to determine how the system will respond if two parameters are varied simultaneously by pharmacological or environmental stimuli, or if one parameter is varied in systems characterized by differing values of a second parameter. Therefore, classification diagrams may provide a visual means of determining the effect of two drugs applied simultaneously, and possibly illustrate a synergetic effect, which would not be observed if the drugs were applied individually or sequentially. For example, Fig. 6 illustrates that compounds or drugs might enhance the induction of LTM by altering either kApSyn or kAp-Uch or both. Increasing the strength of positive feedback by increasing kApSyn and/or kAp-Uch favors more prolonged and greater activation of PKA. A monotonic relationship of PKA activity versus [5-HT] (region a) is converted sequentially to a hysteretic reversible switch (region b), then to an irreversible switch (region c). In vivo, compounds that increase Ap-Uch synthesis (kApSyn) and/or increase the effectiveness with which Ap-Uch promotes PKA activation (kAp-Uch) would plausibly promote persistent PKA activation, TF phosphorylation, and synaptic strengthening. Near boundary curves of classification diagrams, the system is particularly sensitive to parameter changes, because small changes can qualitatively alter system behavior.
Pettigrew et al. (17) proposed (their Fig. 6 A) that a compound able to reduce the dephosphorylation rates of MAPKK (kb, MAPKK) and ERK (kb, ERK), might enhance 5-HT-induced Ap-uch expression and PKA activation. The effect of reducing both these rate constants was therefore examined. Bifurcation analysis of the unaltered system (kb, MAPKK = kb, ERK = 0.12 min−1) and the altered system (kb, MAPKK = kb, ERK = 0.06 min−1) (other parameters as in Table 1) show that the qualitative nature of the bifurcation diagram (a hysteretic loop/reversible switch) is not changed by decreasing kb, MAPKK and kb, ERK, although the threshold for PKA activation by 5-HT is considerably reduced (not shown). An irreversible-switch type of bifurcation diagram cannot be generated by further decreasing kb,MAPKK and kb,ERK (not shown), because the strength of the positive feedback loop (which is governed by kApSyn and kAp-Uch) remains insufficient. These simulations suggest alteration of kinetic parameters outside the positive feedback loop can decrease the threshold for 5-HT necessary for significant PKA activation, but is less likely to enhance the duration of PKA activation, TF phosphorylation, and gene induction. The analysis predicts that alteration of kinetic parameters within the positive feedback loop might be more likely to enhance both the intensity and duration of gene induction, and the magnitude of LTM.
The proposal that alteration of MAPKK/ERK kinetic parameters might enhance PKA activation was based originally on sensitivity analysis (17). For each parameter in the model, a small change was made, and the resulting change in the magnitude of PKA activation was determined. PKA activation was found to be particularly sensitive to kb,MAPKK and kb,ERK. However, a caveat of sensitivity analysis is that small parameter changes will not change the qualitative bifurcation diagram when a state is not located near the boundary curves of a classification diagram. Larger parameter changes can qualitatively alter the bifurcation diagram. Such changes might simulate a mutation or a pharmacological intervention. Such alteration often corresponds to a nonlinear change in dynamic stimulus responses that could not be predicted by scaling up the effect of a small parameter change. Classification diagrams of parameter space (Figs. 4 and 6) and codimension-1 bifurcation diagrams (Fig. 2 B) may be used to identify parameters which, when varied, may move system behavior into a regime described by a different type of bifurcation diagram.
However, sensitivity analysis cannot be discounted. It is rapid and easily performed. A complex parameter space generally has too many dimensions to be explored thoroughly by bifurcation analysis. Therefore, sensitivity analysis is needed to determine a class of control parameters, defined as those that strongly affect the stimulus response of a system. Bifurcation analysis can then focus, at least initially, on characterizing how the dynamics are altered by larger changes in the subset of control parameters, which are plausible targets for drugs or other biochemical stimuli (17).
There appears to be significant conservation of biochemical mechanisms underlying synaptic strengthening and memory formation between organisms as diverse as Aplysia and vertebrates, including mammals. In mammals, as in Aplysia, the formation of many examples of LTM correlates with changes in synaptic strength (55,56). These changes, like Aplysia LTF, are associated with MAP kinase and PKA activation and gene induction (57–60), and with phosphorylation and activation of the CREB family of transcription factors (61–63). Activation of CREB appears critical for the formation of at least some forms of vertebrate LTM (64–68). Because of this conservation of mechanisms, it is likely that the methods of analyses used here will help us to understand the dynamics of memory formation in other organisms, and the ways in which memory formation might be altered by drugs or other environmental interventions.
Acknowledgments
Supported by National Institutes of Health grants No. P01 NS38310 and No. R01 NS50532.
APPENDIX
Further details of the equations and methods for calculation of steady-state singular points (8,31,69) are given here. The codimension-1 singularity termed a limit point is defined by the set of conditions
 |
(18) |
with f as in Eq. 17 and with 〈.,.〉 denoting the standard inner product, i.e., 〈u, u〉 = uT · u. J is the Jacobian matrix of f, with the elements  . The value u is the eigenvector of J corresponding to zero eigenvalue. The proceeding set of 15 × 2 + 1 algebraic equations determines the 15 × 2 variables (x,u) and the bifurcation parameter λ. Because these equations only determine one parameter, λ, the limit point is codimension-1. By varying continuously an additional parameter P1, the loci of the limit points in the (P1,λ)-plane can be obtained. This curve, or the corresponding hypersurface of singular points in the full parameter space, is usually termed a limit set (LS) (the intersection of the hypersurface with the (P1,λ) plane yields the curve). The LS curve can be effectively traced out by an arc-length continuation scheme (32,33). It has been shown (see Results) that the LS enables rapid determination of all the qualitatively different bifurcation diagrams that can be attained for different values of the parameter P1.
Codimension-2 singular points on HS, isola, or BLS hypersurfaces (see their bifurcation diagrams in Fig. 3 and Table 2) are defined as follows. On an HS,
 |
(19) |
where J* is the conjugate transpose of the Jacobian matrix J. The values u and v are the eigenvector and adjoint eigenvector of J, and the second differential vector of the vector function f is
 |
(20) |
The set of Eqs. 19 includes 3 × 15 + 2 equations that determine the 3 × 15 variables (x,u,v), the bifurcation parameter λ, and an additional parameter P1. Because both λ and P1 are determined, the point is codimension-2.
A point on an isola surface (elliptic or hyperbolic) (8,31) satisfies the conditions
 |
(21) |
These 2 × 15 + 2 equations determine 2 × 15 variables (x,v), the bifurcation parameter λ, and an additional parameter P1. By continuously varying another parameter P2 and using arc-length continuation, the curve of isola points in the (P2,P1)-plane can be obtained.
A boundary limit set (BLS) is a hypersurface on which a limit point in the bifurcation diagram (x vs. λ) occurs at the physiological boundary of the bifurcation parameter. In our model, the physiological boundary occurs when the concentration of 5-HT reaches 0. A point on the BLS therefore satisfies the conditions
 |
(22) |
These 2 × 15 + 2 equations determine the 2 × 15 variables (x,u), the bifurcation parameter λ, and an additional parameter P1. By varying continuously another parameter P2 the BLS curve can be constructed in the (P2,P1) plane using an arc-length continuation scheme. In our model, additional BLS surfaces could be defined for each biochemical rate constant, because they are constrained to be nonnegative.
To solve the above equations, the differential equations (Eq. 16) are first numerically integrated to obtain an approximate steady state. The steady state is more precisely computed by the Newton-Raphson method (34). Arc-length continuation is then used to trace out the bifurcation diagram in the (x,λ) plane and obtain the codimension-1 limit points (the turning points of the bifurcation diagram). Arc-length continuation is used again to trace out a curve of limit points in the (λ,P1) plane. Some of these points may be identified as codimension-2 points that solve Eqs. 19, 21, or 22 for the fixed value of a second parameter P2. If so, arc-length continuation is used yet again, varying P1 and P2, and tracing out curves of the codimension-2 points in the (P2,P1) plane. As discussed above, these curves are intersections of the HS, isola, or BLS surfaces with the (P2,P1) plane, and make up the classification diagram that divides the (P2,P1) plane into regions with qualitatively different x versus λ-bifurcation diagrams.
References
- 1.Smolen, P., D. A. Baxter, and J. H. Byrne. 2000. Mathematical modeling of gene networks. Neuron. 26:567–580. [DOI] [PubMed] [Google Scholar]
- 2.Goldbeter, A. 2002. Computational approaches to cellular rhythms. Nature. 420:238–245. [DOI] [PubMed] [Google Scholar]
- 3.Tyson, J. J., K. C. Chen, and B. Novak. 2003. Sniffers, buzzers, toggles and blinkers: dynamics of regulatory and signaling pathways in the cell. Curr. Opin. Cell Biol. 15:221–231. [DOI] [PubMed] [Google Scholar]
- 4.Kitano, H. 2002. Systems biology: a brief overview. Science. 295:1662–1664. [DOI] [PubMed] [Google Scholar]
- 5.Guckenheimer, J., and P. Holmes. 1983. Nonlinear Oscillations, Dynamical Systems and Bifurcation of Vector Fields. Springer, New York.
- 6.Strogatz, S. H. 1994. Nonlinear Dynamics and Chaos: With Applications to Physics, Biology, Chemistry, and Engineering. Addison-Wesley, Reading, MA.
- 7.Balakotaiah, V., and D. Luss. 1984. Global analysis of the multiplicity features of multi-reaction lumped-parameter models. Chem. Eng. Sci. 39:865–881. [Google Scholar]
- 8.Golubitsky, M., and D. G. Schaeffer. 1985. Singularities and Groups in Bifurcation Theory, Vol. 1. Springer-Verlag, New York.
- 9.Scholz, K. P., and J. H. Byrne. 1987. Long-term sensitization in Aplysia: biophysical correlates in tail sensory neurons. Science. 235:685–687. [DOI] [PubMed] [Google Scholar]
- 10.Mauelshagen, J., G. R. Parker, and T. J. Carew. 1996. Dynamics of induction and expression of long-term synaptic facilitation in Aplysia. J. Neurosci. 16:7099–7108. [DOI] [PMC free article] [PubMed] [Google Scholar]
- 11.Sutton, M. A., J. Ide, S. E. Master, and T. J. Carew. 2002. Interaction between amount and pattern of training in the induction of intermediate- and long-term memory for sensitization in Aplysia. Learn. Mem. 9:29–40. [DOI] [PMC free article] [PubMed] [Google Scholar]
- 12.Wainwright, M. L., J. H. Byrne, and L. J. Cleary. 2004. Dissociation of morphological and physiological changes associated with long-term memory in Aplysia. J. Neurophysiol. 92:2628–2632. [DOI] [PubMed] [Google Scholar]
- 13.Kandel, E. R. 2001. The molecular biology of memory storage: a dialogue between genes and synapses. Science. 294:1030–1038. [DOI] [PubMed] [Google Scholar]
- 14.Frost, W. N., V. F. Castelluci, R. D. Hawkins, and E. R. Kandel. 1985. Monosynaptic connections made by the sensory neurons of the gill- and siphon-withdrawal reflex in Aplysia participate in the storage of long-term memory for sensitization. Proc. Natl. Acad. Sci. USA. 82:8266–8269. [DOI] [PMC free article] [PubMed] [Google Scholar]
- 15.Cleary, L. J., W. L. Lee, and J. H. Byrne. 1998. Cellular correlates of long-term sensitization in Aplysia. J. Neurosci. 18:5988–5998. [DOI] [PMC free article] [PubMed] [Google Scholar]
- 16.Pittenger, C., and E. R. Kandel. 2003. In search of general mechanisms for long-lasting plasticity: Aplysia and the hippocampus. Philos. Trans. R. Soc. Lond. B Biol. Sci. 358:757–763. [DOI] [PMC free article] [PubMed] [Google Scholar]
- 17.Pettigrew, D., P. Smolen, D. A. Baxter, and J. H. Byrne. 2005. Dynamic properties of regulatory motifs associated with induction of three temporal domains of memory in Aplysia. J. Comput. Neurosci. 18:163–181. [DOI] [PubMed] [Google Scholar]
- 18.Laurent, M., and N. Kellershohn. 1999. Multistability: a major means of differentiation and evolution in biological systems. Trends Biochem. Sci. 24:418–422. [DOI] [PubMed] [Google Scholar]
- 19.Hofer, T., H. Mathansen, M. Lohning, A. Radbruch, and R. Heinrich. 2002. GATA-3 transcriptional imprinting in Th2 lymphocytes: a mathematical model. Proc. Natl. Acad. Sci. USA. 99:9364–9368. [DOI] [PMC free article] [PubMed] [Google Scholar]
- 20.Mariani, L., M. Lohning, A. Radbuch, and T. Hofer. 2004. Transcriptional control networks of cell differentiation: insights from helper T lymphocytes. Prog. Biophys. Mol. Biol. 86:45–76. [DOI] [PubMed] [Google Scholar]
- 21.Ferrell, J. E., and W. Xiong. 2001. Bistability in cell signaling: how to make continuous processes discontinuous, and reversible processes irreversible. Chaos. 11:227–236. [DOI] [PubMed] [Google Scholar]
- 22.Ferrell, J. E. 2002. Self-perpetuating states in signal transduction: positive feedback, double-negative feedback and bistability. Curr. Opin. Chem. Biol. 6:104–114. [DOI] [PubMed] [Google Scholar]
- 23.Xiong, W., and J. E. Ferrell. 2003. A positive feedback-based bistable “memory module” that governs a cell fate decision. Nature. 426:460–465. [DOI] [PubMed] [Google Scholar]
- 24.Mohamed, H. A., W. Yao, D. Fioravante, P. D. Smolen, and J. H. Byrne. 2005. cAMP-response elements in Aplysia creb1, creb2, and Ap-uch promoters: implications for feedback loops modulating long term memory. J. Biol. Chem. 280:27035–27043. [DOI] [PubMed] [Google Scholar]
- 25.Hegde, A. N., K. Inokuchi, W. Pei, A. Casadio, M. Ghirardi, D. G. Chain, K. C. Martin, E. R. Kandel, and J. H. Schwartz. 1997. Ubiquitin C-terminal hydrolase is an immediate-early gene essential for long-term facilitation in Aplysia. Cell. 89:115–126. [DOI] [PubMed] [Google Scholar]
- 26.Dugan, L. L., J. S. Kim, Y. Zhang, R. D. Bart, Y. Sun, D. M. Holtzman, and D. H. Gutmann. 1999. Differential effects of cAMP in neurons and astrocytes. Role of B-raf. J. Biol. Chem. 274:25842–25848. [DOI] [PubMed] [Google Scholar]
- 27.Morozov, A., I. A. Muzzio, R. Bourtchouladze, N. Van-Strien, K. Lapidus, D. Yin, D. G. Winder, J. P. Adams, and J. D. Sweatt. 2003. Rap1 couples cAMP signaling to a distinct pool of p42/44 MAPK regulating excitability, synaptic plasticity, learning, and memory. Neuron. 39:309–325. [DOI] [PubMed] [Google Scholar]
- 28.Chain, D. G., A. Casadio, S. Schacher, A. N. Hegde, M. Valbrun, N. Yamamoto, A. L. Goldberg, D. Bartsch, E. R. Kandel, and J. H. Schwartz. 1999. Mechanisms for generating the autonomous cAMP-dependent protein kinase required for long-term facilitation in Aplysia. Neuron. 22:147–156. [DOI] [PubMed] [Google Scholar]
- 29.Doedel, E., H. B. Keller, and J. P. Kernevez. 1991. Numerical analysis and control of bifurcation problems. I. Bifurcation in finite dimensions. Int. J. Bifurcat. Chaos. 1:493–520. [Google Scholar]
- 30.Kuznetsov, Y. A. 1995. Elements of Applied Bifurcation Theory. Springer-Verlag, New York.
- 31.Khinast, J., D. Luss, M. P. Harold, J. J. Ostermaier, and R. McGill. 1998. Continuously stirred decanting reactor: operability and stability considerations. Am. Inst. Chem. Eng. J. 44:372–387. [Google Scholar]
- 32.Keller, H. B. 1977. Numerical solutions of bifurcation and nonlinear eigenvalue problems. In Applications of Bifurcation Theory. P. H. Rabinowitz, editor. Academic Press, New York.
- 33.Seydel, R., and V. Hlavacek. 1987. Role of continuation in engineering analysis. Chem. Eng. Sci. 42:1281–1295. [Google Scholar]
- 34.Press, W. H., S. A. Teukolsky, W. T. Vetterling, and B. P. Flannery. 1992. Numerical Recipes in Fortran 77. Cambridge University Press, Cambridge.
- 35.Murray, J. D. 1993. Mathematical Biology, 2nd Ed. Springer-Verlag, Berlin.
- 36.Müller, U., and T. J. Carew. 1998. Serotonin induces temporally and mechanistically distinct phases of persistent PKA activity in Aplysia sensory neurons. Neuron. 21:1423–1434. [DOI] [PubMed] [Google Scholar]
- 37.Mauelshagen, J., G. R. Parker, and T. J. Carew. 1998. Differential induction of long-term synaptic facilitation by spaced and massed applications of serotonin at sensory neuron synapses of Aplysia Californica. Learn. Mem. 5:246–256. [PMC free article] [PubMed] [Google Scholar]
- 38.Shvartsman, S. Y., M. P. Hagan, A. Yacoub, P. Dent, H. S. Wiley, and D. A. Lauffenburger. 2002. Autocrine loops with positive feedback enable context-dependent cell signaling. Am. J. Physiol. 282:C545–C559. [DOI] [PubMed] [Google Scholar]
- 39.Lai, K., M. J. Robertson, and D. V. Shaffer. 2004. The sonic hedgehog signaling system as a bistable genetic switch. Biophys. J. 86:2748–2757. [DOI] [PMC free article] [PubMed] [Google Scholar]
- 40.Bhalla, U. S., and R. Iyengar. 1999. Emergent properties of networks of biological signaling pathways. Science. 283:381–387. [DOI] [PubMed] [Google Scholar]
- 41.Lisman, J. E., and J. R. Fallon. 1999. What maintains memories? Science. 283:339–340. [DOI] [PubMed] [Google Scholar]
- 42.Zhabotinsky, A. 2000. Bistability in the Ca2+/Calmodulin-dependent protein kinase-phosphatase system. Biophys. J. 79:2211–2221. [DOI] [PMC free article] [PubMed] [Google Scholar]
- 43.Lisman, J. E., and A. M. Zhabotinsky. 2001. A model of synaptic memory: a CaMKII/PP1 switch that potentiates transmission by organizing an AMPA receptor anchoring assembly. Neuron. 31:191–201. [DOI] [PubMed] [Google Scholar]
- 44.Roberson, E. D., and J. D. Sweatt. 2001. Memory-forming chemical reactions. Rev. Neurosci. 12:41–50. [DOI] [PubMed] [Google Scholar]
- 45.Roberson, E. D., and J. D. Sweatt. 1999. A biochemical blueprint for long-term memory. Learn. Mem. 6:381–388. [PMC free article] [PubMed] [Google Scholar]
- 46.Lisman, J. E., H. Schulman, and H. Cline. 2002. The molecular basis of CaMKII function in synaptic and behavioral memory. Nat. Rev. Neurosci. 3:175–190. [DOI] [PubMed] [Google Scholar]
- 47.Miller, P., A. M. Zhabotinsky, J. E. Lisman, and X. J. Wang. 2005. The stability of a stochastic CaMKII switch: dependence on the number of enzyme molecules and protein turnover. PLoS Biol. 3:705–717. [DOI] [PMC free article] [PubMed] [Google Scholar]
- 48.Bhalla, U. S., P. T. Ram, and R. Iyengar. 2002. MAP kinase phosphatase as a locus of flexibility in a mitogen-activated protein kinase signaling network. Science. 297:1018–1023. [DOI] [PubMed] [Google Scholar]
- 49.Si, K., M. Giustetto, A. Etkin, R. Hsu, A. M. Janisiewicz, M. C. Miniaci, J. H. Kim, H. Zhu, and E. R. Kandel. 2003. A neuronal isoform of CPEB regulates local protein synthesis and stabilizes synapse-specific long-term facilitation in Aplysia. Cell. 115:893–904. [DOI] [PubMed] [Google Scholar]
- 50.Bailey, C. H., E. R. Kandel, and K. Si. 2004. The persistence of long-term memory: a molecular approach to self-sustaining changes in learning-induced synaptic growth. Neuron. 44:49–57. [DOI] [PubMed] [Google Scholar]
- 51.Levenson, J. M., and J. D. Sweatt. 2004. Translating prions at the synapse. Nat. Cell Biol. 6:184–187. [DOI] [PubMed] [Google Scholar]
- 52.Arkin, A., J. Ross, and H. H. McAdams. 1998. Stochastic kinetic analysis of developmental pathway bifurcation in phase λ-infected Escherichia coli cells. Genetics. 149:1633–1648. [DOI] [PMC free article] [PubMed] [Google Scholar]
- 53.Fonseca, R., U. V. Nagerl, R. G. Morris, and T. Bonhoeffer. 2004. Competing for memory: hippocampal LTP under regimes of reduced protein synthesis. Neuron. 44:1011–1020. [DOI] [PubMed] [Google Scholar]
- 54.Burrone, J., and V. N. Murthy. 2003. Synaptic gain control and homeostasis. Curr. Opin. Neurobiol. 13:560–567. [DOI] [PubMed] [Google Scholar]
- 55.Martin, S. J., and R. G. Morris. 2002. New life in an old idea: the synaptic plasticity and memory hypothesis revisited. Hippocampus. 12:609–636. [DOI] [PubMed] [Google Scholar]
- 56.Lynch, M. A. 2004. Long-term potentiation and memory. Physiol. Rev. 84:87–136. [DOI] [PubMed] [Google Scholar]
- 57.English, J. D., and J. D. Sweatt. 1997. A requirement for the mitogen-activated protein kinase cascade in hippocampal long term potentiation. J. Biol. Chem. 272:19103–19106. [DOI] [PubMed] [Google Scholar]
- 58.Huang, Y. Y., K. C. Martin, and E. R. Kandel. 2000. Both protein kinase A and mitogen-activated protein kinase are required in the amygdala for the macromolecular synthesis-dependent late phase of long-term potentiation. J. Neurosci. 20:6317–6325. [DOI] [PMC free article] [PubMed] [Google Scholar]
- 59.Matsushita, M., K. Tomizawa, A. Moriwaki, and S. T. Li. 2001. A high-efficiency protein transduction system demonstrating the role of PKA in long-lasting long-term potentiation. J. Neurosci. 21:6000–6007. [DOI] [PMC free article] [PubMed] [Google Scholar]
- 60.Waltereit, R., B. Dammermann, P. Wulff, J. Scafidi, U. Staubli, G. Kauselmann, M. Bundman, and D. Kuhl. 2001. Arg3.1/Arc mRNA induction by Ca2+ and cAMP requires protein kinase A and mitogen-activated protein kinase/extracellular regulated kinase activation. J. Neurosci. 21:5484–5493. [DOI] [PMC free article] [PubMed] [Google Scholar]
- 61.Bailey, C. H., D. Bartsch, and E. R. Kandel. 1996. Toward a molecular definition of long-term memory storage. Proc. Natl. Acad. Sci. USA. 93:13445–13552. [DOI] [PMC free article] [PubMed] [Google Scholar]
- 62.Barth, A. L., M. McKenna, S. Glazewski, P. Hill, S. Impey, D. Storm, and K. Fox. 2000. Upregulation of cAMP response element-mediated gene expression during experience-dependent plasticity in adult neocortex. J. Neurosci. 20:4206–4216. [DOI] [PMC free article] [PubMed] [Google Scholar]
- 63.Leutgeb, J. K., J. U. Frey, and T. Behnisch. 2005. Single cell analysis of activity-dependent cyclic AMP-responsive element-binding protein phosphorylation during long-lasting long-term potentiation in area CA1 of mature rat hippocampal-organotypic cultures. Neuroscience. 131:601–610. [DOI] [PubMed] [Google Scholar]
- 64.Mayford, M., and E. R. Kandel. 1999. Genetic approaches to memory storage. Trends Genet. 15:463–470. [DOI] [PubMed] [Google Scholar]
- 65.Josselyn, S. A., C. Shi, W. A. Carlezon, R. L. Neve, E. J. Nestler, and M. Davis. 2001. Long-term memory is facilitated by cAMP response element-binding protein overexpression in the amygdala. J. Neurosci. 21:2404–2412. [DOI] [PMC free article] [PubMed] [Google Scholar]
- 66.Kida, S., S. A. Josselyn, S. P. de Ortiz, J. H. Kogan, I. Chevere, S. Masushige, and A. J. Silva. 2002. CREB required for the stability of new and reactivated fear memories. Nat. Neurosci. 5:348–355. [DOI] [PubMed] [Google Scholar]
- 67.Lonze, B. E., and D. D. Ginty. 2002. Function and regulation of CREB family transcription factors in the nervous system. Neuron. 35:605–623. [DOI] [PubMed] [Google Scholar]
- 68.Pittenger, C., Y. Y. Huang, R. F. Paletzki, R. Bourtchouladze, H. Scanlin, S. Vronskaya, and E. R. Kandel. 2002. Reversible inhibition of CREB/ATF transcription factors in region CA1 of the dorsal hippocampus disrupts hippocampus-dependent spatial memory. Neuron. 34:447–462. [DOI] [PubMed] [Google Scholar]
- 69.Balakotaiah, V., D. Luss, and B. L. Keyfitz. 1985. Steady state multiplicity analysis of lumped-parameter systems described by a set of algebraic equations. Chem. Eng. Commun. 36:121–147. [Google Scholar]


