Abstract
To investigate the properties of a pure liquid ordered (Lo) phase in a model membrane system, a series of saturated phosphatidylcholines combined with cholesterol were examined by variable temperature multinuclear (1H, 2H, 13C, 31P) solid-state NMR spectroscopy and x-ray scattering. Compositions with cholesterol concentrations ≥40 mol %, well within the Lo phase region, are shown to exhibit changes in properties as a function of temperature and cholesterol content. The 2H-NMR data of both cholesterol and phospholipids were used to more accurately map the Lo phase boundary. It has been established that the gel-Lo phase coexistence extends to 60 mol % cholesterol and a modified phase diagram is presented. Combined 1H-, 2H-, 13C-NMR, and x-ray scattering data indicate that there are large changes within the Lo phase region, in particular, 1H-magic angle spinning NMR and wide-angle x-ray scattering were used to examine the in-plane intermolecular spacing, which approaches that of a fluid Lα phase at high temperature and high cholesterol concentrations. Although it is well known for cholesterol to broaden the gel-to-fluid transition temperature, we have observed, from the 13C magic angle spinning NMR data, that the glycerol region can still undergo a “melting”, though this is broadened with increasing cholesterol content and changes with phospholipid chain length. Also from 2H-NMR order parameter data it was observed that the effect of temperature on chain length became smaller with increasing cholesterol content. Finally, from the cholesterol order parameter, it has been previously suggested that it is possible to determine the degree to which cholesterol associates with different phospholipids. However, we have found that by taking into account the relative temperature above the phase boundary this relationship may not be correct.
INTRODUCTION
Despite the intense interest in the structural role of cholesterol (Chol) in cells and the wealth of literature on the cholesterol-rich liquid ordered (Lo) phase in model membrane systems there are still many aspects of the effects of cholesterol on phospholipid membranes that remain unresolved (1–3). More recently, the cholesterol-rich Lo phase has been strongly associated with microdomains in living cells—the so-called “lipid rafts” (4–10).
Previously, model binary systems have tended to concentrate on lower cholesterol contents, similar to that found in the cell plasma membrane. Although the amount of cholesterol in the bilayer may often be relatively small, recent ternary systems of two lipids (with different affinities for cholesterol such as DOPC and DPPC) with cholesterol have shown a strong preference for cholesterol to partition into a separate Lo phase in preference to being associated with the disordered fluid lamellar (Lα) phase (11–14). This gives rise to a much higher effective concentration of cholesterol within these liquid ordered domains. In this article we chose to investigate higher concentrations of cholesterol, which we believe are more relevant to the phase behavior of these membrane domains.
The liquid ordered phase can be characterized as having fast long axis rotation and lateral diffusion rates (15) similar to the Lα phase, but with the acyl hydrocarbon chains being predominantly in an all-trans conformation (16–18). Although many agree with the general definition of the Lo phase from 2H-NMR studies, there is little consensus regarding other structural features of this phase, such as the position of the cholesterol molecule within the bilayer, the role of hydrogen bonding, flip-flop rates, population of gauche states, maximum solubility of cholesterol, and inequivalence of the sn-1 and sn-2 chains.
A variety of other methodologies have also been applied to studying the Lo phase including: x-ray diffraction (19–21), differential scanning calorimetry (22–24), Fourier transform infrared spectroscopy (25), fluorescence labeling (15), neutron scattering (26–28), and electron spin resonance (29).
The construction of accurate phase diagrams for PC/Chol mixtures is difficult as cholesterol is known to act as a “phase moderator” (1); thus it fluidizes the gel phase and orders the Lα phase, which causes a broadening and eventual removal of clear phase transitions. To further complicate matters, although regions of phase coexistence are thought to exist in these binary systems, the size and lifetime of different domains remains unknown, which makes comparisons between different techniques problematic.
In contrast to homogeneous lamellar phases (e.g., Lα, Lβ, Lc), which have a well-defined set of properties with only quite small deviations from these attributes, our studies have shown that the Lo phase is an extremely diverse phase, with a marked dependence on phospholipid species, temperature, and composition. This may go some way to explaining the differing values and conclusions in previous studies of the Lo phase (30,31). To minimize any perturbation of the Lo phase, we have avoided the use of bulky, perturbing probes, associated with fluorescence and ESR, instead concentrating on solid-state NMR and x-ray diffraction that can be carried out either with the natural lipids and cholesterol, or with deuterated molecules, which can be expected to behave essentially identically to the native lipids.
Differences within the Lo phase have been postulated previously, e.g., a 2H solid-state NMR study of DPPC/40% Chol showed different environments for the methyl groups of the sn-1 and sn-2 chains, which was removed upon heating, and the magnetic susceptibility was also seen to vary with temperature. Neutron scattering studies have shown variations in diffusion rates, changing at a critical temperature, and have even suggested the existence of a “hidden phase boundary” (30).
MATERIALS AND METHODS
Materials
The phospholipids (>98% purity) were purchased from Avanti Polar Lipids, Birmingham, AL and used without further purification. Cholesterol (Aldrich Chemical, Gillingham, UK) was supplied in the monohydrate form. The phospholipid mixtures were lyophilized from cyclohexane (with a drop of methanol to aid dissolution) (Aldrich Chemical) and molar ratios calculated assuming two waters per phospholipid molecule (dihydrate). The 3α-2H cholesterol (Chol-d1) was synthesized following the method of Oldfield et al. (17).
Sample preparation
The PC/Chol mixtures were made up by dissolving appropriate mol ratios of PC with cholesterol in cyclohexane (with a drop of methanol to aid dissolution), sonicating for 20 min, and leaving overnight, the solvent then being removed under vacuum (checked by 13C-NMR spectrometry). Pure D2O or HPLC grade H2O was then added (50 wt%) to the PC/Chol mixture, the resulting mixture was centrifuged, subjected to two to three freeze thaw cycles, sealed, and then kept in a 50°C oven overnight. The hydrated phospholipid/cholesterol mixtures were placed in 2.5-mm or 4-mm zirconia NMR rotors or 1.5-mm x-ray capillary tubes and stored at −5°C until studied. All samples were made up by mol %. Levels higher than 60 mol % were not examined because of problems of cholesterol crystal formation.
NMR spectroscopy
All NMR data were acquired on a Bruker (Karlsruhe, Germany) DRX 600 MHz NMR spectrometer operating at 14.09 T, with a 1H resonance of 600.1 MHz, 2H resonance of 92.1 MHz, 13C resonance of 150.9 MHz, and a 31P resonance of 242.9 MHz. Recycle delays for 1H were between 1.0 and 3.0 s, 13C was 2.0 s, 31P was 2.0 s, and 2H was 0.5 s. Typically between 64 and 12,000 scans were collected depending upon the sample and nucleus type. Samples were placed in 2.5-mm or 4-mm zirconia rotors and magic angle spinning performed at speeds of 3–5 kHz. Single pulse and proton decoupled spectra were acquired using standard pulse programs. Deuterium spectra were acquired using a standard phase-cycled quadrupole echo pulse sequence (16). Order parameters were calculated using well-established methodologies (17,32).
X-ray scattering
X-ray diffraction measurements were carried out using a specialized in-house SAXS/WAXS beamline coupled to a copper target Bede Microsource (Durham, UK) x-ray generator with integrated glass polycapillary x-ray focusing optics. The Ni-filtered Cu Kα radiation (λ = 1.54 Å) was cut down with 300-mm pinholes. X-ray diffraction images were acquired on an x-ray intensified charge-coupled device Photonic Science (East Sussex, UK) Gemstar detector with acquisition and analysis carried out with specialist software, written in-house. Samples were sealed in 1.5-mm glass capillary tubes and placed in a specialized temperature-controlled sample holder within an evacuated flight chamber. The sample holder has computer-controlled Peltier-based temperature control over a range of −30–120°C with an accuracy of ±0.5°C, calibrated with samples of known transition points.
RESULTS
1H MAS NMR
The application of MAS partially removes the chemical shift anisotropy and dipolar coupling present in solid-state NMR to yield a spectrum comparable to a simple solution state spectrum (33,34) Different regions of the phospholipid (DPPC) and cholesterol molecule show characteristic chemical shifts as reported previously.
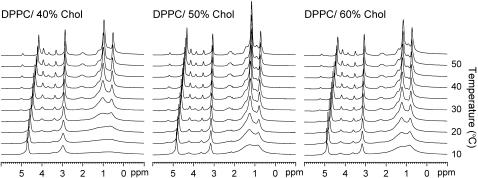
Between 0.0 and 2.5 ppm there are large changes to the peak intensity with varying PC/Chol ratio and temperature (Fig. 1).
FIGURE 1.
1H MAS spectra of DPPC/40% Chol, DPPC/50% Chol, and DPPC/60% Chol between 10 and 50°C.
In this region the signal is dominated by the phospholipid chain methylenes, but there is also a contribution from the cholesterol molecules. At 5°C increasing the concentration of cholesterol (40–60 mol %) causes a narrowing of the methylene chain peaks but has little influence on the linewidth of the headgroup signals. Raising the temperature from 5 to 60°C causes continuous line narrowing of the chain methylenes, dominated by strong proton-proton through space coupling (see Discussion).
The effects of temperature were examined on a series of saturated diacylphosphatidylcholines in equimolar concentrations with cholesterol (PC (C12-C18)/50% Chol, spectra not shown). The phospholipid chains showed similar behavior to the DPPC/50% Chol with a continuous narrowing of the methylene signals. This transition was broad in all cases and centered around the gel to fluid transition of the pure phospholipid, Tm. However, at shorter chain lengths the temperature range of the transition was the greatest.
The trend in linewidth for the chain methylenes is also mirrored for the glycerol peaks: at lower temperatures these are broad, and sharpen as the temperature is increased. This may be attributed to either residual proton-proton dipolar coupling, or a distribution of chemical shifts from a distribution of conformations around the interfacial region.
For low cholesterol contents and longer acyl chains (DPPC and DSPC) a broadening of the headgroup peaks is seen, similar to that of a gel phase, where headgroup motion is more constrained than in the Lα phase. This broadening of the choline peaks at low temperatures may be indicative of the presence of a gel phase, or a region of gel-fluid coexistence (see Discussion).
The use of perdeuterated phospholipids was employed to remove the signals from the phospholipid chains and allow resolution of the cholesterol peaks (Supplemental Fig. 1, Supplementary Material). These spectra showed small variations compared to the phospholipid methylene chains across the same temperature range. However, at lower temperatures there is a significant broadening of the cholesterol peaks, which corresponds to a reduction in the cholesterol motion and correlates with the evidence for a gel phase or a region of gel-fluid coexistence at lower temperatures.
31P MAS NMR
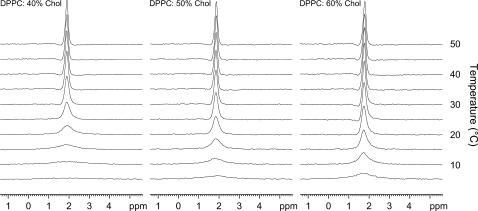
The static CSA pattern for DPPC/50% Chol is found to be axially symmetric, with Δσ of 38 ppm, resembling a characteristic powder pattern of fluid lamellar phases at all temperatures (data not shown). MAS NMR can be used to partially remove the contribution of CSA to the line shape to reveal the isotropic chemical shift of the 31P. The effect of temperature and cholesterol content was examined in an analogous manner to the 1H MAS and revealed a broadening at lower temperatures, which was most dominant for lower cholesterol content (Fig. 2).
FIGURE 2.
31P MAS spectra of DPPC/40% Chol, DPPC/50% Chol, and DPPC/60% Chol between 5 and 50°C.
This strongly correlates with the changes observed to the headgroup signals in the 1H MAS spectra (Fig. 1). A similar trend was seen for various phospholipid chain lengths in support of the 1H MAS data.
13C MAS NMR
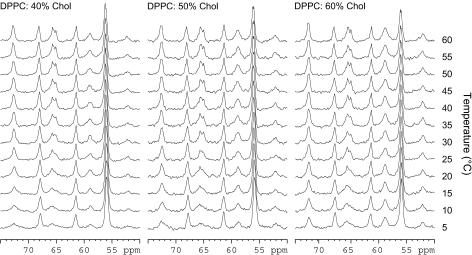
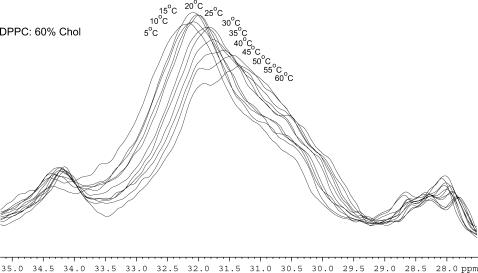
High-resolution 13C MAS allows easy assignment of both cholesterol and phospholipid peaks (Supplemental Fig. 2, Supplementary Material). A number of changes are observed in the 13C MAS spectrum with varying temperature and cholesterol concentration (Figs. 3 and 4): these are the broadening of the carbonyl and glycerol peaks and changes in chemical shift distribution of the phospholipid acyl chains. The carbon spectra also mirror the data from other nuclei studied, showing a broadening of some peaks at lower temperatures.
FIGURE 3.
13C MAS spectra of DPPC/40% Chol, DPPC/50% Chol, and DPPC/60% Chol between 5 and 60°C showing the glycerol and headgroup regions.
FIGURE 4.
13C MAS spectra of DPPC/60% Chol between 5 and 60°C showing changes to chemical shift of the methylene region.
For all the samples studied there are changes to the glycerol backbone peaks with temperature, which are broad at low temperatures (similar to a gel phase) but sharpen as they are heated, to resemble a fluid lamellar phase (Fig. 3). This is most likely a result of a distribution of conformations that are interchanging too slowly to yield a sharp well-resolved peak on the NMR timescale. The temperature at which this occurs varies with chain length, while increasing the concentration of cholesterol only appears to broaden the temperature range over which the transition occurs. The carbonyl group follows the same trend as the glycerol peaks. The carbonyl peak is split into two distinctive peaks; the nature of this splitting has been discussed elsewhere (35,36) and is beyond the scope of this work.
The acyl chains of the phospholipid molecule also show changes in temperature as the peak that arises from the methylenes varies in width, intensity, and chemical shift (Fig. 4). Increasing the temperature causes a movement in chemical shift toward 0 ppm. If the temperature is increased further, then the decrease in chemical shift continues but a greater distribution of chemical shifts is seen. This occurs for all the mixtures studied in approximately the same temperature range (25–30°C), although mixtures containing <40 mol % cholesterol have not been studied. The change in peak position of the internal methylenes upon heating is larger for lower cholesterol concentrations and for shorter chain lengths.
2H-NMR
In addition to studies on nuclei of natural abundance, deuterium labels were also employed. Cholesterol was deuterated at the C3 position (Chol-d1) to show the molecular motion of the cholesterol (17), whereas perdeuterated DMPC-d54 and DPPC-d62 allowed us to examine the behavior of the chain region of the phospholipid.
The DPPC/Chol-d1 samples (40–60 mol %) showed a broadening of the Pake doublet at lower temperatures (Supplemental Fig. 3, Supplementary Material). This effect is mitigated with larger cholesterol concentrations and is also observed for shorter chain lengths at lower temperatures (spectra not shown). The occurrence of this broadening corresponds to similar effects observed with other nuclei studied (see above). Increasing the temperature removed this broadening and resulted in a well-defined Pake doublet similar to those obtained by Oldfield et al. (17) and Brzustowicz et al. (37).
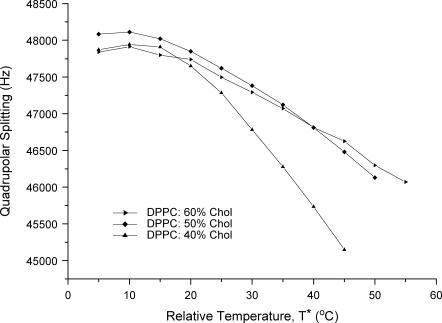
The temperature dependence of the quadrupolar splitting was shown to be nonlinear for lower cholesterol concentrations (DPPC/40% Chol-d1), but approaches a linear trend at higher temperatures. Additional cholesterol mitigates the temperature dependence (Fig. 5).
FIGURE 5.
Graph of quadrupolar splitting versus relative temperature, T*, for DPPC/40% Chol-d1, DPPC/50% Chol-d1, and DPPC/60% Chol-d1 between 5 and 55°C. T* is the temperature above the gel + Lo phase boundary.
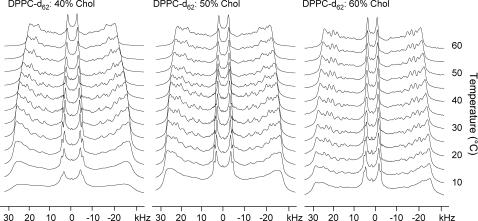
To further understand the interactions the phospholipid chains were also investigated using a series of perdeuterated PC/Chol mixtures. These studies agreed with previous findings on similar systems reported by others. Deuterium spectra of unoriented multilamellar vesicles were acquired for DPPC-d62/40–60% Chol between 5 and 60°C (Fig. 6).
FIGURE 6.
2H spectra of DPPC-d62/40% Chol, DPPC-d62/50% Chol, and DPPC-d62/60% Chol between 5 and 60°C.
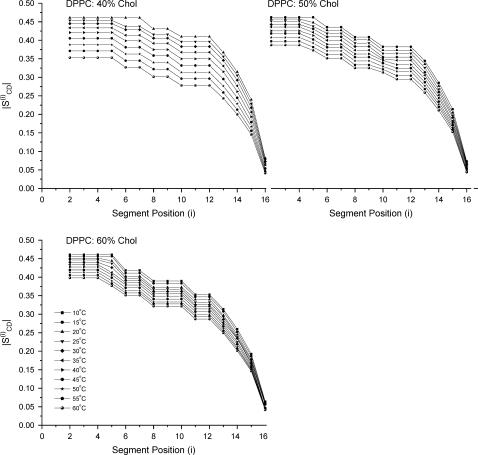
At lower temperatures the powder pattern is initially indicative of a characteristic gel phase (16), and increasing cholesterol content introduces resolved features with characteristic splittings of the Lo phase (31). Increasing the temperature produces resolved splittings that are further narrowed as the temperature is raised. These spectra may be dePaked, and order parameters obtained for various chain segments, which may be plotted to give familiar order parameter profiles (Fig. 7).
FIGURE 7.
Order profiles of DPPC-d62/40% Chol, DPPC-d62/50% Chol, and DPPC-d62/60% Chol between 5 and 60°C.
There is a general decrease in the order profile as the temperature is increased, and with greater cholesterol content the effect of temperature on the order profile is reduced. The order profiles can also be related to a chain extension for each chain segment and these can be summed down the chain to give an estimate of the hydrocarbon chain length. The data below show the estimated chain length of the sn-2 C16 chain (Table 1).
TABLE 1.
Estimated chain lengths (C1–C16) using the continuous distribution model for DPPC/40–60% Chol at various temperatures
| Temperature (°C) | DPPC 40% Chol/Å | DPPC 50% Chol/Å | DPPC 60% Chol/Å |
|---|---|---|---|
| 10 | 18.3 | 18.4 | 18.4 |
| 15 | 18.2 | 17.8 | 17.4 |
| 20 | 18.0 | 17.7 | 17.3 |
| 25 | 17.8 | 17.5 | 17.2 |
| 30 | 17.7 | 17.4 | 17.1 |
| 35 | 17.5 | 17.3 | 17.0 |
| 40 | 17.3 | 17.1 | 16.9 |
| 45 | 17.0 | 17.0 | 16.8 |
| 50 | 16.7 | 16.8 | 16.7 |
| 55 | 16.4 | 16.7 | 16.6 |
| 60 | 16.1 | 16.5 | 16.5 |
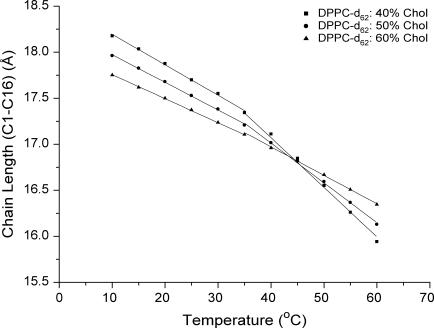
An average of the chain length from the odd and even carbons was taken and this gives a chain length of 17.6–16.3 Å for DPPC/50% Chol between 15 and 60°C and a chain length of 18.3 Å for the low-temperature gel phase of DPPC/40% Chol. The maximum possible chain extension for an all-trans chain is 19.0 Å. Comparison between the three cholesterol ratios show that increasing the content of cholesterol reduces the influence of temperature (Fig. 8) on the chain length, with little or no effect between DPPC/50% Chol and DPPC/60% Chol.
FIGURE 8.
Temperature dependence of the DPPC-d62 chain length (sn-2 chain) for DPPC/40–60% Chol estimated from the order parameters.
The temperature dependence of the chain length appears to change within the Lo phase region around 35°C. This effect is reduced as the cholesterol content is increased.
The central methyl peaks show inequivalence between the sn-1 and sn-2 chains (18,30). These peaks coalesce at higher temperatures (Supplemental Fig. 4, Supplementary Material), an effect that may be due to increased conformational freedom around the glycerol region.
X-ray scattering
Small-angle and wide-angle x-ray scattering were employed to measure the repeat spacing, to confirm that no cholesterol crystals were present (38), and to probe the in-plane packing within the bilayer. The small-angle reflections gave an interlamellar bilayer spacing (data not shown) characteristic of the phospholipid chain length and the cholesterol composition, but which varied by only 1 Å over the 5–65°C temperature range studied, for DPPC/40% Chol, DPPC/50% Chol, DPPC/60% Chol, and DMPC/50% Chol.
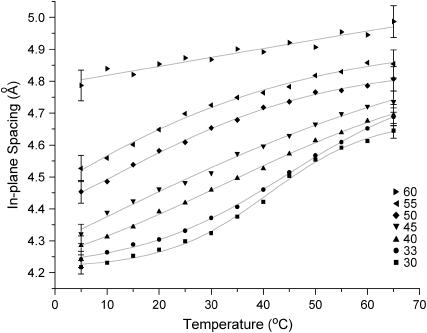
The wide-angle x-ray peak is very broad for all systems studied, and the position of the maximum shows a strong temperature dependence (Supplemental Fig. 5, Supplementary Material). For DPPC/40% Chol this reflection is centered at 4.2 Å at low temperatures and shifts to 4.6 Å by 55°C. The fact that the wide-angle peak is broad indicates that the in-plane packing of the molecules within the bilayer is disordered, as in the fluid lamellar Lα phase. For the Lα phase of DLPC and DMPC in excess water WAXS shows a peak at 4.6 ± 0.1 Å, which only marginally increases with temperature, within the limits of error. There was no detectable difference in the spacing between the two different phospholipids.
The shifts in the position of the diffuse wide-angle peak within the Lo phase reveal a pronounced temperature dependence of the in-plane structure, with the average separation between phospholipid/cholesterol molecules increasing markedly with increasing temperature. The largest shifts in the diffuse peak position are seen for the lowest cholesterol concentrations (Fig. 9), with a sigmoidal shape of the curve of peak position versus temperature.
FIGURE 9.
In-plane spacing of DPPC/30–60% Chol as a function of temperature.
DISCUSSION
Phase coexistence region
At low temperatures the presence of another phase is observed, reported by Huang et al. as an LGII phase (39), which is evident from the 2H spectra of the perdeuterated phospholipids (Fig. 6) and from the Chol-d1 (Supplemental Fig. 3, Supplementary Material). Gel phases are known to show much broader signals than fluid phases due to the lack of molecular motion compared to the NMR timescale (16). For DPPC/40% Chol at 5°C the 2H spectra show no fine structure except for the terminal methyl groups, which is typical for a pure gel phase. Increasing the temperature results in the appearance of fine structure; this is due to a proportion of the lipids existing in the Lo phase, having long axis rotation that is fast on the NMR timescale. This is paralleled for the deuterated Chol-d1, where a superposition of a broad peak from the gel phase and a sharp Pake doublet from the Lo phase coexist (Supplemental Fig. 3, Supplementary Material).
With the exception of deuterium NMR, observing this type of phase coexistence is problematic due to certain similarities of the gel phase and the Lo phase. The fast lateral diffusion of the Lo phase, with a disordered packing of the molecules within the plane of the bilayer, gives rise to a broad x-ray diffraction peak in the wide-angle region. However, the introduction of sufficient cholesterol into a gel phase causes a disruption to the phospholipid packing and results in a similar broad wide-angle diffraction peak (20), even when the 2H spectra shows slower molecular motion. The predominantly all-trans state of the chains in both phases means it is difficult to distinguish them by 13C MAS NMR. Although gel and fluid lamellar phases show different peaks in 1H MAS NMR due to partial averaging of dipolar interactions by the larger intermolecular distances and increased motion within the latter phase, at no point are two superimposed coexisting sets of peaks observed in our data (Fig. 1).
A possible explanation for the 1H line shape is spin diffusion (40,41). Spin diffusion is directly proportional to the dipolar induced transition probability between neighboring spins and thus related to the through-space coupling between protons. Therefore, for strongly dipolar-coupled nuclei, e.g., 1H, and to a much lesser extent, 31P, spin diffusion contributes significantly to the linewidths of the peaks. Between 1H nuclei the spin diffusion coefficient has been measured as 8.0 × 10⁻¹² m2s−1 for a strongly dipolar coupled system (41). It is likely that the value of the spin diffusion coefficient (8.0 × 10⁻¹² m2s−1) is comparable to that found in the gel phase because of the much lower degree of lateral diffusion and the tighter packing (1H–1H distances between phospholipid chains ∼2.0 Å). Spin diffusion will average between coexisting gel-like phases, and result in a single peak.
Although spin diffusion rates within a phospholipid molecule (intramolecular) may be comparable to those found in the gel phase, the larger interlipid distances and the significant motion caused by the fast lateral diffusion within the Lα phase will lower the intermolecular spin diffusion rates (40,41). It has been suggested that interlipid spin diffusion rates are slower than molecular diffusion within the Lα phase (42–44). Therefore, phase coexistence may only be observed in strongly dipolar coupled systems if the lateral diffusion rates of each phase exceed the intermolecular spin diffusion rates.
For Lβ-Lα phase coexistence an averaged signal is seen for the chain protons (data not shown), which shows that there is significant spin diffusion between these phases. The same is expected to happen for Lβ-Lo phase coexistence, and it is therefore difficult to determine solely from 1H-NMR data whether the peak broadness arises from a single phase or is a result of spin diffusion between coexisting phases. However, phase coexistence between the gel and Lo phases is observed by 2H, which does not suffer from dipolar coupling, and although the 1H data suggest a single phase, this may in fact be a phase coexistence region that cannot be detected by these nuclei due to spin diffusion.
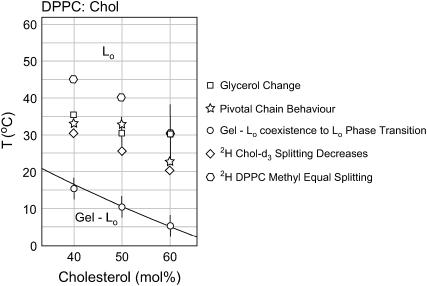
There are a number of discrepancies between the various published DPPC/Chol phase diagrams, especially in the high cholesterol/low temperature region (23). One problem is that the phase diagram of Vist and Davis (23) does not show data above 22.5 mol % cholesterol or below 28°C. The phase diagrams of McMullen and McElhaney (22) and Huang et al. (39) do show a phase coexistence region above 22.5 mol %. According to these latter authors this gel phase is present at room temperature above 30 mol % cholesterol. Despite the publication of these later phase diagrams there still tends to be a consensus within the field that above ∼25 mol % cholesterol the only phase that is present is an Lo phase. We suggest that the LGII (gel + Lo) to LGI (Lo) phase boundary extends all the way to 60 mol % (Fig. 11).
FIGURE 11.
Modified DPPC/Chol phase diagram adapted from Huang et al. (39).
Properties of the liquid ordered phase
Previous studies of the Lo phase have considered this phase to have a distinct set of properties with only small deviations from these attributes, in a similar way to the subgel, gel, or fluid lamellar phases. Although analysis of the order profiles of perdeuterated lipids provides the best means of identifying the Lo phase (predominantly all-trans chains, fast long axis rotation, and rapid lateral diffusion) it does not reveal the marked changes within the Lo phase that occur with temperature. The data presented here show that the Lo phase has a wide range of properties, which bridges the gap between the gel and fluid lamellar phases, depending on the temperature and the cholesterol content of the system.
Within the single Lo phase region (as identified by 2H-NMR of the perdeuterated phospholipid chains, (Fig. 6)) the wide-angle x-ray scattering (Supplemental Fig. 5, Supplementary Material) and 1H MAS NMR (Fig. 1) show that there is a large increase in lateral intermolecular spacing with temperature. This is directly observed from wide-angle x-ray scattering (Fig. 9), which shows an increase in the in-plane average separation of the molecules (phospholipid/cholesterol), which is initially fairly linear, but levels off toward the larger phospholipid spacings. The dominant contribution to this scattering is the hydrophobic region (phospholipid chains plus cholesterol) of the model bilayer. Further increase in cholesterol concentration continues to increase the spacing of the wide-angle diffuse peak, but reduces the temperature dependence.
For DPPC/40% Chol above 20°C the 2H data show a pure Lo phase is present, but the proton signal continues to sharpen with increasing temperature (Fig. 1). The contributions to linewidth for 1H MAS NMR arise from three sources, inter- and intrahomonuclear dipole couplings and a distribution of isotropic chemical shifts, the contribution from chemical shift anisotropy being negligible for protons. Dipolar coupling between spins is strongly related to the distance between spins and is averaged by motion. However, strong dipolar coupling is not observed in the Lα phase, which is considered to have similar motional properties to the Lo phase, these phases differing by the average interlipid spacing and the conformational state of the phospholipid chains. At higher temperatures within the Lo phase the x-ray diffraction data suggest that the average phospholipid spacing may approach that of the Lα phase; although the conformational state of the phospholipid chains remains restricted at these temperatures, the proton lineshapes become comparable to those of the Lα phase. Therefore, we can consider the proton lineshape to be dominated by a dipolar interaction that changes with interproton distance and not from chemical shift distributions caused by conformational restrictions. However, an increase in gauche states will indirectly affect the dipolar interactions by varying the interproton distances. From our data alone it is difficult to distinguish whether this interaction is dominated by inter- or intramolecular dipolar coupling.
The order profiles obtained from the 2H-NMR data of perdeuterated lipids also reflect the reduction in order of the phospholipid chains with temperature (Fig. 7). Upon entering a single phase region the order parameter for the carbon atoms nearest the interfacial region, often referred to as the “plateau region” yields a C-D order parameter of magnitude ∼0.45 for all the cholesterol contents studied (40–60 mol %). Increasing the temperature reduces the order profile; the largest changes are seen for DPPC-d62/40% Chol where the order parameter for the plateau region varies from ∼0.45 to ∼0.35 across a 40°C temperature range. Although the average interlipid distance increases with greater cholesterol concentrations, the limitations to the conformational state also increase and thus the resultant order parameter of the phospholipid chains becomes greater. The wide-angle x-ray data show that compared to the 40 mol % cholesterol, at 60 mol % cholesterol there is little change to the average in-plane phospholipid spacing with temperature, and this trend is also observed in the 2H data (Fig. 9).
Within a single Lo phase the motion of the phospholipid headgroups appears fairly invariant: the 13C MAS (Fig. 3) and 1H MAS (Fig. 1) signals from the choline show little variation across the temperatures studied. The only differences observed are for the 31P MAS: for a large range of temperatures the Lo phase gives a sharp peak, but the peak width appears uncharacteristically broad near the gel-Lo phase coexistence region (Fig. 2). This effect may be attributed to a distribution of chemical shifts from a number of different conformational states caused by motional restrictions on the glycerol backbone (see below).
A change in behavior of the chains is also seen for the estimated acyl chain lengths, obtained from the deuterium order parameters (Fig. 8). At temperatures between 10 and 35°C, the chain length of DPPC/40–60% Chol all show a similar linear decrease for the sn-2 chain (sn-1 chain lengths not obtained). However, after 35°C the gradient of the temperature dependence changes, with the most noticeable shift occurring for DPPC/40% Chol.
Upon addition of cholesterol, at lower temperatures in the liquid ordered phase a diffuse wide-angle x-ray peak is seen at 4.2 Å (Fig. 9); this spacing is strikingly similar to that observed in the gel phase, although the latter is much sharper as it arises from an ordered packing of the hydrocarbon chains onto a two-dimensional hexagonal lattice. The glycerol signals in the 13C MAS spectra at these temperatures appear very similar to a gel phase, with a large distribution of chemical environments seen (Fig. 3). This is also reflected in the 1H MAS where the glycerol peaks cannot be resolved (Fig. 1). Upon heating, the glycerol peaks in the 13C MAS spectrum sharpen significantly, approaching a comparable linewidth to the Lα phase and become resolvable by 1H MAS. The decrease in linewidth can be attributed to an increase in the conformational freedom of the glycerol region within the Lo phase as the interlipid spacing increases with temperature. The broadness of the 31P MAS spectra may also be due to this effect, with conformational restrictions around the glycerol limiting the motions of the phosphate group, although a lower temperature is required before the 31P MAS linewidth becomes invariant.
This “melting” of the glycerol region is seen for all PC/cholesterol mixtures, and for shorter chain lengths this change occurred at lower temperatures (DLPC/50% Chol, 20°C; DMPC/50% Chol, 25°C; DPPC/50% Chol, 30°C; DSPC/50% Chol, 35°C). The “melting” of the glycerol region is also affected by the concentration of cholesterol, the higher the concentration, the broader and lower the transition temperature becomes. This correlates well with an increase in phospholipid spacing as indicated by the wide-angle x-ray data and by 1H MAS.
The melting of the glycerol backbone may be the “hidden phase boundary” described by Bayerl et al. (30). It may also account for the reported differences between the sn-1 and sn-2 methyl groups (18), which become increasingly equivalent at higher temperatures (Supplemental Fig. 4, Supplementary Material). In the gel phase, the interfacial conformational restriction results in the chains being staggered, with a characteristic kink near the beginning of the sn-2 chain, but they become equivalent in the Lα phase where there is increased phospholipid spacing and fast interchange of conformations within the interfacial region.
From the 13C MAS spectra we observe a change in the behavior of the PC chains with increasing temperature within the Lo phase (Fig. 4). At lower temperatures the PC/Chol mixture behaves in an expected way, with increasing temperature causing a small and gradual shift of the internal methylenes peak to a lower chemical shift. The chemical shift of this peak has been attributed to the differences in chemical shift between the trans and gauche states of the chains, with increasing temperature resulting in an increase in the number of gauche states as the phospholipid in-plane spacing increases (Fig. 9). However, this behavior appears to reach a limit and although the center of the peak continues to move to a lower chemical shift, the peak width increases. One interpretation of this effect is that the distribution of gauche states in the hydrocarbon region has changed, with presumably more gauche states toward the center of the bilayer.
This is another example of how the Lo phase still shows properties of a broadened gel to fluid transition. These weak changes may also have been those detected by the DSC studies of McMullen and McElhaney (22), but our data identify their origins and differ in attributing these changes to be properties of a single phase and not of two separate Lo phases.
Motion of cholesterol (2H static, 1H MAS)
Although so far we have only considered the properties of the bulk bilayer or the phospholipid molecule we can also specifically look at the cholesterol molecule with solid-state NMR spectroscopy. Selective deuteration of the cholesterol molecule at the α-C3 position allows a nonperturbing probe of cholesterol motion, by using 2H-NMR spectroscopy.
At lower temperatures there is a clear superposition of peaks: a broad featureless peak associated with the gel phase coexists with a well-resolved Pake doublet from the fluid phase, adding weight to the evidence of a gel-Lo coexistence region. Raising the temperature converts the gel phase to a liquid ordered phase, and a single well-resolved Pake doublet is observed (Supplemental Fig. 3, Supplementary Material).
Within the pure Lo phase the splitting of this peak varies with temperature and cholesterol content (Fig. 5). Because the deuterium atom is on the rigid steroid frame, the only averaging effect on the quadrupolar splitting is from motion of the steroidal framework of the cholesterol molecule. Any deviation from the maximum theoretical quadrupolar splitting means that the quadrupolar interaction is being averaged by rapid axial reorientations of the steroid, which can be modeled as a time-averaged tilt angle of the molecular long axis (17,37).
Although at higher temperatures and larger cholesterol concentrations the temperature dependence of the quadrupolar splitting appears to decrease in a linear fashion; this is not the case at lower temperatures within the Lo phase.
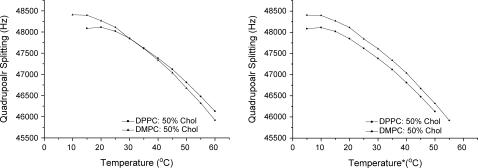
It has been suggested that the magnitude of the cholesterol order parameter can be used to distinguish the degree to which cholesterol associates with a given phospholipid, and thus whether it shows a particular preference for one phospholipid type over another (38). A problem with this view is evident from the temperature dependence of the order parameter: at lower temperatures DPPC/50% Chol shows a smaller cholesterol order parameter than DMPC/50% Chol, however, this trend is reversed above 45°C where DPPC/50% Chol now shows a larger order parameter than DMPC/50% Chol (Fig. 10, left). To clarify this, it is better to employ the relative temperature, T*, the temperature above the gel-Lo to pure Lo phase boundary for each phospholipid/cholesterol mixture. (Fig. 10, right). Using knowledge of the phase diagram clearly demonstrates that the DPPC/50% Chol shows the smallest cholesterol order parameter across all of the obtained order parameters. Therefore, care must be used when applying absolute temperatures to compare the different degrees of interaction between phospholipids and cholesterol through study of cholesterol order parameters.
FIGURE 10.
Quadrupolar splitting of DMPC/50% Chol-d1 and DPPC/50% Chol-d1 at the recorded temperature (left) and the temperature above the phase boundary (right).
A better indication of how strong a phospholipid/Chol interaction may be is to examine how sensitive to temperature changes the cholesterol order parameter is within the Lo phase.
The use of phospholipids with specifically perdeuterated acyl chains eliminates the chain protons and allows the cholesterol peaks to be easily observed directly in the 1H spectrum (Supplemental Fig. 1, Supplementary Material). This shows that above the gel-Lo phase coexistence region the cholesterol peaks are relatively invariant as expected from the rigid steroidal frame, although there is a gradual chemical shift change (toward 0 ppm) for the methyl peaks from the cholesterol, which is common with increasing temperature.
CONCLUSIONS
The data presented here show that the Lo phase has a diverse range of properties, spanning the gap between the fluid lamellar phase and the gel phase. Large changes to the phospholipid in-plane packing are observed with temperature, resulting in more conformational disorder around the glycerol backbone, motion of cholesterol toward the water interface, and a subsequent increase in free volume and gauche conformations at the center of the bilayer. We believe that these effects are general for PC mixtures that form the Lo phase, but these effects vary with phospholipid type and proportion of cholesterol.
2H-NMR data of both the cholesterol and the phospholipid were used to more accurately map the Lo phase boundary. It has been established that the Lβ-Lo phase coexistence extends to 60 mol % cholesterol and a modified phase diagram is presented. 1H MAS NMR was used to examine the different phases present but the interpretation of the results was complicated by dipolar spin diffusion processes. We have also confirmed the existence of a gel-Lo phase coexistence region, supporting the work of Huang et al. (39). However, the data presented above show that this region does not extend to the larger cholesterol concentrations as Huang et al. (39) originally proposed.
The combination of NMR spectroscopy and x-ray scattering shows that our data help to clarify why there is a range of interpretations of the structure and dynamics of this unusual phase, and allows us to gain a better understanding of the complex effects that cholesterol has on phospholipid bilayers.
SUPPLEMENTARY MATERIAL
An online supplement to this article can be found by visiting BJ Online at http://www.biophysj.org.
Supplementary Material
Acknowledgments
We thank Prof. R. H. Templer for valuable comments, Dr. D. Widdowson and Dr. E. Wilson for the gift of the Chol-d1, and Dr. H. Schäfer (Bruker Biospin GmbH) for advice on the depaking routine.
We acknowledge the Engineering & Physical Sciences Research Council for funding of J.A.C. via a Doctoral Training Award Studentship, and for Platform Grant GR/S77721.
Abbreviations used: Lα or ld, fluid lamellar liquid crystalline phase; Lo or lo, liquid ordered phase; Lβ or so, lamellar gel phase (untilted); PC, phosphatidylcholine; DLPC, di(12:0)PC or 1,2-dilauroyl-sn-glycero-3-phosphocholine; DMPC, di(14:0)PC or 1,2-dimyristoyl-sn-glycero-3-phosphocholine; DPPC, di(16:0)PC or 1,2-dipalmitoyl-sn-glycero-3-phosphocholine; DSPC, di(18:0)PC or 1,2-distearoyl-sn-glycero-3-phosphocholine; Chol, cholesterol; MAS, magic angle spinning; CSA, chemical shift anisotropy; Chol-d1, cholesterol deuterated at the C3 position or Cholesterol-3α-d1; Tm, temperature of the gel to fluid transition (chain melting); T*, temperature above the gel-Lo to Lo phase boundary.
References
- 1.Bloch, K. 1965. The biological synthesis of cholesterol. Science. 150:19–28. [DOI] [PubMed] [Google Scholar]
- 2.Bloch, K. 1983. Sterol structure and membrane function. CRC Crit. Reviews. 14:47–92. [DOI] [PubMed] [Google Scholar]
- 3.Haines, T. H. 2001. Do sterols reduce proton and sodium leaks through lipid bilayers? Prog. Lipid Res. 40:299–324. [DOI] [PubMed] [Google Scholar]
- 4.Brown, D. A., and E. London. 1998. Structure and origin of ordered lipid domains in biological membranes. J. Membr. Biol. 164:103–114. [DOI] [PubMed] [Google Scholar]
- 5.Edidin, M. 2003. The state of lipid rafts: from model membranes to cells. Annu. Rev. Biophys. Biomol. Struct. 32:257–283. [DOI] [PubMed] [Google Scholar]
- 6.McMullen, T. P. W., and R. N. McElhaney. 1996. Physical studies of cholesterol-phospholipid interactions. Curr. Opin. Colloid Interface Sci. 1:83–90. [Google Scholar]
- 7.Simons, K., and E. Ikonen. 1997. Functional rafts in cell membranes. Nature. 387:569–572. [DOI] [PubMed] [Google Scholar]
- 8.Simons, K., and E. Ikonen. 2000. Cell biology: how cells handle cholesterol. Science. 290:1721–1726. [DOI] [PubMed] [Google Scholar]
- 9.Simons, K., and D. Toomre. 2000. Lipid rafts and signal transduction. Nat. Rev. Mol. Cell Biol. 1:31–39. [DOI] [PubMed] [Google Scholar]
- 10.Simons, K., and W. L. C. Vaz. 2004. Model systems, lipid rafts, and cell membranes. Annu. Rev. Biophys. Biomol. Struct. 33:1–37. [DOI] [PubMed] [Google Scholar]
- 11.Lindblom, G., G. Oradd, and A. Filippov. 2004. Lipid lateral diffusion in ordered and disordered phases in raft mixtures. Biophys. J. 86:891–896. [DOI] [PMC free article] [PubMed] [Google Scholar]
- 12.Radhakrishnan, A., T. G. Anderson, and H. M. McConnell. 2000. Condensed complexes, rafts, and the chemical activity of cholesterol in membranes. Proc. Natl. Acad. Sci. USA. 97:12422–12427. [DOI] [PMC free article] [PubMed] [Google Scholar]
- 13.Veatch, S. L. I. V. Polozov, K. Gawrisch, and S. L. Keller. 2004. Liquid domains in vesicles investigated by NMR and fluorescence microscopy. Biophys. J. 86:2910–2922. [DOI] [PMC free article] [PubMed] [Google Scholar]
- 14.Webb, W. W., S. T. Hess, and T. Baumgart. 2003. Imaging coexisting fluid domains in biomembrane models coupling curvature with line tension. Nature. 425:821–824. [DOI] [PubMed] [Google Scholar]
- 15.Almeida, P. F. F., W. L. C. Vaz, and T. E. Thompson. 1992. Lateral diffusion in the liquid-phases of dimyristoylphosphatidylcholine cholesterol lipid bilayers: a free-volume analysis. Biochemistry. 31:6739–6747. [DOI] [PubMed] [Google Scholar]
- 16.Davis, J. H. 1983. Description of membrane lipid conformation, order and dynamics by 2H NMR. Biochim. Biophys. Acta. 737:117–171. [DOI] [PubMed] [Google Scholar]
- 17.Oldfield, E., M. Meadows, D. Rice, and R. Jacobs. 1978. Spectroscopic studies of specifically deuterium labeled membrane systems. nuclear magnetic resonance investigation of the effect of cholesterol in model systems. Biochemistry. 17:2727–2740. [DOI] [PubMed] [Google Scholar]
- 18.Sankaram, M. B., and T. E. Thompson. 1990. Modulation of phospholipid acyl chain order by cholesterol. A solid state 2H nuclear magnetic resonance study. Biochemistry. 29:10676–10684. [DOI] [PubMed] [Google Scholar]
- 19.Hui, S. W., and N. B. He. 1983. Molecular-organization in cholesterol-lecithin bilayers by x- ray and electron-diffraction measurements. Biochemistry. 22:1159–1164. [DOI] [PubMed] [Google Scholar]
- 20.McIntosh, T. J. 1978. The effect of cholesterol on the structure of phosphatidylcholine bilayers. Biochim. Biophys. Acta. 513:43–58. [DOI] [PubMed] [Google Scholar]
- 21.Needham, D., T. J. McIntosh, and E. Evans. 1988. Thermomechanical and transition properties of dimyristoylphosphatidylcholine cholesterol bilayers. Biochemistry. 27:4668–4673. [DOI] [PubMed] [Google Scholar]
- 22.McMullen, T. P. W., and R. N. McElhaney. 1995. New aspects of the interaction of cholesterol with dipalmitoylphosphatidylcholine bilayers as revealed by high-sensitivity differential scanning calorimetry. Biochim. Biophys. Acta. 1234:90–98. [DOI] [PubMed] [Google Scholar]
- 23.Vist, M. R., and J. H. Davis. 1990. Phase-equilibria of cholesterol dipalmitoylphosphatidylcholine mixtures: H-2 nuclear magnetic-resonance and differential scanning calorimetry. Biochemistry. 29:451–464. [DOI] [PubMed] [Google Scholar]
- 24.McMullen, T. P. W., R. Lewis, and R. N. McElhaney. 1994. Comparative differential scanning calorimetric and FTIR and 31P-NMR spectroscopic studies of the effects of cholesterol and androstenol on the thermotropic phase-behavior and organization of phosphatidylcholine bilayers. Biophys. J. 66:741–752. [DOI] [PMC free article] [PubMed] [Google Scholar]
- 25.Mendelsohn, R., J. W. Brauner, H. F. Schuster, and M. A. Davies. 1990. Effect of cholesterol on conformational disorder in dipalmoitylphosphatidylcholine bilayers. A quantitative IR study of the depth dependence. Biochemistry. 29:4368–4373. [DOI] [PubMed] [Google Scholar]
- 26.Endress, E., H. Heller, H. Casalta, M. F. Brown, and T. M. Bayerl. 2002. Anisotropic motion and molecular dynamics of cholesterol, lanosterol, and ergosterol in lecithin bilayers studied by quasi-elastic neutron scattering. Biochemistry. 41:13078–13086. [DOI] [PubMed] [Google Scholar]
- 27.Knoll, W., G. Schmidt, K. Ibel, and E. Sackmann. 1985. Small-angle neutron-scattering study of lateral phase- separation in dimyristoylphosphatidylcholine cholesterol mixed membranes. Biochemistry. 24:5240–5246. [DOI] [PubMed] [Google Scholar]
- 28.Leonard, A., C. Escrive, M. Laguerre, E. Pebay-Peyroula, W. Neri, T. Pott, J. Katsaras, and E. J. Dufourc. 2001. Location of cholesterol in DMPC membranes. A comparative study by neutron diffraction and molecular mechanics simulation. Langmuir. 17:2019–2030. [Google Scholar]
- 29.Presti, F. T., and S. I. Chan. 1982. Cholesterol phospholipid interaction in membranes. 1. Cholestane spin-label studies of phase behaviour of cholesterol-phospholipid liposomes. Biochemistry. 21:3821–3830. [DOI] [PubMed] [Google Scholar]
- 30.Reinl, H., T. Brumm, and T. M. Bayerl. 1992. Changes of the physical-properties of the liquid-ordered phase with temperature in binary-mixtures of DPPC with cholesterol: a H-2-NMR, FT-IR, DSC, and neutron-scattering study. Biophys. J. 61:1025–1035. [DOI] [PMC free article] [PubMed] [Google Scholar]
- 31.Gliss, C., O. Randel, H. Casalta, E. Sackmann, R. Zorn, and T. Bayerl. 1999. Anisotropic motion of cholesterol in oriented DPPC bilayers studied by quasielastic neutron scattering: the liquid-ordered phase. Biophys. J. 77:331–340. [DOI] [PMC free article] [PubMed] [Google Scholar]
- 32.Brown, M. F., and A. A. Nevzorov. 1999. 2H NMR in liquid crystals and membranes. Colloids Surf. A. 158:281–298. [Google Scholar]
- 33.Forbes, J., J. Bowers, X. Shan, L. Moran, E. Oldfield, and M. A. Moscarello. 1988. Some new developments in solid-state nuclear magnetic-resonance spectroscopic studies of lipids and biological-membranes, including the effects of cholesterol in model and natural systems. J. Chem. Soc. Faraday Trans. I. 84:3821–3849. [Google Scholar]
- 34.Forbes, J., C. Husted, and E. Oldfield. 1988. High-field, high-resolution proton magic-angle sample-spinning nuclear magnetic-resonance spectroscopic studies of gel and liquid-crystalline lipid bilayers and the effects of cholesterol. J. Am. Chem. Soc. 110:1059–1065. [Google Scholar]
- 35.Hamilton, J. A., and J. D. Guo. 1995. A multinuclear solid state NMR study of phospholipid cholesterol interactions. Dipalmitoylphosphatidylcholine cholesterol binary system. Biochemistry. 34:14174–14184. [DOI] [PubMed] [Google Scholar]
- 36.Boggs, J. M. 1987. Lipid intermolecular hydrogen-bonding: influence on structural organization and membrane-function. Biochim. Biophys. Acta. 906:353–404. [DOI] [PubMed] [Google Scholar]
- 37.Brzustowicz, M. R., W. Stillwell, and S. R. Wassall. 1999. Molecular organization of cholesterol in polyunsaturated phospholipid membranes: a solid state H-2 NMR investigation. FEBS Lett. 451:197–202. [DOI] [PubMed] [Google Scholar]
- 38.Brzustowicz, M. R., V. Cherezov, M. Caffrey, W. Stillwell, and S. R. Wassall. 2002. Molecular organization of cholesterol, in polyunsaturated membranes: microdomain formation. Biophys. J. 82:285–298. [DOI] [PMC free article] [PubMed] [Google Scholar]
- 39.Huang, T. H., C. W. B. Lee, S. K. Dasgupta, A. Blume, and R. G. Griffin. 1993. A C-13 and H-2 nuclear-magnetic-resonance study of phosphatidylcholine cholesterol interactions: characterization of liquid-gel phases. Biochemistry. 32:13277–13287. [DOI] [PubMed] [Google Scholar]
- 40.Hong, M., X. Yao, and D. Huster. 2002. Membrane protein topology probed by 1H spin diffusion from lipids using solid state NMR spectroscopy. J. Am. Chem. Soc. 124:874–883. [DOI] [PubMed] [Google Scholar]
- 41.Spiess, H. W., M. Wilhelm, and F. Mellinger. 1999. Calibration of 1H NMR spin diffusion coefficients for mobile polymers through transverse relaxation measurements. Macromolecules. 32:4686–4691. [Google Scholar]
- 42.Gawrisch, K., K. Arnold, and D. Huster. 1999. Investigation of lipid organisation in biological membranes by two-dimensional nuclear Overhauser enhancement spectroscopy. J. Phys. Chem. 103:243–251. [Google Scholar]
- 43.Gawrisch, K., and D. Huster. 1999. NOESY NMR crosspeaks between lipid headgroups and hydrocarbon chains: spin diffusion or molecular disorder? J. Am. Chem. Soc. 121:1992–1993. [Google Scholar]
- 44.Stark, R. E., and Z. Chen. 1996. Evaluating spin diffusion in MAS-NOSEY spectra of phospholipid multibilayers. Solid State Nucl. Magn. Reson. 7:239–246. [DOI] [PubMed] [Google Scholar]
Associated Data
This section collects any data citations, data availability statements, or supplementary materials included in this article.


