Abstract
In current practice, only one out of three components of the tissue displacement vector and one of nine components of the strain tensor are accurately estimated and imaged in ultrasound elastography. Since, only the axial component of both the displacement and strain are imaged, other important elastic parameters, such as shear strains and the Poisson’s ratio, also are not imaged. Moreover, reconstruction of the Young’s modulus would be significantly improved if all components of the strain tensor were available. In this paper, we describe a new method for estimating all the components of the tissue displacement vector following a quasi-static compression. The method uses displacements estimated from radiofrequency echo-signals along multiple ultrasound beam insonification directions. At each spatial location in the compressed medium, orthogonal tissue displacements in both the axial and lateral direction with respect to the direction of the applied compression are estimated by curve fitting angular displacement vector data calculated for all insonification directions. Following displacement estimation in orthogonal directions, components of the corresponding normal and shear strain tensors are estimated. Simulation and experimental results demonstrate the utility of this technique for the computation of the normal and shear strain tensors.
Index Terms: Angular strain, axial strain, displacement, elasticity, elasticity imaging, elastogram, elastography, imaging, lateral strain, least squares, linear model, Poisson’s ratio, shear, shear strain, strain
I. Introduction
IMAGING the elastic properties of tissue is a new area of research in ultrasound [1]–[8]. Tissue elasticity imaging methods based on ultrasound fall into three main groups: 1) methods, i.e., elastography, where a quasi-static uniaxial compression is applied to the tissue and the resulting components of the strain tensor are estimated [1]–[4]; 2) methods where a low-frequency vibration is applied with ultrasonic Doppler detection of velocities of reflectors perturbed by the vibrations [5], [6]; and 3) methods that use acoustic radiation force [9]–[13]. Reconstruction of the elastic moduli from the displacement or strain data obtained has been reported as well [4], [14].
In elastography, ultrasonic signals obtained from standard medical ultrasound diagnostic equipment before and after a uniaxial compression, typically about 1%, are analyzed. Local tissue displacements along the beam direction are measured using classical time delay estimation techniques [15]. Strains are then computed from the gradients of the tissue displacements. Thus, strains parallel to the insonification direction, which is typically along the compression force direction, are estimated. In the literature, these strains are referred to as axial strains because they are parallel to the ultrasound beam axis during data acquisition. (Note the notation for the axial direction will be modified later to simply be the direction that is parallel to the compression force direction.) Strains orthogonal to the axial strains, such as lateral strains (orthogonal to the axial strain but in the same image plane) and elevational strains (orthogonal to the axial strain and to the image plane) could also be estimated from these ultrasonic signals. However, the results are noisy and less accurate than axial strain results.
As mentioned above, a disadvantage of current elasticity imaging and elastography is that only the axial strain is estimated and used to produce the elastogram. However, all the components of the strain tensor are required to characterize the displacement following compression since tissue motion inevitably occurs in three dimensions [16]. Without those components, other elastic properties such as shear strains and the Poisson’s ratio cannot be estimated. In general, knowledge of the strain tensor and Poisson’s ratio is necessary for Young’s modulus reconstruction algorithms [4], [14]. In addition, the components of the strain tensor are coupled, and accurate estimations of all components are necessary for a complete visualization of the strain incurred in tissue.
Ultrasound-based strain imaging enhances the capability of this modality for diagnosis of disease and for monitoring response to therapy. For example, some tumors of the breast, liver, and prostate are detected by manual palpation through the overlying tissue. Young’s modulus (or stiffness) is perhaps the most fundamental parameter of interest since it depends upon tissue composition [17] and can be directly computed from strain measurements under certain assumptions [1]. The Poisson’s ratio, i.e., the ratio between the lateral expansion and the axial compression under uniaxial stress conditions, may also allow for differentiation between normal and abnormal tissues. For poroelastic materials, the Poisson’s ratio depends on the duration of the compression because of unbound liquids continuously leaving the material under compression. Imaging the Poisson’s ratio of these materials over time may be useful for quantitative assessment and imaging of fluid transport in local regions of edema, inflammation, or other hydrated poroelastic tissues [18].
Previous research in the estimation of components of tissue displacement vectors using ultrasound and in measuring blood flow velocity in two and three dimensions has been reported in the literature [19]–[23]. Bonnefous [20] used multiple crossing beams and time correlation techniques to estimate displacements in transverse directions to detect three-dimensional (3-D) motion. Morsy and Von Ramm [21] presented a method based on combining feature tracking and 3-D correlation searching for tracking tissue motion and blood flow in 3-D using successive volumetric ultrasound scans. Speckle tracking using a sum-absolute-difference (SAD) algorithm that uses two-dimensional (2-D) kernels between successive ultrasound frames has also been used to track tissue motion and to produce a vector map of 2-D velocities [24]. Multiple parallel receive beams with 2-D pattern matching have also been used by Bohs et al. [22], and two receive beams at different angles, along with one-dimensional (1-D) speckle tracking have been used by Tanter et al. [19] to obtain 2-D motion.
Lateral displacements for strain imaging have also been obtained utilizing assumptions of tissue incompressibility [25]. In that work, lateral displacements were computed using the higher precision axial displacement estimates and assuming a Poisson’s ratio of 0.5. However, the incompressibility assumption may not hold in some tissues, for example lung tissue with a Poisson’s ratio of 0.3 [17], and cartilage with a Poisson’s ratio of 0.17 [26]. In addition, the Poisson’s ratio may not be constant, such as for poroelastic tissue when edema is present [18].
Konofagou and Ophir [27] proposed the simultaneous estimation of both axial and lateral displacements and strains using a precision tracking algorithm based on weighted interpolation between neighboring RF A-lines in the lateral direction, along with an iterative correction of lateral and axial displacements. They applied a number of recorrelation and correction stages for axial and lateral displacements. Unlike 2-D kernel techniques [24], this algorithm was able to obtain displacement estimates in the lateral direction by tracking the RF pattern of a single A-line segment in the lateral direction. However, the extensive lateral interpolation between RF A-lines and the iterative nature of the algorithm increase its computational complexity.
In this paper, we describe a novel method for estimating components of a displacement vector following tissue compression. The method collects RF echo signal data along multiple angular insonification directions of the ultrasound beam. Different methods can be utilized to acquire the angular ultrasound RF echo signal data. For example, the most efficient approach for clinical data acquisition would be to utilize a linear or curvilinear array transducer with beam steering [28], as is done with compound imaging. In the present study we utilize a phased array transducer that is mechanically translated in the lateral direction such that a given region in the tissue is interrogated from multiple beam directions. Tissue displacements at each spatial location in the compressed medium are measured in each beam direction using classical time-delay estimation techniques. A linear model of the relationship between these directional displacements and the components of the actual displacement vector is constructed. The components of the displacement vector are then estimated using a least squares solution, where the squared errors between the observed displacements and the displacements computed from the linear model are minimized with respect to the displacement components in the model. Then the components of the strain tensor are estimated using least squares strain estimators [29] from the displacement components. The Poisson’s ratio is approximated from the ratio of the lateral strain to the axial strain.
In this paper we apply our method of estimating displacement vectors and strain tensors to simulated pre and post-compression RF echo signals calculated from an ultrasound simulation program that incorporates 3-D beams. The simulation combines elastic deformation equations with a linear ultrasound image model, calculating echo signals for point-like scatterers in the medium before and after compression. Experimental results are then presented for a thermal lesion encased in a gelatin block.
II. Theory
We assume that the sample volume to be studied is subjected to a compressive force as it is being imaged with an ultrasound transducer. The component directions of the displacement vector are defined as follows. The z-axis is taken as the direction of the compression force (see Fig. 1). This is generally from top to bottom of the sample as illustrated in the diagram. The lateral direction or the x-axis is defined as the direction orthogonal to the axial direction and located in the image plane. It is usually from left to right in our diagrams. The elevational direction or the y-axis is defined as the direction orthogonal to the image plane, which is usually from back to front. Note that the transducer displayed in Fig. 1 is a linear array transducer with the beam steering feature. However, we have followed different approaches for the acquisition of RF echo signal data for the simulation and experimental validation in this paper. We will discuss the data acquisition method in more detail in the latter sections that describe the simulation and experiment, respectively.
Fig. 1.
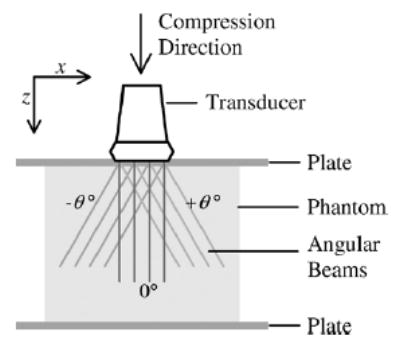
A diagram for elastographic imaging using a linear array transducer with beam steering. This image shows superposition of three RF frames with different steering angles, −θ, 0, and +θ° Generally, the beam could be steered in many angular steps. The figure defines the z and x directions which are, respectively, the axial and lateral direction of the ultrasound beam without steering.
Suppose that an actual displacement vector at point O in space is observed using a 1-D linear transducer with the beam steering feature (see Fig. 2). Let uθ be an A-line in an RF frame with a beam angle θ that passes through point O, and pθ be the projection of the displacement vector onto a unit vector in the θ direction. Then the projection pθ is the dot product between and , which is
Fig. 2.
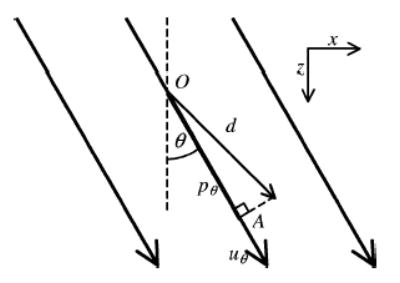
An actual displacement vector d at point O, observed by an ultrasound beam uθ in an RF frame with beam steering angle θ The product of the displacement vector d and the unit vector in the θ direction is designated by the line OA, which is equal to dz cos θ + dx sin θ, where dz and dx are the component of the displacement vector d in the z and x directions, respectively.
| (1) |
where dz and dx are the components of displacement vector in the z and x directions, respectively, while cos θ and sin θ are the components of the unit vector in the z and x directions, respectively. Let qθ be an observation of the displacement vector using uθ. This observed displacement could be written as
| (2) |
where nθ is the noise in the observation. In this paper, qθ denotes the displacement estimate obtained using cross-correlation between the overlapped windows of the precompression and postcompression RF echo signals along the θ insonification direction. We have previously demonstrated that displacement errors or the displacement noise artifacts follow a zero-mean normal distribution [30]. Thus, these errors in displacement estimates are modeled using a randomly distributed additive noise. However, the least squares approach utilized in this paper does not requires a statistical descriptions of the parameters dz and dx, or the noise nθ [31].
We assume that the tissue displacement is measured using multiple beams at different beam angles passing through point O. Each beam line produces one observation. Let uθi be an A-line at beam angle θi passing through point O for i = 1, …, m where m is the total number of insonification angles. Let uθi be the noise in the observation at angle θi. Using (2) for each angle and rewriting these equations into a matrix form, we have
| (3) |
where
and
| (4) |
We can minimize the squared error between the measurement and the linear model with respect to to estimate the value of . This solution is the least squares solution [31], which is
| (5) |
The solution exists and is unique since the columns of A are linearly independent [31], where the matrix AT A is called Grammian or Gram matrix. For example, consider when a point is sampled using 91 RF beam lines, separated by 1° increments between −45° and 45°. Fig. 3 presents plots of the projections pθ versus angle θ for different displacement vectors , whose dz components are constant at 0.2 mm but dx components vary from −0.2 to 0.2 mm. This demonstrates that different values of the displacement vector produce different curves. Note that the projection pθ is maximum when pθ is in the same direction as the displacement vector .
Fig. 3.
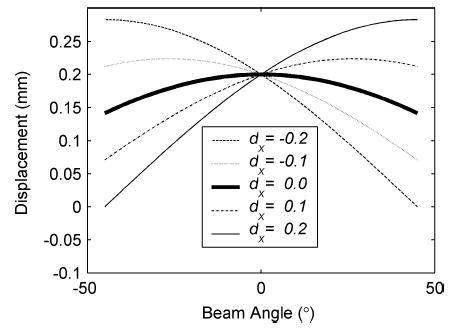
Plots of projections of the actual displacement vector onto a unit vector in the θ direction for an axial displacement of dz = 0.2 mm and different values of the lateral displacement dx in millimeters.
These equations are applied for the actual displacement vector in two-dimensions. In practice, the tissue displacement occurs in three dimensions. For this case, a 2-D array with beam steering in both lateral and elevational directions would be needed to track the motion. The modified version of these equations for the 3-D case is in the Appendix.
III. Displacement Estimation
The algorithm developed in this paper will be demonstrated for the general case of estimating the displacement vector. Estimation of displacements accurately has applications in ultrasound Doppler imaging and elasticity imaging.
A. Algorithm
The displacement estimation algorithm can be described in three steps.
At each location in the tissue, pulse-echo RF data are acquired for a number of independent beam angles, before and after a compressive force is applied or some other source of tissue translation occurs.
Components of the displacement vectors are estimated along each beam direction from the pretranslated and posttranslated RF echo signal frames.
Orthogonal displacement components are then estimated from the angular displacement data.
B. Simulation Tests of the Method
Ultrasound RF echo signals at different insonification angles before and after phantom deformation were obtained using an ultrasound simulation program developed by Li and Zagzebski [32]. The conditions simulated for the acquisition of RF signals at different angles is shown in Fig. 4. Note that the phantom is not deformed but translated in this case. For computational ease, the model assumed that transducer was rotated around the center of the phantom (3.5-cm width × 4-cm height) at 1° angular increments, from −45° to 45°, instead of applying beam steering. A linear array transducer was modeled, which was assumed to consist of 0.15 × 10 mm elements with a 0.2-mm center-to-center element separation. Each beam line was formed using 128 consecutive elements. The incident pulses were modeled to be Gaussian shaped with a 5-MHz center frequency and a 50% bandwidth measured at the full-width at half-maximum (FWHM). The sound speed in the phantoms was taken as 1540 m/s, and attenuation was assumed to be negligible. The scatterers were modeled as 50-μm radius polystyrene beads with an average concentration of 9.7/mm3 and were randomly distributed in the phantom.
Fig. 4.
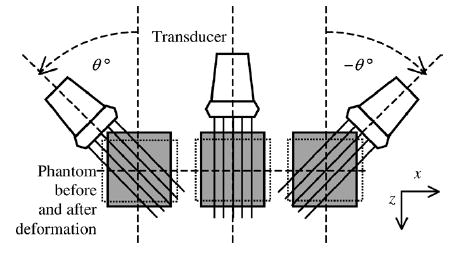
Simulation model for strain tensor estimation. A linear transducer rotates for every 1° around the center of the phantom, from −45° to 45°. RF signals are generated for each location of the transducer before and after phantom deformation.
After calculating RF signals for each of the angular views in Fig. 4, the phantom was assumed to be translated by a specific displacement, resulting in the same movement/motion for each scatterer, and echo signals were again computed for the angular views. The motion of the scatterers was then tracked using our algorithm. Two displacement cases were simulated. The first considered only an axial displacement, where angular RF echo signals were acquired before and after the phantom was displaced 0.225 mm along the z direction. In the second simulation, both axial and lateral displacements were simulated, i.e., a displacement of 0.2 mm along the z direction and −0.1 mm along the x direction.
C. Simulation Results
Displacements at the center of the translated phantom observed from simulated ultrasound signals at different insonification angles are plotted in Fig. 5(a). The theoretical curve of the projection of the known actual displacement vector (dz = 0.225 mm and dx = 0) to the unit vector parallel to the beam angle obtained using (1) is shown as the solid line. The displacements estimated from simulated data correspond to the solid circles and follow the variation of the theoretical curve. The least squares solution [dashed line, computed using (5)] is also plotted in Fig. 5(a); the solution resulted in a displacement vector with 0.2229 mm and −4.0109 × 10⁻⁴ mm components in the z and x directions, respectively. The means of displacements in the z and x directions computed over a region of interest consisting of 1,000 points around the center of the uniform phantom are shown in Table I. Note that the values obtained are in excellent agreement with those applied in the model, 0.225 mm axially and 0 mm laterally.
Fig. 5.
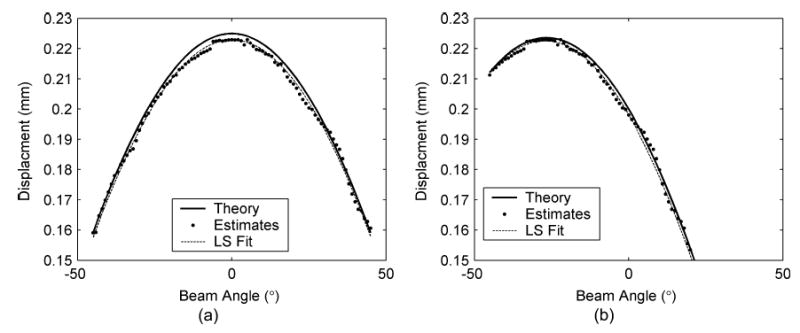
Plot of the measured displacement at the center of the uniform phantom under two different translation conditions. The case shown in (a) includes only axial displacement with the phantom displaced by 0.225 mm, while (b) includes both axial and lateral displacements of 0.2 mm in the axial direction and −0.1 mm in the lateral direction, respectively. The measured displacements (dots) are plotted versus the different insonification angles. The theoretical prediction of the displacement vector is plotted as the solid line, and the least squares fit of the measured data points is shown as the dotted line. The estimated displacements in (a) and (b) corresponding to the least squares solution are (0.2229, −4.0109 × 10⁻⁴) and (0.1981, −0.1015), respectively. Note that these estimates are very close to the values of the axial and lateral displacement utilized in the simulation.
TABLE I.
Results Obtained Using the Simulation to Obtain Estimates of the Displacement Vector Using the Algorithm. The Mean* and Standard Deviation* of the Estimated Displacements Were Obtained Around the Center of the Uniform Phantom
|
Displacement (mm) |
||||
|---|---|---|---|---|
| Simulated Case I (Fig. 5 (a)) | Simulated Case II (Fig. 5(b)) | |||
| Displacement Direction | z | x | z | x |
| Simulated Displacement | 0.225 | 0 | 0.20 | −0.10 |
| Estimated Displacement | 0.2229 | −4.0109××10−4 | 0.1981 | −0.1015 |
| Mean Displacement* | 0.2235 | 1.0080×10⁻⁷ | 0.1990 | −0.1016 |
| Displacement Standard Deviation* | 4.5231×10⁻⁴ | 7.5487×10⁻⁴ | 4.7738×10⁻⁴ | 8.8180×10⁻⁴ |
Fig. 5(b) presents results for the case of dz = 0.2 mm and dx = −0.1 mm. Theoretical plots of the displacement vector are shown, along with the displacements estimated from the simulated data sets. Just as in Fig. 5(a), the displacement estimates follow the theoretical curve for the more complex translation. The least squares solution [dashed line, computed using (5)] is also plotted in Fig. 5(b). The mean and standard deviation of the displacements computed are shown in Table I. Again the values obtained are in excellent agreement with those applied in the model, i.e., 0.2 mm in the axial direction and 0.1 mm in the lateral direction.
The results in Fig. 5 demonstrate the ability of the algorithm to estimate the displacement vector in two orthogonal directions. The orthogonal displacement vectors were obtained from displacement estimates computed along angular insonification directions.
IV. Strain Tensor Estimation
A. Algorithm
After acquiring displacement data in the manner shown above, strain tensor elements can be estimated. The normal and shear strain tensor estimation algorithm applied in this paper is summarized as follows:
At each location in the tissue, pulse-echo RF data are acquired for a number of independent beam angles, before and after a unidirectional applied compression or deformation.
Components of displacement vectors along each transducer direction are estimated from the precompression and postcompression RF echo signal frames, as shown in the previous section.
Linear interpolation is applied for image registration or scan conversion of the angular displacement data computed in Step 2), to a Cartesian spatial grid.
Axial and lateral displacement images are computed from the angular displacement data.
Normal and shear strain tensor elastograms are computed and displayed.
The algorithm does not involve interpolation of RF beam lines, nor does it involve an iterative process to obtain the resultant elastograms. However, a large number of angular RF data sets are acquired, with the subsequently large processing overhead.
B. Simulation Tests
The ultrasound simulation model was adapted for acquisition of RF signals at different angles before and after an applied compression, again as shown in Fig. 4. The modeled phantom contained an 8-mm-diameter cylindrical inclusion that was four times stiffer than the surrounding. The Poisson’s ratio of both background and inclusion was set to 0.495. The phantom was deformed by a 0.5% uniaxial compression in the z direction, with the center point of the phantom fixed. The displacement of each scatterer in the phantom was calculated using an analytical solution of the elasticity equations derived for a medium subjected to a uniaxial compression, assuming plane-strain conditions [33]. This results in no strain in the y direction. The new scatterer positions were used when calculating the post compression echo signals at each acquisition angle.
The strain tensor estimation algorithm applied to the pre and post compression angular RF data sets can be described in four stages. In the first stage, displacements observed along different transducer insonification angles, or “angular displacement images” are computed. We applied the normalized cross-correlation algorithm [1] using a 3-mm window size and 75% overlap between consecutive windows when computing angular displacements. In the second stage, linear interpolation is used for image registration of all angular displacement images. Fig. 6 illustrates examples of angular displacement images of the uniform phantom at −23° and 23° angles with respect to the direction of compression. It also shows the corresponding displacement images after image registration. Note that the boundaries of the phantom in the angular displacement images rotate to match each other.
Fig. 6.
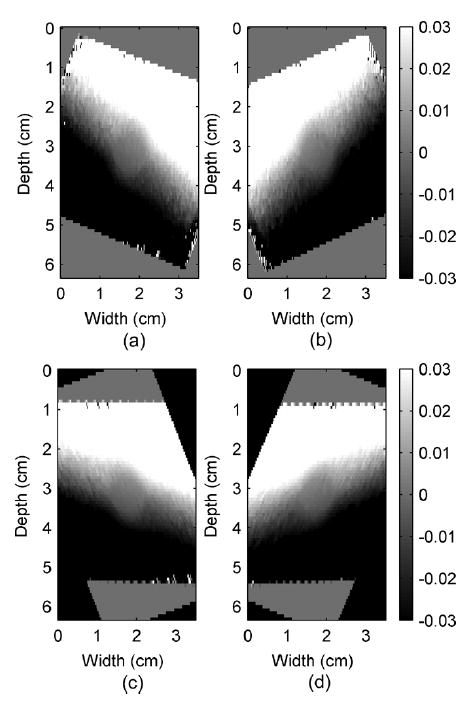
Observed displacement images (a) and (b) before and (c) and (d) after image registrations of a simulated cylindrical inclusion phantom under 0.5% uniaxial compression in the z direction (top to bottom of the phantom) measured at −23°and 23° beam angles in (a) and (b), respectively. Note that the width and height are in centimeters, while the displacement color bars are in millimeters.
The tissue displacement estimation at a point requires observations from different beam angles. Since the displacement images at different angles have different pixel-grid systems, pixels from different angular images may not be located at the same spatial location. By assuming that the angular displacement images are smooth, linear interpolation can be applied to estimate the observations at the pixels on the zero-angle grid, for which the row and column pixels are parallel to the z and x directions. This step enables estimation of the tissue displacement for every pixel on the zero-angle grid. For our setup, the pixel size was 0.75 mm in height and 0.20 mm in width. These numbers come from the use of the 75% overlap of the 3-mm window applied in displacement estimations and from the separation between successive beam lines.
The third stage represents the estimation of the displacement vector (obtained after compression) at each pixel on the zero-angle grid using a least squares approach. This stage is illustrated using Fig. 7 for angular displacement vectors estimated after the quasi-static compression of the inclusion phantom. Fig. 7 shows plots of phantom displacement estimates at a 1-cm depth of the center A-line versus insonification angle similar to that shown in Fig. 5. The number of observations available in the least squares may not be equal to the total number of angled RF frames. The actual number depends on the location of that pixel. For example, as Fig. 4 shows, the region corresponding to a pixel at the center of the phantom would be insonified with ultrasound beams from every angle. Therefore, in our simulation a complete set of 91 measurement data was available at this point. In contrast, ultrasound beams from larger angles of the transducer cannot reach areas near the corners of the phantom, so pixel data for these locations are generated using a smaller number of observations. The final images of the displacements in both the z and x directions for the simulated inclusion phantom are shown in Fig. 8.
Fig. 7.
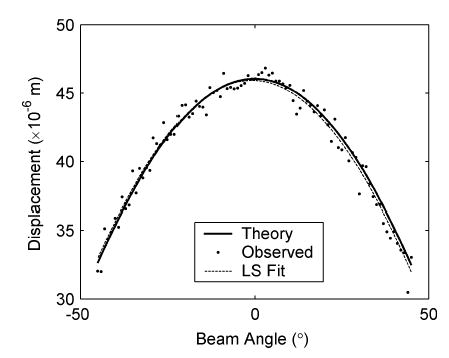
Plot of displacement at a 1-cm depth for the center A-line of the inclusion phantom versus insonification beam angle. Shown are projections of the actual displacement vector onto the unit vector, calculated using dθ = 0.0460 cosθ (solid line); the displacement observed using different insonification angles (dots), and the projection of the displacement vector estimated using the least squares fit:dθ(fit) = 0.0459 cosθ − 7 × 10⁻⁴ sinθ (dotted line). Note that the actual displacement is 0.0460 and 0 mm in the z and x directions, respectively, while the corresponding estimated displacements are 0.0459 mm (z) and −7 × 10⁻⁴ mm (x).
Fig. 8.
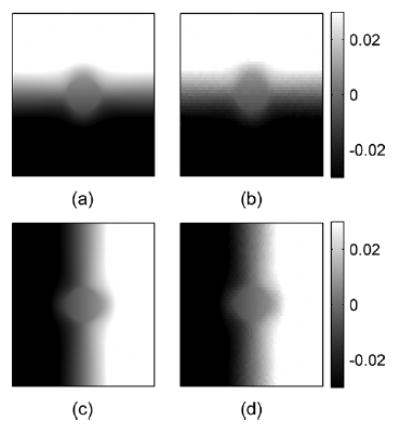
Ideal (a) and estimated (b) axial displacement images and ideal (c) and estimated (d) lateral displacement images for the inclusion phantom simulations. Images were obtained by simulating signals for 91 angular insonifications (−45° to 45° ). The depth and width of these images are 4 and 3.5 cm, respectively. The axial direction or the z direction is from top to bottom and the lateral direction or the x direction is from left to right.
Finally, elements of the strain tensor, in this case normal strains in the z and x directions and shear strains, are obtained from the displacements in the z and x directions. Note that the z and x directions also refer to the axial and lateral directions for ultrasound beams forming the zero angle frame. The normal strains are defined by
| (6) |
where ezz and exx are the strains in z and x directions, respectively, and the shear strain is defined by
| (7) |
In the example illustrated here, the partial derivatives in (6) and (7) were approximated using a least squares strain estimator (LSQSE) [29]. Outliers on the elastograms were suppressed using a 5 × 5 median filter.
C. Results
The images of displacements in the z and x directions obtained from the least squares solutions are shown in Fig. 8. Note that the displacements have signs corresponding to their axes. It shows that as the phantom is compressed in the z direction it expands in the x direction. These results satisfy the imposed simulation condition of the phantom compression. The displacement patterns due to the stiffer cylindrical inclusion are clearly observed at the center of the displacement image. These displacement images are very smooth, which implies that the strain images generated from their gradients should be smooth and have a high SNR.
Fig. 9 presents both the ideal and estimated images of strains in the z and x directions. The ideal axial and lateral strain images in Fig. 9(a) and (c) were calculated using analytical solutions of a plane elasticity problem [33]. The axial and lateral strain images in Fig. 9(b) and (d) were estimated using least squares strain estimators (LSQSE) [29] applied to the simulated data. The shapes of the inclusion and the values of the axial and lateral strains on the simulated data match the ideal images quite well. Plots of the strain profiles across the center of the inclusion along the vertical and horizontal directions of the strain images are shown in Figs. 10 and 11, respectively. These plots show that the estimated values of strains in both directions are close to the ideal values. The profiles for strain in the x direction (lateral strain) are noisier than the profiles in the z direction (axial strain). The estimated height is close to the ideal value, but the estimated width is slightly smaller than the ideal value. These results confirm that the displacement estimates are accurate, and the images exhibit sufficient continuity for generating high-quality strain images.
Fig. 9.
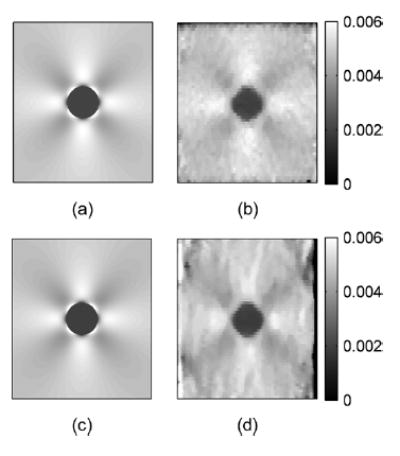
Ideal and estimated axial strain images in (a) and (b), respectively, and ideal and estimated lateral strain images in (c) and (d), respectively.
Fig. 10.
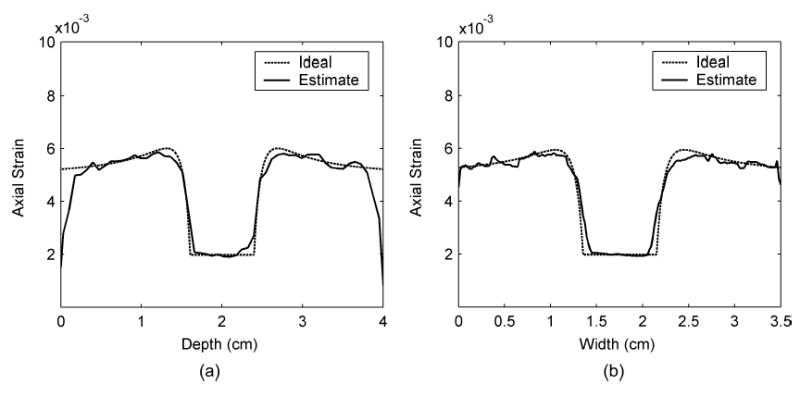
Axial strain profiles across the center of the inclusion comparing between ideal and estimated values along (a) the vertical and (b) the horizontal directions.
Fig. 11.
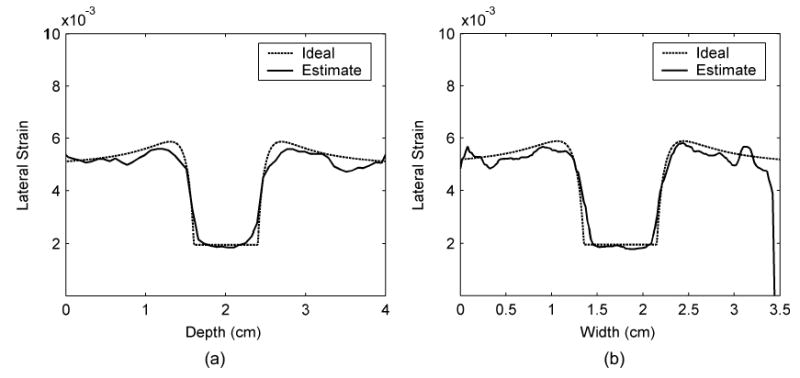
Lateral strain profiles across the center of the inclusion comparing between ideal and estimated values along (a) the vertical and (b) the horizontal directions.
The images of the partial derivatives obtained using (7) and the corresponding shear strains are shown in Fig. 12. Fig. 12 provides a comparison between the ideal shear strain images and their estimated pairs generated from the simulated data. Observe that the images in each pair are almost identical, except for the increased noise in regions around the edges of the simulated images and around the inclusion. Note the presence of stress concentrations around the inclusion for different shears. These stress concentrations are clearly observed and are identical in the ideal and the estimated shear strain elastograms.
Fig. 12.
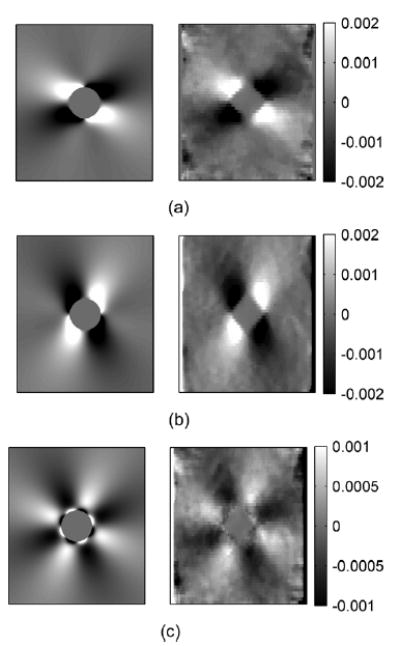
Pairs of the ideal (left) and estimated (right) images of (a) ∂dz/∂x, (b) ∂dx/∂z, and (c) shear strain = 0.5(∂dz/∂x + ∂dx/∂z), where dz and dx are the displacements in the z (axial) and x (lateral) directions, respectively.
Poisson’s ratio images were approximated using point-by-point division of the negative strains in the x direction by the strains in the z direction, as described by other researchers [27]. However, this method provides a good approximation only if the voxel or small volume element used to calculate the local strain experiences uniaxial stress. Note that uniaxial stress means that the stress, or compression force per unit area normal to the force direction, only occurs on one axis. For a uniform elastic medium compressed by a large plate in one direction, each voxel experiences almost uniaxial stress. Conversely, for a nonuniform elastic medium, i.e., a material containing an inclusion, under the same compression conditions, each voxel will not experience true uniaxial stress, especially for voxels near the inclusion. Also, in the plane-strain state, the uniaxial stress condition is never satisfied because stress directed in and out of the image plane always exists. However, under the plane-strain state, any material that has a Poisson’s ratio of 0.5 will have ex = −ey. This means that if we attempt to calculate the Poisson’s ratio by dividing the negative axial strain by the lateral strain as in [27], we would get a “Poisson’s ratio” value of 1.
A Poisson’s ratio image of the simulated phantom using axial and lateral strain, and the ideal Poisson’s ratio image are shown in Fig. 13. The ideal image in Fig. 13(a) is uniform with value 1. The values of the estimated Poisson’s ratio image shown in Fig. 13(b) are almost constant, except for the area around the inclusion boundary and around the edges of the image. This could result from displacement estimates that used the windowed signal across the discontinuity region of the material. The means of the Poisson’s ratios calculated from the boxes inside and outside the inclusion, shown in Fig. 13(b), are 0.9578 and 0.9587, respectively. The standard deviations are 0.0411 and 0.0350, respectively.
Fig. 13.
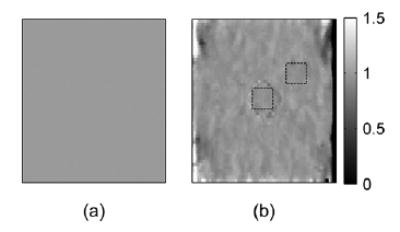
(a) Ideal Poisson’s ratio image (uniform value of 1) and (b) estimated Poisson’s ratio image with ROI’s (square boxes) for calculating the means and standard deviations of the Poisson’s ratio inside and outside the inclusion, respectively. The means inside and outside are 0.9578 and 0.9587, respectively. The standard deviations inside and outside are 0.0411 and 0.0294, respectively.
V. Experimental Results on Thermal Lesion Samples
A. Method
Thermal lesions around 2-cm diameter were created in fresh canine liver samples with dimensions of 40 mm × 40 mm and 20-mm thickness by ablating the tissue with a 450-kHz generator and a deployed RF electrode for 5 min at 50 W power. Liver with a thermal lesion was encased in gelatin cubes with dimensions of 80 mm for elastographic imaging. Echo data were obtained using an Aloka SSD 2000 (Aloka Inc., Tokyo, Japan) real-time scanner and a 3.5-MHz phased array transducer. The signal format of the Aloka SSD 2000 phased array transducer consists of 121 A-lines arranged over a 90° sector, with 0.75° increments between A-lines. The ultrasound RF signals were digitized using a 12-bit data acquisition board (Gage Applied Technologies Inc., Lachine, QC, Canada) at a sampling rate of 50 MHz. Data were stored in a personal computer for off-line analysis. To simulate the effects of angular data acquisition of RF echo signals, the phased array transducer was linearly translated over the sample using a precision linear stage, so that each location in the sample was scanned from multiple angles (Fig. 14). The distance between acquisitions was 0.5 mm, and the total distance traversed was 40 mm, mimicking the echo data that could be recorded using compound acquisition with a modern linear array. At each location data were acquired before and after a unidirectional 0.1% compression. The echo data in these RF sets were then rearranged so that the A-lines at the same angle were grouped together to form an angled RF data frame, as illustrated in Fig. 14. Each of these regrouped RF frames was analyzed separately to generate “displacement images” at each angle. Elastograms were obtained using a window length of 3 mm and 75% overlap between data segments.
Fig. 14.
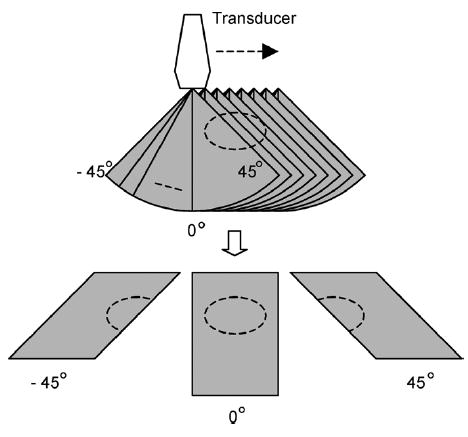
RF data sets in sector format (top) acquired at each lateral position. These scans were rearranged into a linear format (bottom) by grouping A-lines at the same angle.
B. Results
Axial and lateral displacement images generated from the angular displacement images are shown in Fig. 15. Observe that the displacement images are very smooth with the lesion outline visible in both images. The elastograms obtained from the displacement estimates are shown in Fig. 16. The thermal lesion is clearly depicted in the axial strain elastogram in Fig. 16(a), while the lateral strain elastogram in Fig. 16(b) has lower strain values due to the axial direction of the applied compression. However, the outline of the thermal lesions can still be clearly seen. The shear strains depicted in Fig. 16(c) are also small due to the 0.1% compression. The results demonstrate feasibility of utilizing angular displacements to compute normal and shear strains tensors using experimental data. A Poisson’s ratio image for this experiment was not calculated since the thermal lesion phantom may not be under a plane-strain state as described in the previous section.
Fig. 15.
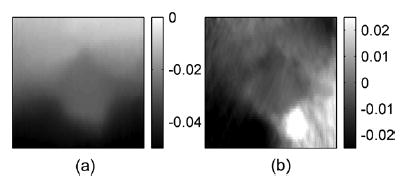
Experimental axial and lateral displacement images for an in-vitro thermal lesion.
Fig. 16.
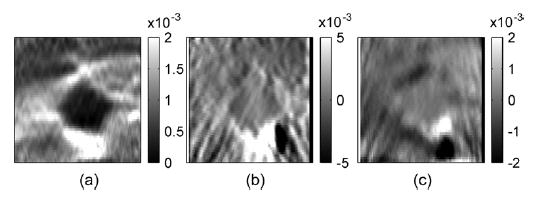
Corresponding (a) axial, (b) lateral and (c) shear strain elastograms.
VI. Discussion and Conclusion
In this paper, we describe a method to estimate the lateral and axial components of displacement vectors throughout a medium subjected to a unidirectional compression. The method uses multiple insonification beam angles. Such acquisitions can be obtained by modern array transducers that apply angular beam steering for spatial compounding. Local angular displacements observed for different angles of ultrasound beams are estimated from the RF echo signals using a 1-D cross-correlation method. Observed displacements for different beam angles are then fit to a linear model, yielding the components of the displacement in the x and y directions. As shown in Fig. 7, displacements observed at different beam angles follow the theoretical values from the model closely. The fitted curve is almost indistinguishable from the theoretical curve. The estimated components of the displacement are also very close to the predefined values.
The results in this paper demonstrate the unique relationship that exists between the angular displacement information and the constituent displacements in the z and x directions. This relationship is utilized to obtain accurate estimates of the displacement vectors over the entire region of tissue imaged. These angular displacement signatures would vary with the applied compression, Young’s modulus of the tissue imaged, and the corresponding pixel position in the elastogram. Accurate and precise estimations of the displacement vectors enable the generation of both normal and shear strain elastograms, which are shown in this paper. In addition, Poisson’s ratio images could also be generated.
The high-precision estimation of the displacements and strains in the lateral direction provides additional information regarding the mechanical conditions that exist during an elastography experiment. For example, the presence of slip or nonslip conditions [34], [35] is revealed, the location of the compressor relative to the axis of symmetry of the target can be indicated, and the uniformity of the applied compression is brought out. In addition, generation of lateral strain elastograms allows computation of Poisson’s ratio images, which may provide an ability to differentiate between materials with different Poisson’s ratios or with inclusions having Poisson’s ratio contrast. These differentiations may have a significant impact in the characterization of normal and abnormal tissues.
Other valuable strain tensor components that can be derived from knowledge of the components of the displacement vectors in the z, x, and y directions (or axial, lateral, and elevational displacements) are shear strains. Shear strain elastograms demonstrate, for example, any tumor slip [34], [35] that may occur during compression. This parameter may have useful implications in the differentiation of fibroadenomas from cancerous tumors. Since cancerous tumors infiltrate into surrounding normal tissue and include calcifications and spiculations, they appear to be far less mobile and not slip during compression as do fibroadenomas [35]. In addition sliding of thyroid nodules was noted 61% of the time (22/36) at the nodule/gland interface of benign thyroid nodules, while seven malignant nodules demonstrated no sliding artifact [34]. In this case, a lack of sliding was probably due to an adhesive effect at the margin of cancerous lesions that was lacking in benign lesions. These results demonstrate the potential utility of using shear strain elastograms to clearly characterize this condition.
The algorithm used in this paper does not utilize the incompressibility assumption proposed by Lubinski et al. [25]. In addition, we do not utilize the extensive interpolation and recorrelation required for the algorithm proposed by Konofagou and Ophir [27], which would increase the computational complexity. However, the algorithm provides higher precision in the displacement and strain information than that is reported by Konofagou and Ophir [27]. The primary tradeoff involves the collection of multiple angular RF data sets using our approach, while the Konofagou and Ophir [27] method uses a single pair of precompression and postcompression echo signal frames. The lateral resolution of displacement estimates obtained using our technique is also not dependent on the ultrasound pitch of the transducer. Since we use multiple insonification angles, the angular displacements estimated have the same spatial resolution as displacements obtained along the axial direction. The resolution depends mostly on the window length and the overlap [36]. However, a detailed evaluation of the spatial resolution for our technique is beyond the scope of this paper.
The technique introduced in this paper is proven to be successful with simulated RF echo signals. Implementation of the technique on a clinical ultrasound system would require the use of beam steering on linear array transducers to obtain RF echo signal frames at different insonification angles. Many clinical equipment manufacturers have already implemented beam steering along angular directions for compounding B-mode images to reduce speckle noise artifacts. Our future work is to apply this technique on a clinical transducer that provides RF signal frames at different insonification angles. More work is required to select the appropriate angular increments and the maximum insonification angles for optimal performance in strain tensor imaging.
Since the compression used in elastography causes 3-D displacements, 3-D strain tensor imaging is necessary. The normal and shear components of the strain tensor estimation algorithm proposed in this paper can be easily extended to the 3-D case to estimate elevational displacements and strains. For this case, 3-D data sets, where the transducer beams are steered along both lateral and elevational directions, which could be obtained using 1.75 D or 2-D array transducers, can be incorporated into the algorithm.
Appendix
Consider a 2-D linear array with beam steering features that can steer beams in both x and y directions, as shown in Fig. 17. The ultrasound beam uθ,ϕ is steered in the xz-plane with angle θ and in the yz-plane with angle φ. The unit vector in the uθ,ϕ direction can be decomposed into components in the z, x, and y directions as follows. First, decompose into two orthogonal components on the ANO plane. The component parallel to the AN direction is cos θ, and the component parallel to x-axis is sin θ. Then, decompose the cos θ component further into two orthogonal components on the ANP plane. We thus have cos θ cos ϕ parallel to the z-axis and cos θ sin ϕ parallel to the y-axis. Therefore, the projection of a displacement vector at point O as in (1) can be rewritten to be
Fig. 17.
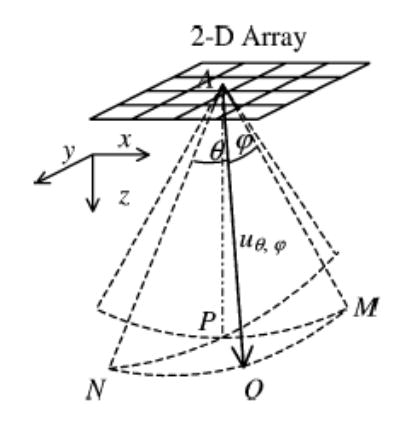
The coordinate system of an ultrasound beam uθ, ϕ generated by 2-D linear array with beam steering angle θ in the xz-plane, which is equal to angle NAO and PAM, and beam steering angle ϕ in the yz-plane, which is equal to MAO and PAN.
| (8) |
where dz, dx, and dy are the components of the vector . The observed displacement in (2) can be updated to be
| (9) |
where nθ,ϕ is the noise in the estimation along the θ and ϕ angles. Suppose there are m × n beams passing through point O with θi and ϕj steering angles in the xz-plane and the yz-plane, respectively, for i = 1, …, m and j = 1, …, n. We can rewrite the observed displacements for different beam angles in a matrix form as in (3). Now the matrix and vectors in the equation are
| (10) |
Footnotes
This work was supported in part by the Wisconsin Alumni Research Foundation (WARF) and in part by the National Institutes of Health (NIH) under Grant R21 EB003853 and Grant 1R21EB002722. The work of T. Varghese was supported in part by start-up grant funds from the University of Wisconsin-Madison. The Associate Editor responsible for coordinating the review of this paper and recommending its publication was M. Insana.
References
- 1.Ophir J, Cespedes I, Ponnekanti H, Yazdi Y, Li X. “Elastography: A quantitative method for imaging the elasticity of biological tissues,”. Ultrason Imag. 1991;13(2):111–134. doi: 10.1177/016173469101300201. [DOI] [PubMed] [Google Scholar]
- 2.Varghese T, Ophir J, Konofagou EE, Kallel F, Righetti R. “Tradeoffs in elastographic imaging,”. Ultrason Imag. 2001;23(4):216–248. doi: 10.1177/016173460102300402. [DOI] [PubMed] [Google Scholar]
- 3.Garra BS, Cespedes EI, Ophir J, Spratt SR, Zuurbier RA, Magnant CM, Pennanen MF. “Elastography of breast lesions: Initial clinical results,”. Radiology. 1997;202(1):79–86. doi: 10.1148/radiology.202.1.8988195. [DOI] [PubMed] [Google Scholar]
- 4.O’Donnell M, Skovoroda AR, Shapo BM, Emelianov SY. “Internal displacement and strain imaging using ultrasonic speckle tracking,”. IEEE Trans Ultrason, Ferroelect Freq Contr. May 1994;41:314–325. [Google Scholar]
- 5.Krouskop TA, Dougherty DR, Vinson FS. “A pulsed Doppler ultrasonic system for making noninvasive measurements of the mechanical properties of soft tissue,”. J Rehab Res Develop. 1987;24(2):1–8. [PubMed] [Google Scholar]
- 6.Parker KJ, Huang SR, Musulin RA, Lerner RM. “Tissue response to mechanical vibrations for ’sonoelasticity imaging’,”. Ultrasound Med Biol. 1990;16(3):241–246. doi: 10.1016/0301-5629(90)90003-u. [DOI] [PubMed] [Google Scholar]
- 7.Insana MF, Cook LT, Bilgen M, Chaturvedi P, Zhu Y. “Maximum-likelihood approach to strain imaging using ultrasound,”. J Acoust Soc Amer. 2000;107(3):1421–1434. doi: 10.1121/1.428429. [DOI] [PMC free article] [PubMed] [Google Scholar]
- 8.Hall TJ, Zhu Y, Spalding CS. “In vivo real-time freehand palpation imaging,”. Ultrasound Med Biol. 2003;29(3):427–435. doi: 10.1016/s0301-5629(02)00733-0. [DOI] [PubMed] [Google Scholar]
- 9.Walker WF. “Internal deformation of a uniform elastic solid by acoustic radiation force,”. J Acoust Soc Amer. 1999;105(4):2508–2518. doi: 10.1121/1.426854. [DOI] [PubMed] [Google Scholar]
- 10.Fatemi M, Greenleaf JF. “Application of radiation force in noncontact measurement of the elastic parameters,”. Ultrason Imag. 1999;21(2):147–154. doi: 10.1177/016173469902100205. [DOI] [PubMed] [Google Scholar]
- 11.Nightingale KR, Nightingale RW, Palmeri ML, Trahey GE. “A finite element model of remote palpation of breast lesions using radiation force: Factors affecting tissue displacement,”. Ultrason Imag. 2000;22(1):35–54. doi: 10.1177/016173460002200103. [DOI] [PubMed] [Google Scholar]
- 12.Sarvazyan AP, Rudenko OV, Swanson SD, Fowlkes JB, Emelianov SY. “Shear wave elasticity imaging: A new ultrasonic technology of medical diagnostics,”. Ultrasound Med Biol. 1998;24(9):1419–1435. doi: 10.1016/s0301-5629(98)00110-0. [DOI] [PubMed] [Google Scholar]
- 13.Ketterling JA, Lizzi FL. “Time-domain pressure response of arrays with periodic excitation,”. J Acoust Soc Amer. 2003;114(1):48–51. doi: 10.1121/1.1580834. [DOI] [PubMed] [Google Scholar]
- 14.Kallel F, Bertrand M. “Tissue elasticity reconstruction using linear perturbation method,”. IEEE Trans Med Imag. June 1996;15:299–313. doi: 10.1109/42.500139. [DOI] [PubMed] [Google Scholar]
- 15.Quazi AH. “An overview of the time delay estimate in active and passive systems for target localization,”. IEEE Trans Acoust Speech, Signal Processing. 1981;ASSP-29:527–533. [Google Scholar]
- 16.Kallel F, Ophir J. “Three-dimensional tissue motion and its effect on image noise in elastography,”. IEEE Trans Ultrason, Ferroelect Freq Contr. Nov 1997;44:1286–1296. [Google Scholar]
- 17.Y. G. Fung, Biomechanical Properties of Living Tissues. New York: Springer, 1981, ch. 7.
- 18.Konofagou EE, Harrigan TP, Ophir J, Krouskop TA. “Poroelastography: Imaging the poroelastic properties of tissues,”. Ultrasound Med Biol. 2001;27(10):1387–1397. doi: 10.1016/s0301-5629(01)00433-1. [DOI] [PubMed] [Google Scholar]
- 19.Tanter M, Bercoff J, Sandrin L, Fink M. “Ultrafast compound imaging for 2-D motion vector estimation: Application to transient elastography,”. IEEE Trans Ultrason Ferroelect Freq Contr. Oct 2002;49:1363–1374. doi: 10.1109/tuffc.2002.1041078. [DOI] [PubMed] [Google Scholar]
- 20.Bonnefous O. “Measurement of the complete (3D) velocity vector of blood flows,” in. Proc IEEE Ultrasonics Symp. 1988;2:795–799. [Google Scholar]
- 21.Morsy AA, von Ramm OT. “FLASH correlation: A new method for 3-D ultrasound tissue motion tracking and blood velocity estimation,”. IEEE Trans Ultrason Ferroelect Freq Contr. May 1999;46:728–736. doi: 10.1109/58.764859. [DOI] [PubMed] [Google Scholar]
- 22.Bohs LN, Gebhart SC, Anderson ME, Geiman BJ, Trahey GE. “2-D motion estimation using two parallel receive beams,”. IEEE Trans Ultrason Ferroelect Freq Contr. Mar 2001;48:392–408. doi: 10.1109/58.911722. [DOI] [PubMed] [Google Scholar]
- 23.Mailloux GE, Bleau A, Bertrand M, Petitclerc R. “Computer analysis of heart motion from two-dimensional echocardiograms,”. IEEE Trans Biomed Eng. May 1987;BME-34:356–364. doi: 10.1109/tbme.1987.325967. [DOI] [PubMed] [Google Scholar]
- 24.Bohs LN, Friemel BH, McDermott BA, Trahey GE. “A real time system for quantifying and displaying two-dimensional velocities using ultrasound,”. Ultrasound Med Biol. 1993;19(9):751–761. doi: 10.1016/0301-5629(93)90092-3. [DOI] [PubMed] [Google Scholar]
- 25.Lubinski MA, Emelianov SY, Raghavan KR, Yagle AE, Skovoroda AR, O’Donnell M. “Lateral displacement estimation using tissue incompressibility,”. IEEE Trans Ultrason, Ferroelect Freq Contr. Mar 1996;43:247–256. doi: 10.1109/58.660158. [DOI] [PubMed] [Google Scholar]
- 26.Jurvelin JS, Buschmann MD, Hunziker EB. “Mechanical anisotropy of the human knee articular cartilage in compression,” in. Proc Inst Mech Eng [H] 2003;217:215–219. doi: 10.1243/095441103765212712. [DOI] [PubMed] [Google Scholar]
- 27.Konofagou E, Ophir J. “A new elastographic method for estimation and imaging of lateral displacements, lateral strains, corrected axial strains and Poisson’s ratios in tissues,”. Ultrasound Med Biol. 1998;24(8):1183–1199. doi: 10.1016/s0301-5629(98)00109-4. [DOI] [PubMed] [Google Scholar]
- 28.Entrekin RR, Porter BA, Sillesen HH, Wong AD, Cooperberg PL, Fix CH. “Real-time spatial compound imaging: Application to breast, vascular, and musculoskeletal ultrasound,”. Sem Ultrasound CT MR. 2001;22(1):50–64. doi: 10.1016/s0887-2171(01)90018-6. [DOI] [PubMed] [Google Scholar]
- 29.Kallel F, Ophir J. “A least-squares strain estimator for elastography,”. Ultrason Imag. 1997;19(3):195–208. doi: 10.1177/016173469701900303. [DOI] [PubMed] [Google Scholar]
- 30.Techavipoo U, Varghese T. “Wavelet denoising of displacement estimates in elastography,”. Ultrasound Med Biol. 2004;30(4):477–491. doi: 10.1016/j.ultrasmedbio.2003.11.010. [DOI] [PubMed] [Google Scholar]
- 31.L. L. Scharf, “Least squares,” in Statistical Signal Processing: Detection, Estimation, and Time Series Analysis. Reading, MA: Addison-Wesley, 1991, pp. 359–415.
- 32.Li Y, Zagzebski J. “Frequency domain model for generating B-mode images with array transducers,”. IEEE Trans Ultrason, Ferroelect Freq Contr. May 1999;46:690–699. doi: 10.1109/58.764855. [DOI] [PubMed] [Google Scholar]
- 33.Kallel F, Bertrand M, Ophir J. “Fundamental limitations on the contrast-transfer efficiency in elastography: An analytic study,”. Ultrasound Med Biol. 1996;22(4):463–470. doi: 10.1016/0301-5629(95)02079-9. [DOI] [PubMed] [Google Scholar]
- 34.Meixner D, Hangiandreou NJ, Charboneau JW, Hall TJ, Zhu Y, Farrell MA. “Initial clinical experience with real-time ultrasound strain imaging of the thyroid,”. (Abstract) RSNA. 2002;225:p. 713. [Google Scholar]
- 35.Konofagou EE, Harrigan T, Ophir J. “Shear strain estimation and lesion mobility assessment in elastography,”. Ultrasonics. 2000;38(1–8):400–404. doi: 10.1016/s0041-624x(99)00125-0. [DOI] [PubMed] [Google Scholar]
- 36.Righetti R, Ophir J, Ktonas P. “Axial resolution in elastography,”. Ultrasound Med Biol. 2002;28(1):101–113. doi: 10.1016/s0301-5629(01)00495-1. [DOI] [PubMed] [Google Scholar]


