


Abstract
Only a small fraction of short oligonucleotide probes bind efficiently to complementary segments in long RNA transcripts. Technologies such as array-based transcript profiling and antisense control of gene expression would benefit greatly from a method for predicting probes that bind well to a given target RNA. To develop an algorithm for prioritizing selection of probes, we have analyzed predicted thermodynamic parameters for the binding of several large sets of probes to complementary RNA transcripts. The binding of five of these sets of probes to their RNA targets has been reported by others. In addition, we have used a method for light-directed synthesis of oligonucleotide arrays that we developed to generate two new arrays of surface-bound probes and measured the binding of these probes to their RNA targets. We considered predicted free energies for intramolecular base pairing of the oligonucleotide and its RNA target as well as the predicted free energy of intermolecular hybridization of probe and target. We find that a reliable predictor of probes that will hybridize significantly with their targeted transcripts is the predicted free energy of hybridization minus the predicted free energy for intramolecular folding of the probe.
INTRODUCTION
Many of the methods of contemporary biotechnology rely on the recognition of a targeted nucleic acid by a probe comprising its Watson–Crick complement. Control of gene translation by antisense inhibition is a well-established technique that relies on the recognition of an RNA message by a complementary oligonucleotide (1). Watson–Crick hybridization of a probe to its complement is also a well-established method of detecting and quantitating nucleic acid analytes, and technologies for making and using many such probes in an arrayed format allow highly parallel analyses (2,3). These techniques rely on the predictability of Watson–Crick base pairing to allow a priori design of probes from knowledge of the target sequence and the simple rules of base pairing.
Whereas the specificity of binding is predictable, the efficiency of short oligonucleotide probes binding to long nucleic acid targets has not been predictable (4,5). Most short (∼20mer) oligonucleotide probes selected for a given mRNA will not bind efficiently to the full-length transcript. As a result, many potential antisense agents lack efficacy (6,7), and many oligonucleotide probes afford a poor signal to noise ratio in hybridization-based measurements (4,8).
This lack of predictability has been circumvented in several ways. Antisense agents have often been selected by trial and error, testing many possible complementary sequences to find those that are efficacious. Similarly, oligonucleotide probe arrays typically include a number of probes for each gene of interest, partly to compensate for the likelihood that many of the probes selected will not function acceptably (8,9). Fragmentation of the target to be analyzed reduces the problem of efficient binding somewhat, but reduces the amount of label per target when the label is uniformly incorporated. Longer probes, such as cDNA probes and oligonucleotides as long as 70mers (10), ameliorate the problem of inefficient hybridization, but they do so with a sacrifice in specificity, which will become increasingly important as transcript measurements focus increasingly on splice variants.
Secondary structure of the RNA target is widely believed to be a principle factor influencing the efficiency of hybridization, so many attempts to predict probes which bind most efficiently to large RNA transcripts have focused on known or predicted RNA secondary structures. These attempts have led to few generalizations of practical utility in the design of probes, perhaps because of imperfect prediction of the conformations of large RNA molecules or because of an incomplete understanding of the kinetics of disruption of those conformations by hybridization to a short oligonucleotide.
Other attempts have focused on thermodynamic analyses of the entire process of hybridization, including the free energy of displacing RNA secondary structure by probe binding and free energy of heteroduplex formation. An important example of this approach was reported by Stull et al. (11), who calculated three indices for hybridization based on the thermodynamics of individual steps in the process. They determined the correlation of these indices with known hybridization efficiencies from five studies in the literature. They found the best correlation to be with the index that represents the predicted free energy of heteroduplex formation without inclusion of terms for disruption of internal base pairing of the mRNA. However, literature reports suggest that this index does not consistently provide acceptable probe choices (4,5,12).
Since the report of Stull et al., improved parameters for prediction of the stabilities of folded conformations of DNA (13) and RNA (14,15) as well as for the calculation of the stabilities of RNA/DNA heteroduplexes (16) have been determined. Mathews et al. incorporated these parameters into a program to predict oligonucleotide affinity to nucleic acid targets (17), and the program was demonstrated with three data sets from the literature. This analysis confirmed that the thermodynamic values obtained had predictive value in some cases, but did not prescribe a thermodynamic parameter of most general predictive value.
Until recently, the data sets available to examine correlation between thermodynamic parameters and hybridization efficiency were relatively small. For example, the data sets available to Stull et al. consisted of at most 14 antisense agents of measured efficacy. In contrast, microarray technologies have made accessible much larger data sets that test all possible probes to an RNA transcript or a region of an RNA transcript. In light of these developments, we have generated large new data sets for probe binding to RNA transcripts and analyzed them as well as data sets from the literature with regard to predicted thermodynamic indices.
MATERIALS AND METHODS
Oligodeoxyribonucleotide array synthesis
Arrays for analysis of green fluorescent protein (GFP) and p53 were synthesized in situ on glass substrates using light-directed chemistry (18–20) and a digital micromirror array as described previously (21–23). Corning 1 × 3 inch glass microscope slides were cleaned and coated with 3-glycidoxypropyltrimethoxysilane (Aldrich) and polyethyleneglycol (average molecular weight 300; Aldrich) as described by Maskos and Southern (24). In preparation for microarray fabrication, the synthesis area of a slide was reacted with a 1:1 (v:v) mixture of 0.1 M protected linker phosphoramidite (MeNPOC-hexaethylene glycol β-cyanoethyl phosphoramidite) (18,20) and tetrazole in acetonitrile (Annovis, Aston, PA). The mixture was allowed to react for 2 min with the glass surface and then washed with acetonitrile.
An array of oligonucleotide probes was synthesized on the resulting surface using light-directed phosphoramidite synthesis. MeNPOC-protected phosphoramidites were used in the synthesis (20). Light for each photochemical deprotection step was spatially addressed with a Texas Instruments Digital Light Processor (DLP™). The DLP was illuminated with the 365 nm peak from a 200 W Hg/Xe arc lamp. Illumination of the DLP and projection of the reflected image were accomplished with a custom optical system designed by Brilliant Technologies (Denton, TX). The image of the DLP was projected onto the reactive surface without magnification. The DLP was coordinated with a home-built fluidics system for automated DNA synthesis (22). Custom software generated the patterns of illumination required to fabricate the desired array of oligonucleotides. Final deprotection of the synthesized array was with a 1:1 (v:v) solution of ethylenediamine and ethanol for 2 h at room temperature.
Sample preparation and hybridization
RNA samples were prepared for hybridization to probe arrays by transcription in vitro, using a template amplified by PCR. Fluorescent label was incorporated during transcription. The template for the GFP transcript was amplified from the plasmid pGFP (accession no. U17997, nucleotides 207–981; Clontech) using primers d(TAATACGACTCACTATAG GGAAACAGCTATGACCATG) and d(ATGTGTAATCC CAGCAGCTG), which incorporated the T7 promoter sequence. The template for the p53 transcript was amplified from a plasmid constructed by inserting the coding sequence for p53 (accession no. AH002918, nucleotides 225–1448) into the EcoRI site of plasmid pcDNA3.1(+) (Invitrogen). Primer sequences were d(TAATACGACTCACTATAGGG) and d(TAGAAGGCACAGTCGAGG). The T7 promoter sequence, present in the vector, was used as a priming site for PCR. An annealing temperature of 59°C was used in 30 rounds of amplification for each template.
The amplified templates (45 µl of PCR solution) were used directly in transcription reactions that contained 200 U T7 RNA polymerase (Ambion), 2 mM each nucleotide triphosphate and (in addition to 2 mM UTP) 0.5 mM Cy3-UTP (Amersham) in the supplied buffer (Ambion). The reaction was carried out at 37°C for 2 h, followed by de-salting (NICK column; Pharmacia) and ethanol precipitation. Approximately one label was incorporated for every 40 nt, measured by the optical absorbances of Cy3 at 550 nm and the RNA at 260 nm. The ethanol precipitates were suspended in 30 µl of 6× SSPE buffer (0.9 M NaCl, 6 mM EDTA, 60 mM sodium phosphate, pH 7.4) containing 0.01% Tween 20 (SSPE-T buffer) with a control oligonucleotide (5′-[Cy3]TATATCAAAGCAGTA AGTAG-3′) and mouse COT DNA (0.1 mg/ml). No steps were taken to fragment the RNA transcripts prior to hybridization.
The RNA samples were applied to the arrays under a glass coverslip and hybridized for 16 h at 37°C. After hybridization, the arrays were washed three times with 6× SSPE-T and three times with 0.8× SSPE-T at room temperature. The arrays were dried by centrifugation and scanned using an Axon Genepix 3000 scanner to detect Cy3 fluorescence intensity. The signal intensity for each feature was determined using custom analysis software. The software identifies the region defined by each feature, determines the mean signal intensity in the feature, discards pixels with signal more than three times the standard deviation from the mean, and re-calculates the mean. The signal in control features containing oligonucleotide that was not complementary to any component of the sample was used as an estimate of background, which was subtracted from the signal for every feature.
Calculation of thermodynamic indices
Four basic thermodynamic indices were calculated for each probe. One index was the predicted free energy of heteroduplex formation, whereas the remaining three were calculated as penalties accrued for disrupting intramolecular base pairs in the probe or analyte. To calculate the free energy of heteroduplex formation (H), the nearest neighbor model (25) was applied, using the 16 nearest neighbor parameters and initiation parameter determined by Sugimoto et al. (16) for RNA/DNA heteroduplex formation. The free energy of intramolecular folding for each probe was calculated using the program mfold 3.1 using parameters for DNA folding (13). A penalty was assigned due to probe folding if the calculated free energy was less than 0. The penalty due to probe folding (P) is defined here as the negative of the free energy of the most stable predicted folded structure of the probe. A penalty of 0 was assigned to probes for which mfold returned no folded conformation or for which the most stable conformation had a positive free energy with respect to a random coil conformation.
Penalties for disrupting the internal base pairing of the RNA transcript upon probe hybridization were calculated using mfold in two different ways. For both penalties, mfold was used to calculate the free energy of the most stable predicted secondary structure of the analyte transcript. One penalty (Au) was calculated by subtracting this energy from the free energy of the most stable predicted secondary structure in which the nucleotides involved in base pairing with the probe are prevented from base pairing internally. The folded conformation of the RNA was not constrained in any other way for this penalty, so global changes in the folded conformation of the RNA were allowed in response to probe binding (26,27).
In addition, a ‘constrained’ analyte folding penalty (Ac) was calculated with the assumption that the global secondary structure of the RNA (outside of the nucleotides involved in base pairing with the probe) is maintained upon binding to the probe. This assumption might be valid if, for example, the kinetic barriers to reorganization are high (28). To implement this assumption, the free energy of the folded conformation of the probe-bound RNA was calculated with mfold with the application of additional constraints that preserve the overall secondary structure. The nucleotides that are single-stranded in the predicted lowest energy structure for the free RNA were constrained to be single-stranded in the folded RNA bound to probe, as were the nucleotides involved in base pairing with the probe. To calculate the index penalty, the free energy of the most stable structure predicted for the transcript without any bases forced to be single-stranded was subtracted from the free energy of the most stable constrained structure.
RESULTS
Microarray survey of probes for GFP and p53
To generate new data sets relating probe sequences to hybridization efficiency, we hybridized labeled transcripts comprising the messages for GFP and the tumor suppressor p53 to oligonucleotide arrays. We synthesized the oligonucleotide arrays in situ using a system that we developed which uses light-directed DNA synthesis chemistry and a digital micromirror array to illuminate the synthesis substrate with the desired pattern of UV light. This system allows rapid custom synthesis of oligonucleotide arrays. Each array contained a collection of 21 nt probes complementary to the targeted RNA transcript. Each probe was translated 1 nt along the transcript from the adjacent probe, tiling across the full length of the gene sequence. The p53 transcript was probed with 1162 unique oligonucleotide sequences, and the GFP transcript was probed with 755 unique oligonucleotide sequences. Three replicates of each probe set were synthesized on each array and each array was synthesized and hybridized in duplicate (two different preparations of RNA), providing six replicates of data for each transcript.
Typical results of the array analyses are shown in Figure 1. As seen by others with different RNA molecules, the amount of signal arising from hybridization to each probe varied considerably. Many probes yielded little signal, and only a few probes yielded high signal. Intensity of signal from probe hybridization is generally clustered into distinct peak regions, but probes that afford high signal are sometimes adjacent to probes that afford low signal at the edges of these peaks.
Figure 1.

Fluorescence scans of oligonucleotide arrays for determination of probe hybridization to RNA transcripts comprising sequences of p53 (A) and GFP (B). Patterns of six alternating bright and dark features are fiducial markers created by the hybridization of a labeled control oligonucleotide to complementary features on the array. The control oligonucleotide was co-hybridized with the labeled RNA.
The distribution of signal intensities on the array of probes for p53 is shown in Figure 2. On this array, 50% of the probes yielded hybridization signal <3% of the highest signal. Only 10% of the probes afforded signal that was >15% of the highest signal. The distribution of signal intensities on the array of probes for GFP is shown in Figure 3. On this array, 50% of the probes yielded hybridization signal <1% of the highest signal. Only 10% of the probes afforded signal that was >5% of the highest signal.
Figure 2.
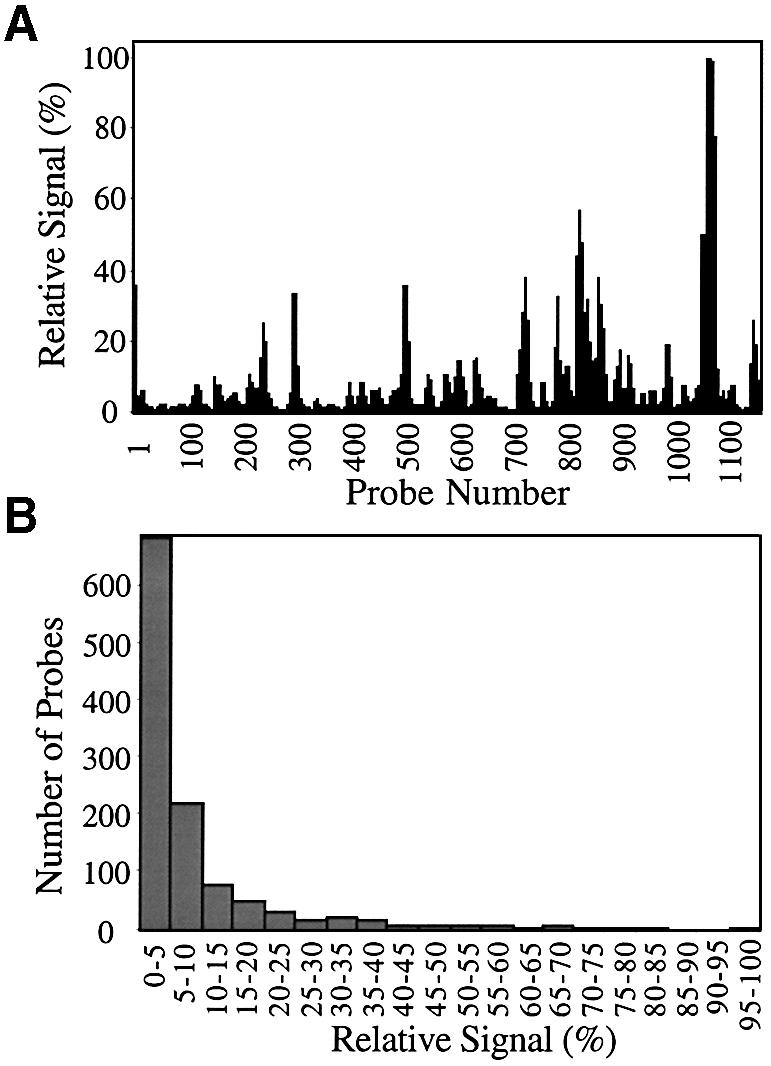
Distribution of hybridization signals among 1162 different probes for the p53 transcript. (A) Relative signal measured for each probe. The highest signal is scaled to 100% and all other probe signals are relative to that value. (B) The relative signals are divided into bins of 5% ranges, and the number of probes within each signal range is plotted.
Figure 3.
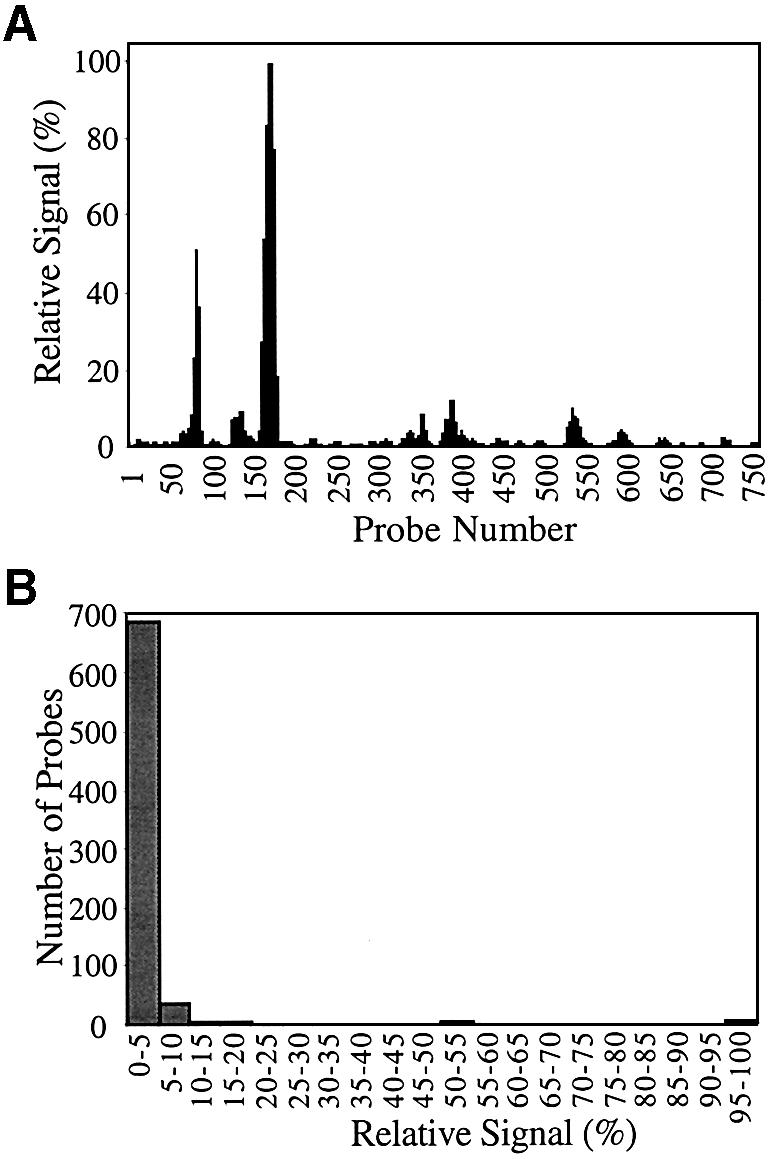
Distribution of hybridization signals among 755 different probes for the GFP transcript. (A) Relative signal measured for each probe. The highest signal is scaled to 100% and all other probe signals are relative to that value. (B) The relative signals are divided into bins of 5% ranges, and the number of probes within each signal range is plotted.
The pattern of hybridization signal was consistent among the replicates for a given RNA and had similar distributions of normalized signal intensities. A quantitative expression of the variation between replicate experiments is the mean of the absolute values of the differences in signal for each probe. That value ranged from 3 to 4% in the pairwise comparisons of the six replicates for p53. With GFP, it was <1% for the pairwise comparisons of arrays co-hybridized with that shown in Figure 1. It ranged from 8 to 10% in pairwise comparisons between data sets with different array and RNA preparations and hybridizations.
A lower limit to the specificity of hybridization for a probe to its target site in these experiments can be judged from the difference in signal between a probe that binds efficiently and the probe with the most similar sequence to that probe. For example, the probe that produces the highest signal for hybridization to GFP is different from its most similar probe on the GFP array by 7 nt. The signals observed for these two probes differed by 50-fold. Thus, even if the less efficient probe does not bind to its own target sequence in GFP at all, the experiment shows at least 50-fold specificity against binding of probes to target sites with seven mismatches.
In both p53 and GFP, most of the target sites differ in sequence from their most similar site by at least 9 nt. The smallest number of differences between a target site and a site of similar (but not overlapping) sequence in the p53 transcript is 4 nt, and that only occurs for six pairs of probes. Similarly in the GFP transcript, the smallest number of differences between a target site and a site of similar sequence is 6 nt, occurring for only eight pairs of probes. Given the observed discrimination against binding with seven mismatches, the infrequency of probes on either array that can cross-hybridize to other target sites with fewer than seven mismatches, and the fact that the majority of the probes provide low signal for hybridization anywhere on the analyzed transcript (see Figs 2 and 3), cross-hybridization is unlikely to contribute significantly to the measured signals in these experiments.
Correlation of hybridization efficiencies with thermodynamic indices
To investigate the relevance of calculated thermodynamic indices to the efficiency of hybridization, we plotted the natural logarithm of the relative hybridization signal for each probe versus the four basis indices (calculated as described in Materials and Methods) and various sums of the basis indices. The logarithm of the relative hybridization signal was used because of the logarithmic relationship between free energy and binding constant. In addition to the data sets that we generated, two other data sets reported in the literature by others were also investigated. One data set was generated by array hybridization of 106 contiguous probes (17mers) to rabbit β-globin (4). Another data set was for the antisense efficacy of 32 phosphorothioate probes (20mers) for the human multidrug resistance-1 (HMDR) gene (29). Hybridization intensity in this case was taken as the percentage inhibition of the activity of the gene product, p-glycoprotein. Plots relating the hybridization of probes to these four transcripts with the predicted free energy of heteroduplex formation are shown in Figure 4.
Figure 4.

The natural logarithm of the relative binding efficiency plotted as a function of the negative of the predicted free energy of DNA/RNA heteroduplex formation for (A) p53, (B) GFP, (C) HMDR and (D) rabbit β-globin.
The r2 values describing the correlations for each data set with the four basis indices and some of their combinations are summarized in Table 1. Of the four basis parameters, only the predicted free energy of heteroduplex formation (H) is significantly correlated with all of the data sets (P < 0.001 in all cases). The strongest correlation observed is of that parameter with the data for the HMDR gene. For the four genes studied, that correlation is improved or only slightly diminished (HMDR) by the addition of a penalty for the predicted free energy of probe folding (P). In all cases except that of rabbit β-globin, the correlation is diminished substantially by addition of penalties for the predicted free energy of analyte folding (Ac or Au). In the case of rabbit β-globin, the strongest correlation is found between the observed hybridization and the sum of the free energy of heteroduplex formation, a penalty for the free energy of probe folding and a penalty for constrained analyte folding.
Table 1. r2 values for the correlation of ln(hybridization signal) with prioritization indices.
| RNA | Ha | Pb | Acc | Aud | H+P | H+Ac | H+P+Ac |
|---|---|---|---|---|---|---|---|
| p53e | 0.24–0.33 | 0.004–0.014 | 0.006–0.019 | 0.003–0.070 | 0.27–0.40 | 0.012–0.074 | 0.014–0.089 |
| GFPe | 0.11–0.24 | 0.001–0.028 | 0.0002–0.028 | 0.011–0.056 | 0.11–0.28 | 0.023–0.071 | 0.019–0.066 |
| HMDR | 0.82 | 0.005 | 0.31 | NC | 0.81 | 0.46 | 0.36 |
| β-globin | 0.14 | 0.04 | 0.05 | NC | 0.21 | 0.38 | 0.46 |
NC, not calculated.
aFree energy of heteroduplex formation.
bPenalty due to probe folding.
cPenalty assigned due to analyte folding, calculated assuming heteroduplex formation does not perturb global secondary structure.
dPenalty due to analyte folding, calculated without secondary structure constraints.
eSix replicate experiments were analyzed independently and the range of the r2 values for the six replicates is reported.
Selection of probes based on thermodynamic index
An important goal of predicting hybridization efficiencies is to choose those probes from a list of possible probes that hybridize most efficiently, perhaps for greatest signal in hybridization measurements or for greatest efficacy as antisense agents. Although the correlations with even the most reliable thermodynamic index found here can be modest, they nonetheless might be used as the basis for prioritizing probe selections. If sufficiently effective, such rational prioritization of probe selection might allow a greatly narrowed scope of trial and error for the discovery of effective antisense agents and might allow for more effective design of oligonucleotide arrays with fewer probes per transcript, thus more transcripts investigated per array.
We examined the selection of probes based on the most reliably correlated thermodynamic index found here, the free energy of heteroduplex formation plus the penalty for probe folding. The probes were ranked according to this index and the highest ranked probes were checked for their relative hybridization efficiency. For example, for GFP, four of the five probes that were highest ranked by index had hybridization efficiencies ≥60% of the highest signal probe for all six replicate experiments (>79% for the replicate shown in Table 2). In four of the six experiments, the highest ranked probe indeed had the highest signal, and in each of the remaining two, the highest ranked probe had a signal of >96% of the maximum signal probe.
Table 2. Relative hybridization signal of highest ranked probesa.
| Rank | p53b | GFPc | HMDR | β-globin | cyclin B1 | cyclin B4 | cyclin B5 |
|---|---|---|---|---|---|---|---|
| 1 | 22 | 99 | 98 | 40 | 46 | 33 | 9 |
| 2 | 61 | 97 | 100 | 43 | 38 | 20 | 6 |
| 3 | 100 | 1 | 80 | 37 | 58 | 4 | 5 |
| 4 | 77 | 80 | 75 | 32 | 39 | 21 | 2 |
| 5 | 68 | 79 | 73 | 35 | 0 | 3 | 5 |
The relative signals of the five probes ranked highest by index are listed in Table 2 for p53, GFP, HMDR and β-globin transcripts. In addition, the ranking of 106 probes (15mer) each for Xenopus cyclins B1, B4 and B5 was compared with the relative signals for those probes measured by Southern and co-workers in arrayed hybridization experiments (30). The relative signals of the five probes ranked highest by index for those transcripts are also listed in Table 2. Ranking by index is most successful for p53, GFP and HMDR, with at least four of the top five ranked probes yielding signal that is >60% of the maximum signal for each of those analytes.
Although less successful for β-globin, cyclin B1 and cyclin B4, the top five probe selections for these transcripts included probes that afforded significant signal. Furthermore, the top five probes in each case were significantly better than statistically expected if picked randomly. For β-globin and cyclin B1, five out of five and four out of five selected probes, respectively, bound transcript better than 90% of the probes tested. For cyclin B4, three of five selected probes bound transcript better than 80% of all probes tested. Even in the case of cyclin B5, for which ranking by index was least successful, four of the top five probes bound transcript better than 50% of the probes tested.
DISCUSSION
This report describes the binding behavior of over 2000 unique probes to complementary sites in large RNA transcripts. To our knowledge, this is the most comprehensive analysis of probe binding to large RNA molecules reported in the literature. The picture that emerges from the present analysis is consistent with the results of some previous investigations but extends them in valuable ways. Whereas some have found a correlation between hybridization efficiency and free energy of heteroduplex formation (11,31), others have rejected that parameter as an important predictor (4,12). We found a correlation in every example that we studied (including data where others had not reported one), and quantified that correlation. Others have also observed a negative contribution from internal base pairing of the probe (31). We have adopted the systematic use of this parameter as a component of a predictive thermodynamic index, and we quantified the resulting correlation.
Algorithmic approach to probe selection
A variety of experimental methods have been demonstrated for the selection of short probes that bind efficiently to large RNA molecules. For example, assays for stimulation of RNase H cleavage by libraries of oligonucleotides have been used to reveal regions of RNA that are amenable to probe binding (29,30). Arrayed hybridization experiments can also provide a complete picture of probe binding to a given target molecule (4,5,28,30,32–35). Though these empirical methods are effective, they do not allow high-throughput selection of probes. Databases of effective probes can be generated with them but will frequently be found inadequate when investigating the diversity of sequences present among a variety of organisms and splice variants. Thus, an algorithmic approach to selecting probes for a collection of large nucleic acid targets is desirable.
The results of our analysis suggest part of such an algorithmic approach. A step in the selection process, which is readily automated (17), is the ranking of the possible probes according to the parameter calculated as the free energy of heteroduplex formation plus a penalty accounting for the free energy of formation of stable probe conformations. In most cases, many of the probes given highest priority by this ranking will be among the most efficient in hybridization. This generalization has been true when the ranking is applied to entire transcripts (GFP, p53), portions of transcripts (β-globin) and subsets of probes pre-selected for RNase H activity (HMDR, cyclins B1, B4 and B5). Inclusion of the penalty for probe folding, though increasing the correlation with binding overall only a small amount, makes an important contribution to effective ranking of the probes. As can be seen by comparing Figures 4 and 5, several probes that bind poorly to the GFP and β-globin transcripts are removed from first ranked positions by including this penalty in the ranking index.
Figure 5.

The natural logarithm of the relative binding efficiency plotted as a function of the negative of the predicted free energy of DNA/RNA heteroduplex formation plus the free energy of probe folding for probes that are predicted to form stable internally base paired structures for (A) p53, (B) GFP, (C) HMDR and (D) rabbit β-globin.
Because efficiency of probe binding is often not the only relevant quantity, other criteria can be used to filter the probe selections. In arrayed probe hybridization experiments, uniqueness of the sequence recognized by the probe to the targeted transcript is an important criterion for specific detection or quantitation. A ranked probe list can be filtered for probe uniqueness starting with the probes ranked best, thus eliminating the need to check all probes for uniqueness. Similarly, other criteria can be applied to the selection of antisense agents after they have been ranked by thermodynamic index. Though antisense activity has been shown to correlate with binding (4,30,32,33,35), properties of probes related to cellular uptake and stability in vivo can be used to filter a ranked probe list.
Contribution of RNA folding
The high degree of variability in probe binding to large RNA molecules has typically been ascribed, at least in part, to inaccessibility of many probe binding sites due to intramolecular folding of the RNA. Indeed, numerous model studies support the conclusion that elements of RNA conformation play an important role in determining efficiency of probe binding (5,28,36–39). However, relative binding efficiency has rarely been predicted by analysis of a predicted secondary structure of a large RNA molecule (17,40). Many attempts at such prediction have relied on visual inspection of predicted secondary structure, looking for relationships between apparently single-stranded regions and binding. Such relationships have not been evident. In at least one case, a correspondence was observed between effective antisense activity and regions predicted to be double-stranded (12). Predicted secondary structures of the p53 and GFP transcripts in the region of the most efficient probe binding sites are shown in Figures 6 and 7. Most efficient probe binding to the p53 transcript was to a sequence for which 17 out of 21 nt were base paired in the secondary structure predicted most stable. Most efficient probe binding to the GFP transcript was to a sequence for which 10 out of 21 nt were base paired in the secondary structure predicted most stable.
Figure 6.

Predicted secondary structures for the most efficiently bound site in the p53 transcript. The numbers indicate the nucleotide position in the entire transcript (including sequence that flanks the p53 gene sequence) rather than the probe number. The nucleotides comprising the binding site are indicated by upper case letters. This probe binding site is ranked third in Table 2. (A) Secondary structure of predicted minimum free energy. (B) Secondary structure of the first sub-optimal predicted free energy.
Figure 7.

Predicted secondary structures for the most efficiently bound site in the GFP transcript. The numbers indicate the nucleotide position in the transcript. The nucleotides comprising the binding site are indicated by upper case letters. The probe binding site ranked highest in Table 2 is indicated by underlined letters. (A) Secondary structure of predicted minimum free energy. (B) Secondary structure of the first sub-optimal predicted free energy.
Attempts to put this analysis on a quantitative footing, in this study and others, have calculated the free energy penalty of disrupting predicted intramolecular base pairs in the RNA. Some of these analyses, including our own analysis of binding to the transcript for rabbit β-globin, have revealed correlations between parameters that account for RNA folding and probe binding, but no persistent correlation has been found. One reason for this lack of correspondence might be the difficulty of accurately predicting the free energies of folding or the kinetically preferred conformations for large RNA molecules. Thus, a thorough consideration of sub-optimal structures may be useful for predictions of hybridization efficiency. Another likely explanation for the lack of correspondence, supported in several reports (5,37–39), is that aspects of three-dimensional RNA structure, such as pre-organized stacking in single-stranded regions, effect the thermodynamics or kinetics of oligonucleotide binding. In that case, predictive accounting for RNA structure in probe binding will require tools for the prediction of RNA conformation in three dimensions.
Nevertheless, the analysis presented here indicates that factors other than folding of the RNA contribute considerably to the binding efficiencies of oligonucleotide probes of a given length. The significance of this observation is two-fold. First, it enables selection of probes that bind efficiently without explicit consideration of RNA folding. Second, it emphasizes that factors such as probe structure and sequence-dependent free energy of heteroduplex formation must be taken into account when using hybridization of oligonucleotide probes to study RNA structures and folding pathways.
Comparison to other prediction methods
Though many attempts to predict oligonucleotide binding to large RNA molecules have focused on correlations with predicted secondary structure (or three-dimensional structure) of the RNA, other approaches have been taken. In some cases these approaches have accounted for the thermodynamics of the hybridization process. The study of Stull et al. described above is one of the most systematic of these approaches in its determination of correlations for 12 data sets for four different genes. As in the current analysis, that analysis found a persistent correlation between an index reflecting free energy of duplex formation and binding, measured as antisense inhibition. In one study included in that analysis, no correlation was found between that index and the observed antisense inhibition of a set of six probes for rabbit β-globin. However, the free energy of hybridization used by Stull et al. was calculated using parameters for RNA/RNA duplex formation, rather than the more relevant parameters for heteroduplex (RNA/DNA) formation used here. Using parameters for heteroduplex formation, a correlation is found between the free energy of duplex formation and binding of 106 probes for rabbit β-globin measured in arrayed hybridization. Though Stull et al. considered folding of the large RNA partner in the thermodynamics of binding, they did not consider a parameter accounting for folding of the oligonucleotide. Our analysis shows that inclusion of a term to account for free energy of probe folding results in a useful increase in the correlation with observed binding.
Ho et al. noted a correlation between GC content and antisense efficacy in their study of the human multidrug resistance-1 mRNA (29). The r2 for this correlation is 0.73, somewhat lower than the correlation of antisense efficacy with the free energy of duplex formation (see Table 1). The stabilities of short duplexes can be estimated based upon the GC content of the oligomer and, as such, will be correlated with binding in a manner similar to the calculated free energy of hybridization. However, the free energy calculated from nearest neighbor parameters will generally be a better indicator of duplex stability than simple functions of GC content and length, because sequence, as well as sequence composition, has a significant influence on duplex stability.
Selection of oligonucleotide probes that bind efficiently and selectively to their targets is critical to construction of high feature-density oligonucleotide arrays such as those developed by Affymetrix (8,9). To predict the intensity of probe hybridization, Affymetrix uses computer models based on data from thousands of experiments that monitored the hybridization of target sequences in complex mixtures (www.affymetrix.com/technology/design/index.affx). The success of this approach is undoubtedly reflected in the success of the Affymetrix system of transcript profiling. However, the proprietary nature of the computer models and large data sets used in their creation do not allow general adoption by researchers other than users of Affymetrix arrays. In a different empirical approach, short sequence motifs were found that were correlated with good and poor antisense efficacy from among a large number of phosphorothioate oligonucleotides (41). Probe selection based on these correlations might be used in conjunction with probe prioritization based on thermodynamic indices.
SUPPLEMENTARY MATERIAL
Supplementary Material is available at NAR Online.
Supplementary Material is available at NAR Online.
Acknowledgments
ACKNOWLEDGEMENTS
The authors wish to thank Hue Tang and Emi Ponce de Souza for technical assistance and Bhargava Thudi for computational support. We would like to thank John Minna and Boning Gao for providing the plasmid containing the template for the p53 transcript. We would also like to thank Glenn McGall of Affymetrix for kindly supplying chemicals for light-directed synthesis of oligonucleotide arrays. This work was supported by grants CA70907 and CA81656 from the National Cancer Institute and by the Donald W. Reynolds Foundation.
REFERENCES
- 1.Wagner R.W. (1994) Gene inhibition using antisense oligodeoxynucleotides. Nature, 372, 333–335. [DOI] [PubMed] [Google Scholar]
- 2.Hacia J.G. (1999) Resequencing and mutational analysis using oligonucleotide arrays. Nature Genet., 21 (suppl. 1), 42–47. [DOI] [PubMed] [Google Scholar]
- 3.Ramsay G. (1998) DNA chips: state-of-the art. Nat. Biotechnol., 16, 40–44. [DOI] [PubMed] [Google Scholar]
- 4.Milner N., Mir,K.U. and Southern,E.M. (1997) Selecting effective antisense reagents on combinatorial oligonucleotide arrays. Nat. Biotechnol., 15, 537–541. [DOI] [PubMed] [Google Scholar]
- 5.Mir K.U. and Southern,E.M. (1999) Determining the influence of structure on hybridization using oligonucleotide arrays. Nat. Biotechnol., 17, 788–792. [DOI] [PubMed] [Google Scholar]
- 6.Woolf T.M., Melton,D.A. and Jennings,C.G. (1992) Specificity of antisense oligonucleotides in vivo. Proc. Natl Acad. Sci. USA, 89, 7305–7309. [DOI] [PMC free article] [PubMed] [Google Scholar]
- 7.Ricker R.D. and Kaji,A. (1992) Studies on antisense inhibition in vitro. Anomalies and re-evaluation. FEBS Lett., 309, 363–370. [DOI] [PubMed] [Google Scholar]
- 8.Lockhart D.J., Dong,H., Byrne,M.C., Follettie,M.T., Gallo,M.V., Chee,M.S., Mittmann,M., Wang,C., Kobayashi,M., Horton,H. et al. (1996) Expression monitoring by hybridization to high-density oligonucleotide arrays. Nat. Biotechnol., 14, 1675–1680. [DOI] [PubMed] [Google Scholar]
- 9.Wodicka L., Dong,H., Mittmann,M., Ho,M.-H. and Lockhart,D.J. (1997) Genome-wide expression monitoring in Saccharomyces cerevisiae. Nat. Biotechnol., 15, 1359–1367. [DOI] [PubMed] [Google Scholar]
- 10.Hughes T.R., Mao,M., Jones,A.R., Burchard,J., Marton,M., Shannon,K.W., Lefkowitz,S.M., Ziman,M., Schelter,J.M., Meyer,M.R. et al. (2001) Expression profiling using microarrays fabricated by an ink-jet oligonucleotide synthesizer. Nat. Biotechnol., 19, 342–347. [DOI] [PubMed] [Google Scholar]
- 11.Stull R.A., Taylor,L.A. and Szoka,F.C.,Jr (1992) Predicting antisense oliognucleotide inhibitory efficacy: a computational approach using histograms and thermodynamic indices. Nucleic Acids Res., 20, 3501–3508. [DOI] [PMC free article] [PubMed] [Google Scholar]
- 12.Laptev A., Lu,Z., Colige,A. and Prockop,D.J. (1994) Specific inhibition of expression of a human collagen gene (COL1A1) with modified antisense oligonucleotides. The most effective target sites are clustered in double-stranded regions of the predicted secondary structure for the mRNA. Biochemistry, 33, 11033–11039. [DOI] [PubMed] [Google Scholar]
- 13.SantaLucia J.J. (1998) A unified view of polymer, dumbbell and oligonucleotide DNA nearest-neighbor thermodynamics. Proc. Natl Acad. Sci. USA, 95, 1460–1465. [DOI] [PMC free article] [PubMed] [Google Scholar]
- 14.Zuker M., Mathews,D.H. and Turner,D.H. (1999) Algorithms and thermodynamics for RNA secondary structure prediction: a practical guide. In Barciszewski,J. and Clark,B.F.C. (eds), RNA Biochemistry and Biotechnology. Kluwer Academic, Dordrecht, The Netherlands, pp. 11–43.
- 15.Mathews D.H., Sabina,J., Zuker,M. and Turner,D.H. (1999) Expanded sequence dependence of thermodynamic parameters improves prediction of RNA secondary structure. J. Mol. Biol., 288, 911–940. [DOI] [PubMed] [Google Scholar]
- 16.Sugimoto N., Nakano,S., Katoh,M., Matsumura,A., Nakamuta,H., Ohmichi,T., Yoneyama,M. and Sasaki,M. (1995) Thermodynamic parameters to predict stability of RNA/DNA hybrid duplexes. Biochemistry, 34, 11211–11216. [DOI] [PubMed] [Google Scholar]
- 17.Mathews D.H., Burkard,M.E., Freier,S.M., Wyatt,J.R. and Turner,D.H. (1999) Predicting oligonucleotide affinity to nucleic acid targets. RNA, 5, 1458–1469. [DOI] [PMC free article] [PubMed] [Google Scholar]
- 18.McGall G.H. and Fidanza,J.A. (2001) Photolithographic synthesis of high-density oligonucleotide arrays. Methods Mol. Biol., 170, 71–101. [DOI] [PubMed] [Google Scholar]
- 19.Pease A.C., Solas,D., Sulivan,E.J., Cronin,M.T., Holmes,C.P. and Fodor,S.P.A. (1994) Light-generated oligonucleotide arrays for rapid DNA sequence analysis. Proc. Natl Acad. Sci. USA, 91, 5022–5026. [DOI] [PMC free article] [PubMed] [Google Scholar]
- 20.McGall G., Barone,A., Diggeleman,M., Fodor,S., Gentalen,E. and Ngo,N. (1997) The efficiency of light-directed synthesis of DNA arrays on glass substrates. J. Am. Chem. Soc., 119, 5081–5090. [Google Scholar]
- 21.Jaklevic J., Garner,H. and Miller,G. (1999) Instrumentation for the human genome project. Annu. Rev. Biomed. Eng., 1, 649–678. [DOI] [PubMed] [Google Scholar]
- 22.Luebke K.J., Balog,R.P., Mittelman,D. and Garner,H.R. (2002) Digital optical chemistry: a novel system for the fabrication of custom oligonucleotide arrays. In Kordal,R., Usmani,A.M. and Law,W.T. (eds), Microfabricated Sensors: Application of Optical Technology for DNA Analysis. American Chemical Society, Washington, DC, pp. 87–106.
- 23.Singh-Gasson S., Green,R.D., Yue,Y., Nelson,C., Blattner,F., Sussman,M.R. and Cerrina,F. (1999) Maskless fabrication of light-directed oligonucleotide microarrays using a digital micromirror array. Nat. Biotechnol., 17, 974–978. [DOI] [PubMed] [Google Scholar]
- 24.Maskos U. and Southern,E. (1992) Oligonucleotide hybridizations on glass supports: a novel linker for oligonucleotide synthesis and hybridization properties of oligonucleotides synthesized in situ. Nucleic Acids Res., 20, 1679–1684. [DOI] [PMC free article] [PubMed] [Google Scholar]
- 25.Borer P.N., Dengler,B., Tinoco,I.J. and Uhlenbeck,O.C. (1974) Stability of ribonucleic acid double-stranded helices. J. Mol. Biol., 86, 843–853. [DOI] [PubMed] [Google Scholar]
- 26.LeCuyer K.A. and Crothers,D.M. (1994) Kinetics of an RNA conformational switch. Proc. Natl Acad. Sci. USA, 91, 3373–3377. [DOI] [PMC free article] [PubMed] [Google Scholar]
- 27.Cload S.T., Richardson,P.L., Huang,Y.-H. and Schepartz,A. (1993) Kinetic and thermodynamic analysis of RNA binding by tethered oligonucleotide probes: alternate structures and conformational changes. J. Am. Chem. Soc., 115, 5005–5014. [Google Scholar]
- 28.Sohail M., Akhtar,S. and Southern,E.M. (1999) The folding of large RNAs studied by hybridization to arrays of complementary oligonucleotides. RNA, 5, 646–655. [DOI] [PMC free article] [PubMed] [Google Scholar]
- 29.Ho S., Britton,D., Stone,B., Behrens,D., Leffet,L., Hobbs,F., Miller,J. and Trainor,G. (1996) Potent antisense oligonucleotides to the human multidrug resistance-1 mRNA are rationally selected by mapping RNA-accessible sites with oligonucleotide libraries. Nucleic Acids Res., 24, 1901–1907. [DOI] [PMC free article] [PubMed] [Google Scholar]
- 30.Sohail M., Hochegger,H., Klotzbucher,A., Guellec,R.L., Hunt,T. and Southern,E.M. (2001) Antisense oligonucleotides selected by hybridisation to scanning arrays are effective reagents in vivo. Nucleic Acids Res., 29, 2041–2051. [DOI] [PMC free article] [PubMed] [Google Scholar]
- 31.Cairns M.J., Hopkins,T.M., Witherington,C., Wang,L. and Sun,L.-Q. (1999) Target site selection for an RNA-cleaving catalytic DNA. Nat. Biotechnol., 17, 480–486. [DOI] [PubMed] [Google Scholar]
- 32.Sohail M. and Southern,E.M. (2000) Hybridization of antisense reagents to RNA. Curr. Opin. Mol. Ther., 2, 264–271. [PubMed] [Google Scholar]
- 33.Sohail M. and Southern,E.M. (2000) Selecting optimal antisense reagents. Adv. Drug Deliv. Rev., 44, 23–34. [DOI] [PubMed] [Google Scholar]
- 34.Sohail M. and Southern,E.M. (2000) Antisense arrays. Mol. Cell Biol. Res. Commun., 3, 67–72. [DOI] [PubMed] [Google Scholar]
- 35.Sohail M. and Southern,E.M. (2001) Using oligonucleotide scanning arrays to find effective antisense reagents. Methods Mol. Biol., 170, 181–199. [DOI] [PubMed] [Google Scholar]
- 36.Fedor M.J. and Uhlenbeck,O.C. (1990) Substrate sequence effects on “hammerhead” RNA catalytic efficiency. Proc. Natl Acad. Sci. USA, 87, 1668–1672. [DOI] [PMC free article] [PubMed] [Google Scholar]
- 37.Lima W.F., Monia,B.P., Ecker,D.J. and Freier,S.M. (1992) Implication of RNA structure on antisense oligonucleotide hybridization kinetics. Biochemistry, 31, 12055–12061. [DOI] [PubMed] [Google Scholar]
- 38.Uhlenbeck O.C. (1972) Complementary oligonucleotide binding to transfer RNA. J. Mol. Biol., 65, 25–41. [DOI] [PubMed] [Google Scholar]
- 39.Zarrinkar P.P. and Williamson,J.R. (1994) Kinetic intermediates in RNA folding. Science, 265, 918–924. [DOI] [PubMed] [Google Scholar]
- 40.Patzel V., Steidl,U., Kronenwett,R., Haas,R. and Sczakiel,G. (1999) A theoretical approach to select effective antisense oligodeoxyribonucleotides at high statistical probability. Nucleic Acids Res., 27, 4328–4334. [DOI] [PMC free article] [PubMed] [Google Scholar]
- 41.Matveeva O.V., Tsodikov,A.D., Giddings,M., Freier,S.M., Wyatt,J.R., Spiridonov,A.N., Shabalina,S.A., Gesteland,R.F. and Atkins,J.F. (2000) Identification of sequence motifs in oligonucleotides whose presence is correlated with antisense activity. Nucleic Acids Res., 28, 2862–2865. [DOI] [PMC free article] [PubMed] [Google Scholar]