


Abstract
Comparative sequence analysis has been used to study specific questions about the structure and function of proteins for many years. Here we propose a knowledge-based framework in which the maximum likelihood rate of evolution is used to quantify the level of constraint on the identity of a site. We demonstrate that site-rate mapping on 3D structures using datasets of rhodopsin-like G-protein receptors and α- and β-tubulins provides an excellent tool for pinpointing the functional features shared between orthologous and paralogous proteins. In addition, functional divergence within protein families can be inferred by examining the differences in the site rates, the differences in the chemical properties of the side chains or amino acid usage between aligned sites. Two novel analytical methods are introduced to characterize rate- independent functional divergence. These are tested using a dataset of two classes of HMG-CoA reductases for which only one class can perform both the forward and reverse reaction. We show that functionally divergent sites occur in a cluster of sites interacting with the catalytic residues and that this information should facilitate the design of experimental strategies to directly test functional properties of residues.
INTRODUCTION
The relationship between molecular evolutionary processes, structures and functions of macromolecules has been recognized for a long time. An understanding of the physical basis of these processes in proteins will not only identify important factors in the emergence of functions, but also aid in the construction of structure-based phylogenetic models (1). However, physical models of proteins remain incomplete, preventing them from having general predictive properties (2). This is due to the failure of these models to account for terms that are not easily experimentally observable such as entropic effects (2). However, an evolutionary analysis, as presented here, is expected to detect the sequence and structural conservation patterns that result from these effects.
In previous studies, the rate of evolution at a site (site rate) is assumed to be an informative parameter to understand the relationship between structure and selection. Several pairs of structural features have been suggested to correlate with site rates including: secondary structure and solvent accessible surface area (ASA) of side chains (3), or ASA and distance to the catalytic center (4). Furthermore, the co-occurrence of amino acid substitutions in proteins has been observed and linked to the periodicity of secondary structural elements (5,6), a result that has important implications for quaternary assembly and intermolecular interactions (7). Detection of functional divergence has been used to study the evolution of class I α-mannosidase (8), and has been suggested to predict function within the caspase family (9). We have previously used phylogenetically estimated parameters to locate the potential substrate-binding regions of group II chaperonins (10) and to refine the stop-codon binding model of the termination factor eRF1 (11).
The contribution of phylogenetic information to structural biology goes beyond the identification of conserved and variable residues in an alignment. The estimated rates of evolution can be assumed to reflect the degree of functional constraint at a site (4,12) These rates take into account evolutionary processes via an explicit stochastic substitution model and extract information from the phylogenetic signal rather than simply considering the conservation versus variability of amino acid positions.
The importance of phylogenetic information versus simple conserved/variable schemes can be conveyed by an example. If one were to compare sequences of a protein across very closely related organisms in a multiple alignment, most sites will appear extremely ‘conserved’, with very few changes along alignment columns. If one then examines another alignment of the same gene made of sequences from a phylogenetically divergent set of organisms, it is likely that a larger number of sites in the latter group will be variable. In this case, inferences about relative functional importance based on conserved versus variable sites cannot be made because the phylogenetic range in the two cases is different. Thus, it is of the utmost importance to account for the divergence levels expected based on phylogenetic depth. Using a phylogenetic method such as maximum likelihood with a rates-across-sites model allows for the separation of branch lengths that reflect the phylogenetic depths of the comparisons while the site-by-site rates capture the relative rate of the actual amino acid positions (13). Not only can the relative degree of constraint at an amino acid position be reflected in these site rates (4,12,14,15), but phylogenetic trees of two homologous datasets (two subtrees) can then be compared on a site-by-site basis to find discrepancies (changes) in site rates. A change in site rate between homologs may reflect a change in function of the residue in the protein over evolutionary time, a phenomenon that has been referred to as ‘type I functional divergence’ by Gu (16,17). Prediction of type I functionally divergent sites has recently received much attention and a number of methods have now been published to detect significant changes in site rates across subtrees in a protein family (15–20). However, so far, little effort has been directed at detecting site-rate independent functional divergence (type II) that occurs via alteration in the amino acid usage or required chemical properties at a site (16).
In this communication, we introduce several methods for detecting and quantifying type II functional divergence at sites in protein families. These methods are implemented in a software tool, covARES, that maps site rates, type I and type II functional divergence and other comparative information provided by multiple sequence alignments and phylogenies onto 3D protein models. Recently, plotting site conservation onto 3D models has been implemented in the programs ConSurf (21) and rate4sites (12), while the program DIVERGE (22) uses a method to detect type I functionally divergent sites. In contrast, covARES is the first application that allows the detection of functional divergence between two subtrees using both rate-dependent (type I) and rate-independent (type II) methods and provides statistical and structural analysis tools to interpret the mapping results. Here, we demonstrate the utility of these methods for inferring functional constraints and/or divergence in a number of protein families.
MATERIALS AND METHODS
Site-rate estimation and phylogeny
A series of protein families were gathered from the NCBI protein sequence database surveyed with BLAST (23) using the following sequences from known crystal structures as queries: lobster enolase (1PDZ) (24), chloro-muconate cycloisomerase enzyme (cMLE) (1CHR) (25), α-/β-tubulin (1FFX) (26), and hydroxymethylglutaryl-CoA (HMG-CoA) reductase (1QAX) (27). A dataset of rhodopsin-like G-protein receptors was obtained from the Pfam database (28, accession 7tml_1) and mapped on the bovine protein structure (1F88) (29). Sequences were then aligned using Clustalw v.1.81 (30), the alignment was manually edited to remove gap regions and other segments of ambiguous homology and an estimate of the phylogeny was determined using the quartet puzzling algorithm under the maximum likelihood criterion employing a Jones–Taylor–Thornton (JTT) amino acid substitution model plus an eight site-rate category discretized Γ model implemented in Tree-Puzzle v.5.0 (31). Relevant and strongly supported nodes were identified to split the data into subtrees and the α (gamma shape) parameter was re-estimated for each subset of the data. Site rates used in this study were the conditional mode site-rates (i.e. they had the highest posterior probability given the model, tree and the rates-across-sites distribution) estimated by Tree-Puzzle v.5.0.
Algorithms
Software availability. The latest version of covARES can be accessed at the following URL (http://bogota.biochem.dal.ca/covares) or by request to the authors.
Centroid approximation. Because the identity of the amino acid at a site varies across the alignment, the shapes of side chains at sites in the structure were idealized to spheres, here referred to as ‘centroids’. This creates a structure with side-chain sizes and shapes that are a better generalization over all sequences than the specific side chains on the structure corresponding to the homolog that was crystallized. The reference protein structure was used as input to determine for each residue the average position of its side chain atoms (excluding Cα). The centroid of glycine residues was, however, set to the position of its Cα. This average position was set as the centre of the centroid.
Site-rate shift detection. Shifts in site rate are determined in covARES by using BAM filter, or weighted difference of the conditional mode relative rates as per Equation 1:

where ΔRi is the difference in rate at a site i and Ria and Rib are the gamma-distributed rates estimated at this site, respectively, in two subtrees a and b.
Differently evolving sites. covARES scans through the sites of an alignment to detect sites in which the identity of the side chain was absolutely conserved in one subtree, and different in the other. A site that is absolutely conserved in both subtrees but has a different state (or identity) is herein referred to as an absolutely differently evolving (ADE) site. A site that is absolutely conserved with a given state ‘X’ in one subtree, but faster evolving and with a probability of occurrence of PX < 0.2 in the other is referred to as a differently evolving (DE) site. In the latter case, the properties required in the subtree where the state is absolutely conserved are likely unfavourable, if not deleterious, to the function of the same site in the other subtree. These latter sites may or may not correspond to sites with a site-rate shift (‘type I functional divergence’). However, they are highlighted because of the differences in states displayed in subtrees rather than differences in site rate.
Characterization of chemical properties and changes in chemical properties. The chemical properties of a site were expressed as an 8-dimensional normal vector (CP⇀s), where each dimension represents one of eight structural features of side chains. For alignment position S, the vector CP⇀s can be described by Equation 2.
![]()
where the properties vector (CP⇀s) is the vectorial sum of all states i at site S in an alignment. State specific CP⇀s vectors are described in Table 1.
Table 1. Matrix of chemical properties for naturally occurring side chains in protein.
| Side chain | Shorta | Alkylb | Aromatic | Polarc | Acidic | Basic | Dihedrald | Disulfidee |
|---|---|---|---|---|---|---|---|---|
| G | 1 | 0 | 0 | 0 | 0 | 0 | 1 | 0 |
| P | 1 | 1 | 0 | 0 | 0 | 0 | 1 | 0 |
| A | 1 | 1 | 0 | 0 | 0 | 0 | 0 | 0 |
| V | 1 | 1 | 0 | 0 | 0 | 0 | 0 | 0 |
| L | 0 | 1 | 0 | 0 | 0 | 0 | 0 | 0 |
| I | 0 | 1 | 0 | 0 | 0 | 0 | 0 | 0 |
| M | 0 | 1 | 0 | 1 | 0 | 0 | 0 | 0 |
| D | 1 | 0 | 0 | 1 | 1 | 0 | 0 | 0 |
| N | 1 | 0 | 0 | 1 | 0 | 0 | 0 | 0 |
| E | 0 | 1 | 0 | 1 | 1 | 0 | 0 | 0 |
| Q | 0 | 1 | 0 | 1 | 0 | 0 | 0 | 0 |
| S | 1 | 0 | 0 | 1 | 0 | 0 | 0 | 0 |
| SSe | 1 | 0 | 0 | 0 | 0 | 0 | 0 | 1 |
| C | 1 | 0 | 0 | 1 | 0 | 0 | 0 | 0 |
| T | 1 | 1 | 0 | 1 | 0 | 0 | 0 | 0 |
| Y | 0 | 0 | 1 | 1 | 0 | 0 | 0 | 0 |
| F | 0 | 0 | 1 | 0 | 0 | 0 | 0 | 0 |
| W | 0 | 0 | 1 | 0 | 0 | 0 | 0 | 0 |
| H | 0 | 0 | 1 | 1 | 0 | 1 | 0 | 0 |
| K | 0 | 1 | 0 | 1 | 0 | 1 | 0 | 0 |
| R | 0 | 1 | 0 | 1 | 0 | 1 | 0 | 0 |
aSide chain extending from the α-C by three or fewer C–C bonds.
bSide chain that contains an alkyl moiety of three or more consecutive carbon atoms.
cSide chain with a net dipolar moment caused by heteroatoms.
dSide chain that may be recruited for its peculiar effect on backbone dihedral properties.
eExclusive to disulfide bond-forming cysteins.
Comparison between the CP⇀s of two homologous sites can be performed by calculating the vectorial difference of their normal vectors (Equation 3). The length of the resultant vector (Equation 4) will depend on the degree of similarity between the two vectors that are compared (e.g. two vectors having similar components will yield a short resultant vector while vectors with different components will yield a longer resultant vector).

![]()
The value of ΔCPs represents a one-dimensional, relative quantity of difference in side chain structural ‘preference’ between homologous sites found in two subtrees. To assess statistical significance of an observed ΔCPs value at a given site, this value is compared with a distribution of ΔCPs* derived from simulating sites maintaining the same patterns of states (amino acid identities) among taxa but randomly replacing the various states with other amino acids in proportion to the overall frequencies of amino acids in the dataset. A significant difference in chemical properties is detected if the probability of obtaining ΔCPs* ≥ΔCPs is <0.05.
A similar matrix of chemical properties has previously been used to detect nucleotide binding sites on an individual sequence basis (32). However, covARES determines the average vector for all taxa in an alignment and normalizes it, allowing the comparison of homologous sites between two subtrees of different size.
Clustering test (covCLUSTER). The propensity for sites within the same a priori defined subset (e.g. sites with significant ΔCPs rate shifts or similar rates, etc.) to cluster in 3D space was tested using N, the count of all pairs of sites that (i) were in the same subset and (ii) were within a fixed probing distance (varying between 6 and 24 Å) of each other. If there is a tendency to cluster, then N will be larger than if the subset labels were assigned to sites at random in the sequence. The distribution of N under the null hypothesis that there is no tendency to cluster was approximated by the null distribution of 500 N values, each one obtained by permuting the subset labels across all sites. Because N is a count and sites are independent, one can show that N should be approximately normally distributed under the null hypothesis. This was confirmed using histograms and Q-Q plots of the permuted N values. The 500 N values were used to approximate the mean and variance of this normal distribution and a p-value was calculated as the probability, under this distribution, of obtaining values larger than the N observed for the data. Alternatively, covARES also calculates an empirical p-value based on the frequency of random clusters of equal or higher N than the observed data. For instance, Nobserved would be considered significant at an α-level of 0.05, if the frequency of an N of that size or greater in the null distribution is <0.05.
Molecular graphics. Models of proteins were mapped by covARES and were analyzed with VMD v.1.7.1 (33). However, the mapped structure file respects the PDB standard and can be viewed by any molecular graphics software. Final rendering was done using POV-ray v.3.1g.
Preparing input data for covARES
Figure 1 illustrates the flow of data from the input reference structure and the maximum likelihood site-rate estimation to the various applications forming covARES. Each polypeptide chain is treated simultaneously but independently, which allows the co-mapping of complexes of unrelated proteins. A typical input requires a reference PDB file and, for one or more of the polypeptide chain(s), it contains: (i) a multiple sequence alignment and a maximum-likelihood analysis output file (outfile) from Tree-Puzzle 5.0 containing the site-rate information or (ii) two multiple sequence alignments and their corresponding Tree-Puzzle output files representing the two subtrees of a phylogeny to be compared (e.g. eukaryotic versus prokaryotic HMG-CoA reductase, or two paralogous proteins). The output file from covARES contains a variety of information for each site in the alignment(s) in a tabulated format that can be imported into a spreadsheet application or any other analysis package.
Figure 1.

Flow of data using covARES. The bolded boxes indicate some of the applications forming covARES. The user must input a structure file, the alignment and a Tree-Puzzle 5.0 maximum-likelihood output file for one or more of the polypeptide chains present in the PDB file. The application covCHEM allows the definition of a subset of atoms to be used as reference point (e.g. an active site).
RESULTS AND DISCUSSION
Mapping phylogenetic estimated parameters
covARES maps phylogenetically derived information on a molecular model by replacing up to two experimental fields already present in the PDB file: the temperature factor and the occupancy. These parameters can be: site rates, differently evolving sites (DE, ADE or ΔCPs sites), site-rate shifts using either the log difference or the weighted (BAM) difference (Equation 1), neighbouring sites anisotropy (see http://hades.biochem.dal.ca/Rogerlab/christian/NSA.html), visible volume (34), distance from a user-defined subset of atoms (such as a substrate or an interface of molecular contact) or any user-defined parameter.
Structural studies across a phylogenetic dataset are predicated on the assumption that the fold of a known 3D structure of a protein can be generalized to its homolog proteins where segments of the primary sequence are unambiguously aligned. Experimental observations regularly validate this assumption (e.g. ref. 35). covARES excludes the ambiguously aligned sites by outputting them with a different polypeptide chain label. As an extreme case, Figure 2 shows the portions of the structure both with (green/bold) and without (gray/thin) regions of ambiguous alignment between a dataset of 63 eukaryotic enolases, 23 muconate lactonizing enzymes (MLE) and their closely related homologs, chloromuconate cycloisomerase. The ‘gapped’ regions in the alignment correspond generally to loops and sections of the structure where variation in length can be accommodated without affecting the side chain packing of the protein interior.
Figure 2.

Stereogram of gapped regions in the alignment of sequences of eukaryotic enolase versus sequences of MLE (MLE/cMLE) mapped on Hydra vulgaris enolase structure (1PDZ). The green/bold segments of backbone represent the gapped regions or segments of ambiguous homology between the two datasets. The Mn++ ion is represented by a yellow sphere and shown for reference.
Patterns of the rate of evolution
The patterns of slow evolving sites within a mapped protein structure reveal the presence of functional units with a greater degree of evolutionary constraint (3,12). For example, Figure 3 shows that the inner surface of the channel in the rhodopsin-like G-protein-coupled receptors is the most conserved region amongst all sequences in this family. Furthermore, this observation applies specifically to the section of channel that lies on the cytoplasmic side of the cofactor, indicating that only the mechanism of transduction from the cofactor-binding site to the cytoplasmic interface is strongly conserved amongst all members in this Pfam protein family. This is consistent with the structural data indicating a network of interactions along the transmembrane helix bundle (29). Provided a large enough dataset becomes available, the alignment of this family could be split into multiple representative sets corresponding to each of the functionally distinct paralogous rhodopsin-like subfamilies and the site rates re-estimated for each of these subsets. Such analyses could reveal conserved structures specific to a narrower set of paralogs. This approach of breaking datasets into functionally distinct subsets is presented in a later section for the HMG-CoA reductase family.
Figure 3.

Site-rate map of the 7 trans-membrane rhodopsin-like G-protein receptor. The site rates are color coded from slow (blue) to fast (red) evolving on the bovine retinal rhodopsin [PDB: 1F88 (29)]. The left panel represents a view from the cytoplasmic side of the membrane while the right panel shows the cytoplasmic end of the protein to the right. Grayed backbone segments indicate the homology of these segments could not be unambiguously determined due to the presence of gaps in the alignment. The molecule of 11-cis-retinal is shown in yellow.
Previous reports agree that buried sites in a protein tend to evolve more slowly (3,4), but most of these analyses have been restricted to globular enzymes (4). Interestingly, the mapping of evolutionary rates on the α-/β-tubulin dimer indicates the opposite pattern. As shown on Figure 4, the relative rates of evolution at sites within the core of the tubulin proteins are faster than the rates of sites at the surface. The multitude of intermolecular interactions between tubulins and other proteins are apparently restraining the identities of sites at the surface relative to the constraints imposed by side-chain packing within the core of the proteins. This is consistent with the common assumption that co-evolution of many interacting proteins leads to a high degree of sequence constraint in the proteins where the interactions occur.
Figure 4.
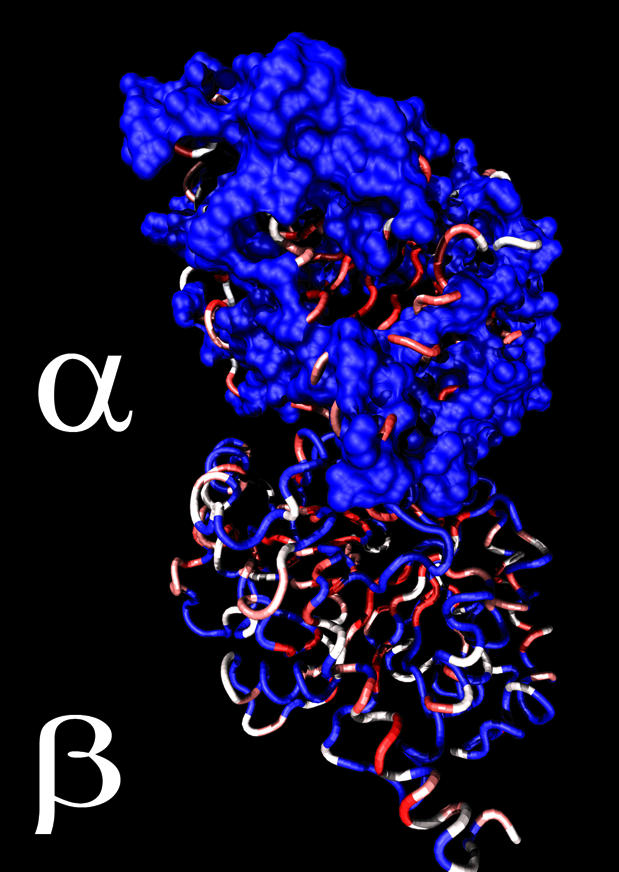
Site-rate map of the α- and β-tubulin heterodimer. The site rates are color coded from slow (blue) to fast (red) evolving on the dimeric bovine tubulin structure. The sites assigned to the slowest rate category were rendered as a molecular surface to demonstrate that the slow evolving sites are found at the surface of the protein.
Site-rate mapping can similarly be used to delineate essential binding functions of proteins. For instance, we have used rate mapping to better characterize the stop-codon binding region of eRF1 (11) and to determine whether genes coding for HBS1 and eRF3 are interacting with homologs of eF1β and tRNAs (Inagaki, Blouin, Susko and Roger, unpublished).
HMG-CoA reductase test case
By mapping the site rates of bacterial class II HMG-CoA reductase on the Pseudomonas mevalonii structure, it is clear that the proximity to the active site is an important factor determining the evolutionary constraints of this protein (Fig. 5A). This observation agrees with recent work addressing the nature of such constraints in enzyme systems (3,4). Using regression analyses, ASA and the distance from the catalytic center have been shown to be significant explanatory factors of the site-rate distribution in the enzyme isocitrate dehydrogenase (4). However, it is unclear which of the apparently relevant factors influencing evolutionary rates are truly independent of other factors. covARES offers an output that allows one to evaluate structural and phylogenetic data jointly. An in-depth analysis of these structural determinants of site rates and site-rate shifts for the glycolytic enzyme enolase will be presented elsewhere (Blouin, Susko and Roger unpublished).
Figure 5.

(A) Mapping of site rates and DE sites in P.mevalonii HMG-CoA. A stereogram of relative evolutionary site rates in bacterial HMG-CoA reductase as mapped on the P.mevalonii structure (1QAX). Only the unmasked segments are displayed. The site rates are color coded from blue (slowest) to red (fastest). The substrate HMG-CoA and the cofactor NAD+ are represented as a yellow molecular surface and were successfully co-crystallized in only one of the two active sites. The other active site is located around the lower cluster of slow evolving residues. (B) The distribution of DE sites between bacterial class I and class II HMG-CoA reductase. Type II functionally divergent sites are mapped on the P.mevalonii structure (1QAX) showing the substrate HMG-CoA and cofactor NAD+ (yellow) and the backbone trace of the homodimer. ADE sites, DE sites and sites for which significant differences in chemical properties (ΔCPs) were detected are displayed in their respective panels. These residues wrap around the substrate/cofactor binding sites and influence the environment of the catalytic site, but are not part of it.
Comparison of two orthologous datasets
Phylogenetic information can be used to probe areas of a protein for functional divergence amongst protein family members. To do this, a dataset of sequences is split into two or more subsets where functional difference is expected a priori or is being tested, and these are compared on a site-by-site basis. If a site is part of a functional group in only one of the subsets, it is expected that the unused site will change more often during evolutionary time, and thus have a larger relative rate. Change in site rate has been used to detect the differential presence of function in homologous proteins in our group (11) and by other workers (8,9,15,18,36). However, not all kinds of functional divergence will manifest in changed site rates.
The comparison of the class I HMG-CoA reductase (HMGR) of Archaea and the class II HMGR from Eubacteria suggests that the difference in catalytic properties between these two homologous classes may be caused by a difference in the environment of the active site residues. Figure 5B shows how differently evolved sites (DE and ADE sites) are located along the substrate and cofactor binding sites. As HMG-CoA is a homodimer, two of these clusters of ‘functional shifts’ are present in the structure, although only one has the co-crystallized substrate and cofactor. Most of these differently evolving residues are part of the second shell of catalytic residues (i.e. these residues interact with the catalytic residues), and therefore determine the physical properties of the catalytic site. Finally, the chemical properties vector (CPs) was determined for each site in both subtrees. Sites with statistically significant (p < 0.05) ΔCPs between the archaeal class I and class II HMG-CoA reductase were mapped in the P.mevalonii structure (Fig. 5B). As with the DE sites, these sites also form part of the cluster of sites in which the catalytic residues are embedded (Fig. 5B). Amongst these shifts, there is an increased polarity assigned to secondary positions surrounding the active site in the class II enzymes. These positions, such as 785 (as named in structure 1QAX) and 364, are sufficiently close to the active site to influence the electrostatic context of the catalytic side chains 83 and 271. There is also a pair of functionally divergent sites behind the nicotinamide ring, which have an increased polarity in the class II enzyme. These electrostatic differences may account for the differential discrimination of cofactors between the classes, and why the class II enzymes possess both anabolic and catabolic activities while the class I enzymes do not (37). Furthermore, the differently evolved sites may also correlate with the differential sensitivity of the class I and class II HMG-CoA reductases to a variety of statin compounds (38,39). These methods highlight changes in structural preferences at sites. The notion of a network in this particular case refers to a set of amino acid positions proximal to the active site and cofactor binding regions that need not directly interact but instead influence the electrostatic environment of the active site and may alter the energetic profile of the catalysis performed in the two classes.
A survey of these residues offers a pertinent source of information regarding what differs between two or more classes of related enzymes. The effect of these residues may not be directly observable in a single structure, but their influence may have left a trace that can be detected across a large number of functionally similar but evolutionarily divergent sequences. It highlights not only catalytic/ substrate-binding residues but also the other members of the network of interactions that connect the catalytic side chains to the protein matrix. The possibility that the set of residues forming the putative network were randomly spaced across the structure and not truly clustered was tested with the covCLUSTER test, and was rejected at an extreme level of significance (p-value < 1E–16). Clearly these residues are tightly clustered and likely co-evolved to provide a different protein context for the active site residues, the substrate and the cofactor binding pockets. Without comparative analyses, identification of such sites involved in functional changes by systematic site-directed mutagenesis surveys would be a prohibitively laborious endeavor, with no guarantee of success. Thus, our comparative analyses have the potential to drastically reduce the number of potential functionally significant sites in a protein to test experimentally.
Interestingly, the presence of differently evolving sites is not merely attributable to ancient divergence in protein families, but rather it does seem to specifically implicate functional change in subtrees. For instance, a comparison of enolase from bacteria and eukaryotes, where no significant changes in biological activities are expected (i.e. they are known to perform identical activity in both subtrees), revealed very few (<5 amongst 434 aligned sites) sites with significant ΔCPs values (C.Blouin and A.J.Roger, unpublished).
Other methods of site-rate shift detection
A number of methods directly addressing the detection of changes in rates-across-sites within a tree have emerged recently [16,17 (implemented in DIVERGE, 22),20,40]. The output of any of these methods can be mapped on a reference structure with covARES using the editable fields reserved for each site. covARES provides two built-in weighted site-rate difference measures: the BAM ‘difference’s (Equation 1) and a simple difference in log-transformed rates measure (see also 18). However, since no errors are provided on these estimates, the statistical significance of these two rate-shift measures should be treated with caution, especially for small rate differences.
CONCLUSION
There is little doubt that relationships exist between relative evolutionary site rates, divergent evolution and the structure/function of proteins. However, the scope and generality of these relationships remain poorly understood. The study of evolutionary patterns in 3D is providing new insights into the processes of phylogenetic divergence in proteins as well as the properties of proteins themselves. covARES serves both functions by providing evolutionary and structural parameter mapping and analysis tools that can help investigators harness the vast information provided by rapidly increasing volumes of comparative sequence and structural data.
Acknowledgments
ACKNOWLEDGEMENTS
C.B. thanks NSERC for post-doctoral fellowship support. A.J.R. thanks the Canadian Institute for Advanced Research for fellowship support. This work was supported by NSERC Genomics Grant 228263-99, NSERC Operating Grant 227085-00 and Genome Atlantic/Genome Canada.
REFERENCES
- 1.Lio P., Goldman,N., Thorne,J.L. and Jones,D.T. (1998) PASSML: combining evolutionary inference and protein secondary structure prediction. Bioinformatics, 14, 726–733. [DOI] [PubMed] [Google Scholar]
- 2.Blouin C. and Wallace,C.J.A. (2001) Protein matrix and dielectric effect in cytochrome c. J. Biol. Chem., 276, 28814–28818. [DOI] [PubMed] [Google Scholar]
- 3.Goldman N., Thorne,J.L. and Jones,D.T. (1998) Assessing the impact of secondary structure and solvent accessibility on protein evolution. Genetics, 149, 445–458. [DOI] [PMC free article] [PubMed] [Google Scholar]
- 4.Dean A.M. and Golding,G.B. (2000) Enzyme evolution explained (sort of). Pac. Symp. Biocomput., 6–17. [DOI] [PubMed] [Google Scholar]
- 5.Pollock D.D., Taylor,W.R. and Goldman,N. (1999) Coevolving protein residues: maximum likelihood identification and relationship to structure. J. Mol. Biol., 287, 187–198. [DOI] [PubMed] [Google Scholar]
- 6.Wollenberg K.R. and Atchley,W.R. (2000) Separation of phylogenetic and functional associations in biological sequences by using a parametric bootstrap. Proc. Natl Acad. Sci. USA, 97, 3288–3291. [DOI] [PMC free article] [PubMed] [Google Scholar]
- 7.Pazos F., Helmer-Citterich,M., Ausiello,G. and Valencia,A. (1997) Correlated mutations contain information about protein–protein interaction. J. Mol. Biol., 271, 511–523. [DOI] [PubMed] [Google Scholar]
- 8.Jordan I.K., Bishop,G.R. and Gonzalez,D.S. (2001) Sequence and structural aspects of functional diversification in class I α-mannosidase evolution. Bioinformatics, 17, 965–976. [DOI] [PubMed] [Google Scholar]
- 9.Wang Y. and Gu,X. (2001) Functional divergence in the caspase gene family and altered functional constraint: statistical analysis and prediction. Genetics, 158, 1311–1320. [DOI] [PMC free article] [PubMed] [Google Scholar]
- 10.Archibald J.M., Blouin,C. and Doolittle,W.F. (2001) Gene duplication and the evolution of group II chaperonins: implication for structure and function. J. Struct. Biol., 135, 157–69. [DOI] [PubMed] [Google Scholar]
- 11.Inagaki Y., Blouin,C., Doolittle,F.W. and Roger,A.J. (2002) Convergence and constraints in eRF1 domain: the evolution of stop codon specificity. Nucleic Acids Res., 30, 532–544. [DOI] [PMC free article] [PubMed] [Google Scholar]
- 12.Pupko T, Bell,R.E., Mayrose,I., Glaser,F. and Ben-Tal,N. (2002) Rate4Site: an algorithmic tool for the identification of functional regions in proteins by surface mapping of evolutionary determinants within their homologues. Bioinformatics, 18, S71–S77. [DOI] [PubMed] [Google Scholar]
- 13.Yang Z. (1996) Among-site rate variation and its impact on phylogenetic analyses. Trends Ecol. Evol., 11, 367–372. [DOI] [PubMed] [Google Scholar]
- 14.Simon A.L., Stone,E.A. and Sidow,A. (2002) Inference of functional regions in proteins by quantification of evolutionary constraints. Proc. Natl Acad. Sci. USA, 99, 2912–2917. [DOI] [PMC free article] [PubMed] [Google Scholar]
- 15.Gaucher E.A., Miyamoto,M.M., Benner,S.A. (2001) Function-structure analysis of proteins using covarion-based evolutionary approaches: elongation factors. Proc. Natl Acad. Sci. USA, 98, 548–552. [DOI] [PMC free article] [PubMed] [Google Scholar]
- 16.Gu X. (1999) Statistical Methods for testing functional divergence after gene duplication. Mol. Biol. Evol., 16, 1664–1674. [DOI] [PubMed] [Google Scholar]
- 17.Gu X. (2001) Maximum-likelihood approach for gene family evolution under functional divergence. Mol. Biol. Evol., 18, 453–464. [DOI] [PubMed] [Google Scholar]
- 18.Gaucher E.A., Gu,X., Miyamoto,M.M. and Benner,S.A. (2002) Predicting functional divergence in protein evolution by site-specific rate shifts. Trends Biochem. Sci., 27, 315–321. [DOI] [PubMed] [Google Scholar]
- 19.Pupko T. and Galtier,N. (2002) A covarion-based method for detecting molecular adaptation: application to the evolution of primate mitochondrial genomes. Proc. R. Soc. Lond. B. Biol. Sci., 269, 1313–1316. [DOI] [PMC free article] [PubMed] [Google Scholar]
- 20.Susko E., Inagaki,Y., Field,C., Holder,M.E. and Roger,A.J. (2002) Testing for differences in rates-across-sites distributions in phylogenetic subtrees. Mol. Biol. Evol., 19, 1419–1423. [DOI] [PubMed] [Google Scholar]
- 21.Armon A., Graur,D. and Ben-Tal,N. (2001) ConSurf: An algorithmic tool for the identification of functional regions in proteins by surface mapping of phylogenetic information. J. Mol. Biol., 307, 447–463. [DOI] [PubMed] [Google Scholar]
- 22.Gu X. and Vander Velden,K. (2002) DIVERGE: phylogeny-based analysis for functional-structural divergence of a protein family. Bioinformatics, 18, 500–501. [DOI] [PubMed] [Google Scholar]
- 23.Altschul S.F., Madden,T.L., Schäffer,A.A., Zhang,J., Zhang,Z., Miller,W. and Lipman,D.J. (1997) Gapped BLAST and PSI-BLAST: a new generation of protein database search programs. Nucleic Acids Res. 25, 3389–3402. [DOI] [PMC free article] [PubMed] [Google Scholar]
- 24.Duquerroy S., Camus,C. and Janin,J. (1995) X-ray structure and catalytic mechanism of lobster enolase. Biochemistry, 34, 12513–12523. [PubMed] [Google Scholar]
- 25.Hoier H., Schlomann,M., Hammer,A., Glusker,J.P., Carrell,H.L., Goldman,A., Stezowski,J.J. and Heinemann,U. (1994) Crystal-structure of chloromuconate cycloisomerase from alcaligenes-eutrophus JMP134 (pJP4) at 3 Å resolution. Acta Crystallogr. D, 50, 75–78. [DOI] [PubMed] [Google Scholar]
- 26.Gigant B., Curmi,P.A., Martin-Barbey,C., Charbaut,E., Lachkar,S., Lebeau,L., Siavoshian,S., Sobel,A. and Knossow,M. (2000) The 4 A X-ray structure of a tubulin:stathmin-like domain complex. Cell, 102, 809–816. [DOI] [PubMed] [Google Scholar]
- 27.Tabernero L., Bochar,D.A., Rodwell,V.W. and Stauffacher,C.V. (1999) Substrate-induced closure of the flap domain in the ternary complex structures provides insights into the mechanism of catalysis by 3-hydroxy-3-methylglutaryl-CoA reductase. Proc. Natl Acad. Sci. USA, 96, 7167–7171. [DOI] [PMC free article] [PubMed] [Google Scholar]
- 28.Bateman A., Birney,E., Cerruti,L., Durbin,R., Etwiller,L., Eddy,S.R., Griffiths-Jones,S., Howe,K.L., Marshall,M. and Sonnhammer,E.L.L. (2002) The Pfam protein families database. Nucleic Acids Res., 30, 276–280. [DOI] [PMC free article] [PubMed] [Google Scholar]
- 29.Palczewski K., Kumasaka,T., Hori,T., Behnke,C.A., Motoshima,H., Fox,B.A., Le Trong,I., Teller,D.C., Okada,T., Stenkamp,R.E., Yamamoto,M. and Miyano,M. (2000) Crystal structure of rhodopsin: A G protein-coupled receptor, Science, 289, 739–745. [DOI] [PubMed] [Google Scholar]
- 30.Higgins D.G., Thompson,J.D. and Gibson,T.J. (1996) Using CLUSTAL for multiple sequence alignments. Methods Enzymol., 266, 383–402. [DOI] [PubMed] [Google Scholar]
- 31.Strimmer K., and von Haeseler,A. (1996) Quartet puzzling: A quartet maximum likelihood method for reconstructing tree topologies. Mol. Biol. Evol., 13, 964–969. [Google Scholar]
- 32.Bork P. and Grunwald,C. (1990) Recognition of different nucleotide-binding sites in primary structures using a property-pattern approach. Eur. J. Biochem., 191, 347–358. [DOI] [PubMed] [Google Scholar]
- 33.Humphrey W.F. Dalke,A. and Schulten,K. (1996) VMD—Visual Molecular Dynamics. J. Mol. Graph., 14, 33–38. [DOI] [PubMed] [Google Scholar]
- 34.LoConte L. and Smith,T.F. (1997) Visible volume: a robust measure for protein structure characterization. J. Mol. Biol., 273, 338–348. [DOI] [PubMed] [Google Scholar]
- 35.Copley R.R. and Bork,P. (2000) Homology among (βα)8 barrels: implications for the evolution of metabolic pathway. J. Mol. Biol., 303, 627–641. [DOI] [PubMed] [Google Scholar]
- 36.Penny D., McComish,B.J., Charleston,M.A. and Hendy,M.D. (2001) Mathematical elegance with biochemical realism: the covarion model of molecular evolution. J. Mol. Evol., 53, 711–723. [DOI] [PubMed] [Google Scholar]
- 37.Kim D.Y., Stauffacher,C.V. and Rodwell,V.W. (2000) Dual enzyme specificity of Archaeoglobus fulgidus HMG-CoA reductase. Protein Sci., 9, 1226–1234. [DOI] [PMC free article] [PubMed] [Google Scholar]
- 38.Boucher Y. and Doolittle,F.W. (2000) The role of lateral gene transfer in the evolution of isoprenoid biosynthesis pathway. Mol. Microbiol., 37, 703–716. [DOI] [PubMed] [Google Scholar]
- 39.Istvan E.S. and Deisenhofer,J. (2001) Structural mechanism for statin inhibition of HMG-CoA reductase. Science, 292, 1160–1164. [DOI] [PubMed] [Google Scholar]
- 40.Knudsen B. and Miyamoto,M.M. (2001) A likelihood test for evolutionary rate shifts and functional divergence among proteins. Proc. Natl Acad. Sci. USA, 98, 14512–14517. [DOI] [PMC free article] [PubMed] [Google Scholar]