

Abstract
Photon echo spectroscopy has been used to measure the response of three antibody-binding sites to perturbation from electronic excitation of a bound antigen, fluorescein. The three antibodies show motions that range in time scale from tens of femtoseconds to nanoseconds. Relative to the others, one antibody, 4-4-20, possesses a rigid binding site that likely results from a short and inflexible heavy chain complementarity-determining region 3 (HCDR3) loop and a critical Tyr that acts as a “molecular splint,” rigidifying the antigen across its most flexible internal degree of freedom. The remaining two antibodies, 34F10 and 40G4, despite being generated against the same antigen, possess binding sites that are considerably more flexible. The more flexible combining sites likely result from longer HCDR3 loops and a deletion in the light chain complementarity-determining region 1 (LCDR1) that removes the critical Tyr residue. The binding site flexibilities may result in varying mechanisms of antigen recognition including lock-and-key, induced-fit, and conformational selection.
The optimization of protein-based molecular recognition may require significant conformational adjustments of the participating proteins, ligands, or substrates. Several models of molecular recognition have been proposed that are differentiated by the role of flexibility. The “lock-and-key” model, where no structural optimization of the binding partners is required, presumes that the molecules have a geometry appropriate for tight binding (1). However, there is a growing consensus that protein flexibility may be required for optimal molecular recognition. As a result, two alternatives to the lock-and-key mechanism explicitly consider molecular flexibility. The original model that evoked flexibility, known as “induced fit,” posits that after the initial formation of an unoptimized complex, the molecules structurally reorganize to optimize binding interactions (2). A related model, “conformational selection,” hypothesizes that a small fraction of molecules exists transiently in appropriate geometries before binding (3). Although induced-fit and conformational selection evoke fluctuations that occur before or after initial complex formation, they both are differentiated from the lock-and-key model by the important role played by protein flexibility. Flexibility may also play an important role in binding specificity, because structurally distinct protein conformations are expected to facilitate the binding of structurally distinct molecules. The importance of flexibility in the affinity and specificity of molecular interactions is nowhere more obvious than in the humoral immune system, where a limited set of proteins (antibodies, Abs) must bind a virtually unlimited range of foreign molecules (i.e., small-molecule antigens, Ags). It has been suggested that the immune system may accomplish this task by using a limited set of flexible Abs that may bind a wide range of Ags (4, 5). Experiments that measure Ab and Ag flexibility would be interesting not only from a biophysical perspective but should also contribute to an understanding of molecular recognition.
There is no simple relationship between protein flexibility and the average structure, observable by x-ray crystallography (5–7), or necessarily the thermal fluctuations about the average structure as determined by NMR spectroscopy (8–10). The most pertinent information is available from crystallographic Debye–Waller factors (11) or from NMR order parameters (10). However, these techniques only report amplitudes, and it is not trivial to extract the frequencies of the associated motions. A simple and more intuitive view of flexibility would follow from examining how a protein responds to an applied force (12–14). For example, a flexible protein will respond to a given force with large amplitude, low-frequency motions, whereas a more rigid protein is expected to respond to a similar force with smaller amplitude, higher-frequency motions. The large amplitude vibrations are the protein motions underlying the flexibility important to the induced-fit and conformational selection models. Characterization of the protein response to an applied force, in terms of energies, frequencies, and amplitudes, is now possible with a combination of biology and spectroscopy.
An appropriate chromophoric Ag may be used to elicit specific and high-affinity Abs from an organism such as a mouse. A step-function force is applied to the protein after an excitation-induced change in Ag charge distribution and structure, which results in an Ab–Ag complex that is out of equilibrium. The Ab combining site will respond to the force with protein motions that reestablish equilibrium with the excited chromophore. The induced protein motions will affect the electronic transition frequency of the chromophore. The frequency distribution of these motions may be written as a spectral density, ρ(ω), which describes the amplitude of fluctuations as a function of frequency, ω. Thus, ρ(ω) provides a complete description of the protein response to the optically induced force and therefore may be used to quantitate the flexibility of the Ab combining site.
Over the last three decades, several time-resolved optical techniques for determining ρ(ω) have been developed. Femtosecond nonlinear spectroscopies such as three-pulse photon echo peak shift (3PEPS) spectroscopy proven to be especially useful (15–17). The experimentally observable decay of the photon echo peak shift is known to reflect the time scales and amplitudes of M(t), the time domain representation of ρ(ω) (17). Recently, 3PEPS was used to characterize the dynamics of an Ab complex with the rigid chromophore 8-methoxypyrene-1,3,6-trisulfonate (MPTS) (15). It was suggested that a comparison of ρ(ω) for multiple Ab complexes with the same Ag would quantitate protein flexibility, and that such data would be useful for understanding the relative contributions of lock-and-key versus induced-fit or conformational selection mechanisms to molecular recognition.
In this study, the combining-site dynamics of three Abs that bind fluorescein (Fl) (Fig. 1) have been characterized. The proteins studied include Ab 4-4-20, which has been characterized structurally (18, 19). The combining-site reorganization energies of the Ab–Fl complexes are calculated from the steady-state spectra, and the 3PEPS experiment is used to determine the time scales of the motions in each complex. Protein and Ag motions, ranging in time scale from tens of femtoseconds to hundreds of picoseconds, were observed. The Abs are found to have combining sites with different flexibilities, and the molecular origins of these differences are discussed in terms of the available structure and sequence information. Ab initio quantum-chemistry calculations of the chromophore were used to predict the electronic and structural effects of excitation, which was used along with the 4-4-20 structure, to better understand the structural origins of the observed protein dynamics.
Figure 1.

(Upper) Contour plot showing structural and electron-density differences between S1 and S0 electronic states. The red contours indicate higher density in S0, whereas gold contours indicate a higher electron density in S1. The purple spheres show the atomic positions in S0, and red spheres show positions in S1. (Lower) HF and CIS optimized energies for values of the dihedral angle defining the angle between the carboxyphenyl ring plane and the xanthene plane (the dihedral angle is defined by atoms 8, 7, 21, and 22).
Materials and Methods
Experimental Methods.
mAbs 34F10 and 40G4 were produced and purified from hybridoma supernatants by standard methods (20). mAb 4-4-20 ascites was kindly provided by Edward Voss (University of Illinois, Urbana-Champaign). The Abs were cloned and sequenced by standard protocols (21). The ultrafast laser source used in these measurements was as described (15), and only significant differences are described here. A 5-kHz repetition rate Ti:sapphire regenerative amplifier and optical parametric amplifier were used. The 510-nm excitation pulses were generated by mixing the pump beam (800 nm) with the signal beam (1,407 nm) in a type I BBO crystal. These pulses were separated from the fundamentals with a dichroic mirror and compressed by double-passing a pair of fused silica prisms. Autocorrelations and determination of zero delay were performed by replacing the sample cell with a 0.4-mm type I BBO crystal and measuring the second harmonic intensity. Autocorrelation widths of 60 fs, corresponding to pulse widths of 45 fs (Gaussian pulses assumed), were measured. The time-bandwidth product of the pulses was 0.55. Pulse energies of 2–10 nJ per beam were used. Pulse energies of >20 nJ per beam had no effect on the shape of the signals. 3PEPS experiments were performed as described (15).
Computational Methods.
Modeling of 3PEPS data.
The response function formalism for calculating spectroscopic properties of a molecular system from a model of the nuclear dynamics has been described extensively in the literature (16), thus only a brief summary is given here. The system is modeled with a ground state (S0) and a single excited electronic state (S1) coupled to a harmonic bath. In this model fluctuations are probed by following the decay of coherence created within the two-level system by light-matter interactions.
The spectral density, ρ(ω), characterizes the frequency distribution of vibrations coupled to the S0-to-S1 electronic transition. The spectral density is a sum of both solvent or protein fluctuations and chromophore vibrations. The relative weight of each contribution is scaled by its reorganization energy, λ, and its coupling strength, 〈Δ2〉.
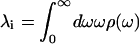 |
1 |
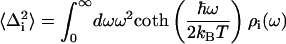 |
2 |
Spectral dynamics of the system are contained within the line-broadening function, g(t), which may be calculated from ρ(ω) by the expression
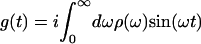 |
3 |
 |
in which Δin is the inhomogeneous broadening, kB is the Boltzmann constant, and T is the absolute temperature. Signals for the various time-resolved experiments such as transient absorption, transient grating, or 3PEPS as well as steady-state absorption spectra may be calculated from g(t) by using standard procedures (16).
Quantum-mechanical calculation of Fl vibrations.
Ab initio calculation of the chromophores' vibrational frequencies and excitation-induced displacements may be used to calculate ρFl(ω). GAUSSIAN 98 was used to calculate the ground electronic-state geometry and normal modes of vibration (HF/6-31G*) as well as the excited-state geometry (CIS/6-31G*). Each ring system of the chromophore was constrained to be planar in both the ground and excited states. The interannular bond between the xanthene and phenyl rings was set to 71°, as observed in the 4-4-20 structure (18, 19). Displacements, Δj, were found by projecting the changes in bond lengths onto the normal mode vectors (22). The reorganization energy for each vibration j, λj, was determined from Δj and the normal mode frequency, ωj (λj = 1/2ωjΔ ). The calculated frequencies were scaled by 0.9. The frequencies and reorganization energies then were used to calculate ρFl(ω) (Fig. 6, which is published as supporting information on the PNAS web site, www.pnas.org). Ab initio calculation of Fl electrostatics were performed at the DZV(2d,p) level of theory, and density difference analysis was performed with qmview software (23).
Results
3PEPS Data.
3PEPS data for Fl bound to the three Abs are shown in Fig. 2, and parameters from exponential fits are collected in Table 1. The initial peak shifts and fastest decay times are all similar. However, the amplitude of the fastest and slowest dynamics are different for each Ab. Each Ab had a 3- to 5-ps decay component of similar amplitude and leveled off by T ≈ 10 ps to distinctly different nonzero asymptotic values. The value of the asymptotic peak shift was largest for Ab 4-4-20 and smallest for Ab 34F10. The asymptotic values indicate the presence of slow (>3-ns) time-scale protein dynamics in the three Abs.
Figure 2.

3PEPS data for Fl in Abs 34F10 (squares), 40G4 (circles), and 4-4-20 (triangles). (Inset) Absorption spectra of Fl in Abs 34F10 (solid line), 40G4 (dashed line), and 4-4-20 (dotted line).
Table 1.
Parameters of multiexponential fits to 3PEPS data
| Sample | A1, fs | τ1, fs | A2, fs | τ2, ps | A3, fs |
|---|---|---|---|---|---|
| 34F10 | 15.7 | 34 | 1.5 | 2.9 | 1.0 |
| 40G4 | 15.4 | 32 | 1.8 | 2.7 | 1.4 |
| 4-4-20 | 14.7 | 35 | 1.3 | 5.0 | 2.0 |
3PEPS Modeling.
A model spectral density was constructed that reproduced both the 3PEPS decay and the absorption spectra within the constraint of the total reorganization energy. The Ag spectral density ρFL(ω) was scaled to give λFL = 484 cm−1 in each Ab, and only modes with ω > 250 cm−1 were included (such modes would have appeared as oscillations in the 3PEPS decay data). The fastest dynamics in each 3PEPS decay was modeled with a Gaussian contribution to the spectral density. The 3- to 5-ps decay for each Ab was modeled with a Lorentzian component in ρAb(ω). The asymptotic value of the peak shift for each Ab was modeled as inhomogeneous broadening (i.e., the value of Δin in Eq. 3 was varied). The reorganization energies of the Gaussian and Lorentzian components and the value of Δin were varied until the best fits to the 3PEPS decay and the absorption spectrum were achieved. The values of the parameters used to construct the ρAb(ω) are collected in Table 2, and comparisons of modeled 3PEPS decays and absorption spectra with the data are shown in Fig. 3. The spectral densities are shown in Fig. 3D. Values of Δin are converted to reorganization energies by assuming that they represent vibrations in the low temperature limit (λ = h〈Δ 〉/2kT). The values of λAb are thus 352 cm−1 for 34F10, 264 cm−1 for 40G4, and 224 cm−1 for 4-4-20. The simulated absorption spectra are in excellent agreement with those observed experimentally. The simulated 3PEPS decays are also in good agreement with the experimental data. The largest discrepancies occur in the T < 100 fs regime, most likely due to non-Gaussian experimental pulses. It is difficult to assign errors to these values, because they result from a model, not from a fit of the data. However, we note that small changes in the values, 5 cm−1 for λ and Δin, 25% for τG, and 10% for τKubo, resulted in large changes in the calculated peak shift. It therefore is assumed that the errors are somewhat less.
Table 2.
Parameters for ρAb(ω)a
| Sample | λG, cm−1 | τG, fs | λKubo, cm−1 | τKubo, fs | Δin, cm−1 |
|---|---|---|---|---|---|
| 34F10 | 220 | 40 | 70 | 3,000 | 160 |
| 40G4 | 160 | 40 | 50 | 3,000 | 150 |
| 4-4-20 | 140 | 40 | 30 | 5,000 | 150 |
Figure 3.

(A–C) 3PEPS data (circles) and simulated decays (lines) calculated from the model spectral densities. (Insets) Measured (circles) and simulated (lines) absorption spectra. (D) Model spectral densities ρAb(ω) for Fl in Abs 34F10 (triangles), 40G4 (circles), 4-4-20 (squares), and MPTS in Ab 6C8 (solid stars). The parameters for constructing ρAb(ω) are given in Table 3, which is published as supporting information on the PNAS web site.
Some differences between the model and the data may result from an Ab-dependent ρFl(ω), possibly due to varying Fl conformation in each Ab-binding site. This would also result in different ρFl(ω) for each Ab. However, this is unlikely to be a large effect, because both the absorption spectra and 3PEPS data for each Ab are well modeled with a single ρFl(ω). Resonance Raman experiments would provide further insight into any binding-induced changes in the Ag vibrational structure.
Discussion
An important role for protein flexibility has been widely evoked in the literature but has been more difficult to characterize experimentally. The strategy of eliciting Abs to suitably chosen chromophores, along with their spectroscopic characterization, allows for a quantitative analysis of the flexibility of a biologically relevant complex. Because the combining-site conformation is optimized for the electronic and geometric structure of the Ag ground-electronic state, and the Ag is optically excited to an electronic state with a different electronic and geometric structure, the Ab–Ag interactions are no longer optimal after excitation. The combining site is then under a set of forces that results in structural rearrangement until equilibrium with the new excited-state charge distribution and geometry is achieved. The protein vibrations that respond to these forces, as with any vibrations, may be characterized in terms of their energies and frequencies. The total energy of the vibrational displacements may be calculated from the steady-state optical spectra. The partitioning of the total energy into individual protein motions and the frequencies of those motions are available from the 3PEPS experiment. This combination of immunology and spectroscopy permits a detailed description of the Ag and protein motions and provides a quantitative basis for comparing the flexibilities of Abs that bind the same Ags.
Ag Photophysics and Dynamics: The Forces Delivered to the Protein.
Electronic excitation of Fl causes changes in the chromophore electronic distribution and geometry. We used computational techniques to examine both the instantaneous electronic change and structural reorganization. Electronic-density difference maps were used to display the effects of excitation (Fig. 1; ref. 23). The gold contours represent an increase in electron density after excitation. The charge-density difference surfaces indicate a movement of density away from both the phenolic oxygen atoms into the central xanthene ring. The largest charge differences are localized to the central ring, especially at the carbon bonded to the phenyl ring and the two neighboring xanthene atoms. The associated bonds also show a slight lengthening (≈0.04–0.025 Å) after excitation. Despite these changes there is not an accompanying large change in dipole moment (11.4 and 11.6 Debye units for the ground state and excited state, respectively) due to approximate symmetry. This result is consistent with a study of solvent polarity effects on the spectra of Fl that observed a weak correlation between solvent polarity and Stokes shift (24). In contrast, a strong correlation was found between Stokes shift and Kamlet–Taft (hydrogen-bond strength) parameters (24). The blue shift of the Fl absorption spectrum with increasingly strong hydrogen-bond-donating solvents indicates that hydrogen-bonding is weaker in the excited state than in the ground state. This result is consistent with a loss of charge of ≈0.0015–0.007 electron at each of the xanthene phenolic oxygen atoms and the subsequent decrease in hydrogen-bond strength after excitation.
Unconstrained geometry optimization of the Fl ground state predicts a perpendicular arrangement of the two rings regardless of protonation state of the carboxyl moiety. The energetics of this motion were explored by performing a series of excited-state geometry optimizations as a function of fixed phenyl ring angle (Fig. 1). The geometry that is observed in the crystal structure, showing a 71° dihedral angle between the rings, must result from interactions with the Ab. Therefore, in the ground state, the angle results from a compromise between the Ag and the Ab, i.e., the Ab applies a force along this coordinate that is resisted by Ag with the final structure resulting from an equilibrium between these two forces. The potential-energy scan shows that after photoexcitation, the initially constrained rotation about the interannular bond becomes nearly free in the excited state. Photoexcitation will result in loss of the ground-state equilibrium and rotation of the phenyl ring about the interanular bond. The structural changes that result from excitation are therefore localized to motion of the phenyl ring relative to the xanthene ring.
Ab Dynamics: Protein Response to the Optically Induced Force.
ρAb(ω) is a plot of the amplitude of protein motions as a function of frequency. The spectral densities reveal that each Ab responds to Ag excitation with ultrafast motion (<40 fs) as well as 3- to 5-ps and >3-ns time-scale motion. However, from a comparison of the ρAb(ω) (Fig. 3D), it is immediately apparent that there are significant differences in the amplitudes of these motions. The largest differences involve the amplitude of the highest-frequency (fastest time scale) motions, which is largest in 34F10, intermediate in 40G4, and smallest in 4-4-20. Relaxation on the sub-100-fs time scale is usually thought to be due to small-amplitude rotational and librational motions of solvent or protein. For example, the sub-50-fs response of water accounts for >60% of the total reorganization energy of small dipolar solutes. 34F10 has the largest amplitude of fast dynamics, meaning that the fast motions within the combining site are most capable of readjusting to accommodate the new electronic and geometrical structure of the Ag. The fastest motions of Ab 4-4-20, again presumably resulting from solvent or side-chain vibrations, are the least able to respond to the optically induced force.
The crystal structure of Ab 4-4-20 shows that only two water molecules specifically interact with the chromophore: one through the xanthene oxygen and one through the carboxylate. Two water molecules are unlikely to be sufficient for the amplitude of the observed response (25). Moreover, the larger amplitude of the inertial response in 34F10 and 40G4 is unlikely to result from the presence of additional water molecules, because the sequences predict a tightly packed and hydrophobic combining site (Fig. 4). Therefore, it is likely that the differences in the ultrafast time-scale response of each Ab are due to specific protein motions (see below). The amplitude of the intermediate frequency (3- to 5-ps time scale) motions is also different for each Ab. The reorganization energy of this component for 34F10 (70 cm−1) is more than twice that for 4-4-20 (30 cm−1), with that of 40G4 again being intermediate (50 cm−1). This time scale is slightly faster in 34F10 and 40G4 (3 ps) relative to 4-4-20 (5 ps). Therefore, as with the fastest motions, the intermediate time-scale motions of each Ab show increasing flexibility after proceeding from 4-4-20 to 40G4 to 34F10. Finally, the reorganization energy of the slowest motions (nanosecond time scale) only change by <7%.
Figure 4.

Amino acid sequences of Fl–Ab. The CDRs are highlighted in bold type.
The Ab combining sites show distinctly different flexibilities, which is largely manifest at the intermediate and higher frequencies. The ultrafast motions likely correspond to nearly free side-chain motions, and the picosecond motions likely correspond either to more hindered side-chain librations or to the fastest motions of either complementarity-determining region 3 (CDR3) loop. In this context it is particularly interesting to note that the flexibilities parallel the heavy chain CDR3 (HCDR3) loop length, and as discussed below, this loop is likely to be central in the 4-4-20 response to Ag excitation.
Structural Origins of the Observed Protein Motions in Ab 4-4-20.
The largest photoinduced changes in the Ag are predicted to be charge migration in the xanthene ring system and motion of the phenyl ring. The high-resolution crystal structure of the 4-4-20 complex therefore may be used to determine which regions of the combining site may be experiencing stress from the induced forces (Fig. 5). Most of the binding interactions are between the Ab and the xanthene ring (19), with the carboxyphenyl ring packed from only one side by backbone atoms in the tip of the HCDR3 loop. These arguments, in addition to the relative reduced masses of the two ring systems, predict that the force applied to the Ab will be manifest on residues that contact the carboxyphenyl ring. This implies that a significant component of the protein response to Ag structural reorganization will involve residues 95–98 in the β-turn of the HCDR3 loop (Fig. 5). Interestingly, although the structures of 34F10 and 40G4 are not known, the length of the HCDR3 loops parallels the observed flexibilities (Fig. 4). The loop length of the most flexible Ab, 34F10, is 12 aa, the second most flexible is 10 aa, and the most rigid, 4-4-20, is 7 aa. This implies that the longer loop may show increased flexibility, with an increasingly low-energy, high-amplitude response to torsional force at the phenyl group.
Figure 5.

Fl-binding site in Ab 4-4-20, from the x-ray structure (PDB ID code 1FLR).
The side chain of Tyr-L32 hydrogen-bonds with the phenylcarboxylate and also packs on the xanthene ring. This side chain may act as a “molecular splint” that bridges the highly flexible interannular bond and therefore may be particularly sensitive to the relative geometry of the two rings. This residue, along with Trp-H33, is also closest to the regions of xanthene ring, which undergo the largest changes in electron density. Although the interaction between Trp-H33 and Fl is mostly hydrophobic (van der Waals), the Tyr-L32–xanthene interaction is more electrostatic (19) and therefore will be more sensitive to charge reorganization. Tyr-L32 is predicted therefore to be an important component of the 4-4-20 response to the structural and electrostatic forces resulting from Ag excitation. This residue is unique to 4-4-20, part of an insertion in light chain CDR1 (LCDR1) that is not present in either 34F10 or 40G4, and may contribute to the rigidification of the Ab–Ag complex, consistent with 4-4-20 being the most rigid of the three Abs. This molecular interpretation supports at least a contribution of induced-fit or conformational selection to the 4-4-20 interaction with Fl.
Charge redistribution may also cause changes in hydrogen bonding. In particular, the Δq map shows significant charge migration away from both oxygen atoms of the xanthene ring after excitation. As a result, hydrogen bonds between these atoms and His-L27D and Arg-L34 will be weakened, and Ag excitation may act to increase mobility of these residues. The observed protein response to the excitation-dependent forces at the Ag is therefore likely to include motions of the HCDR3 loop, Tyr-L32, His-L27D, and Arg-L34.
Comparison of Abs That Bind Flexible or Rigid Ags.
Recently the rigid chromophore MPTS was characterized in various solvents as well as in the combining site of Ab 6C8 (15). A comparison of the ρFl(ω) with ρMPTS(ω) demonstrates a clear difference in flexibility between the two Ags (Fig. 7, which is published as supporting information on the PNAS web site). The value of λ for MPTS is much larger than that for Fl (1,000 and 483 cm−1 for MPTS and Fl, respectively). The distribution of frequencies is also markedly different; <10% of the reorganization for MPTS is due to low-frequency modes (ω < 1,000 cm−1), whereas >40% of Fl vibrational reorganization involves modes in this low-frequency regime. These spectral densities reflect the differing flexibilities of the two Ags. MPTS is a rigid planar chromophore, whereas Fl contains a carboxyphenyl group that is capable of large amplitude rotation with respect to the xanthene moiety. The crystal structure of Ab 4-4-20 shows a xanthene–phenyl torsion angle of 71°. This ligand conformation is unlikely to exist in solution, because its energy is calculated to be ≈400 cm−1 above that of the ground-state minimum. This geometry change therefore occurs after binding, i.e., by an induced-fit or conformational selection mechanism. These dynamics contrast with those of MPTS, where the rigid pyrene framework resists distortion.
The Ab 6C8–MPTS complex was characterized, and the protein was found to reorganize after Ag excitation on time scales of 75 fs, 2 ps, and 67 ps, with a total reorganization energy of 432 cm−1 (15). MPTS and Fl elicited combining sites with distinct dynamics. It is surprising that the combining-site reorganization of Ab 6C8 is much larger than for the anti-Fl Ab, especially considering the limited structural and electronic perturbation expected with MPTS excitation relative to Fl. Excitation of MPTS changes bond lengths within the conjugated pyrene core, which remains planar in both electronic states. Moreover, the dipole moment of MPTS changes by <1 Debye unit. As a result, it is expected that the Ab 6C8 would be forced to undergo smaller structural rearrangements than the anti-Fl Ab and therefore would have smaller reorganization energies. Obviously, reorganization energies alone are not a sufficient means of comparing flexibilities, and the time scales of protein motion must be examined as well.
Three time scales of protein motion are observed for both the anti-MPTS and anti-Fl Ab. The two fastest time scales, <100 fs and 1–3 ps, are similar in all Abs. However, MPTS shows that 67-ps dynamics are not present in the anti-Fl Ab. The slowest protein motions in the anti-Fl Ab are at least a factor of 20 slower than those in the anti-MPTS Ab, indicating that the anti-Fl Abs are more flexible than those that bind MPTS. Although the induced displacements are smaller with MPTS than Fl, they are resisted by higher-frequency protein motions, resulting in larger reorganization energies. The more flexible Ag (Fl) elicited a more flexible Ab (4-4-20, 34F10, and 40G4), whereas the more rigid Ag (MPTS) elicited a more rigid Ab (6C8). This may imply that the mechanism of recognition, lock-and-key, induced-fit, or conformational selection, may be optimal when reflected in the binding partner.
Conclusions
Protein flexibility may play an important role in Ab–Ag recognition and in protein biological function in general. The response of a protein to a specific force provides a convenient way to characterize the protein flexibility. The response of three anti-Fl Abs to the structural and electronic changes that result from Fl excitation have been characterized and involve motions of the tens of femtosecond to nanosecond time scales. The Ab 4-4-20 response is likely to include motions of the HCDR3 loop, Tyr-L32, His-L27D, and Arg-L34. Site-directed amino acid mutagenesis studies and molecular-dynamics simulations may test this model further.
The 4-4-20 complex with Fl is the most rigid complex of the three characterized, although it is less rigid then the anti-MPTS Ab 6C8. The 40G4-binding site shows intermediate flexibility, whereas Ab 34F10 is the most flexible and would not be expected to support the rigid geometry required for lock-and-key recognition of the Ag. These differences may result from a unique Tyr-L32 side chain in 4-4-20, which pins the Ag against a short and relatively inflexible HCDR3 loop. The flexibilities also parallel the HCDR3 loop length. The HCDR3 loop may play a central role in establishing the dynamics of the combining site, which is interesting considering that the HCDR3 loop is also the focus of the majority of sequence diversity present in an Ab. This diversity, which results from somatic rearrangements involving potentially lethal double-strand breaks, must impart the cell with a significant advantage, which has conventionally been discussed only in terms of affinity. We speculate that sequence diversity focused to HCDR3 may also bestow the immune system with dynamic diversity that allows for the generation of Abs that recognize Ags with a wide range of mechanisms including lock-and-key, induced-fit, and conformational selection.
Supplementary Material
Acknowledgments
We thank Drs. Delmar Larsen, Scott Brozell, and Jeffrey Reimers for help with calculations and Dr. Diane Kubitz for help with mAb production. Funding was provided by The Skaggs Institute for Chemical Biology (to F.E.R.), National Science Foundation Grant DBI-0078296 (to K.K.B.), and National Institutes of Health Grant NBCR-RR08605 (to K.K.B.).
Abbreviations
- Ag
antigen
- 3PEPS
three-pulse photon echo peak shift
- MPTS
8-methoxypyrene-1,3,6-trisulfonate
- Fl
fluorescein
- CDR
complementarity-determining region
- HCDR3
heavy chain CDR3
Footnotes
This paper was submitted directly (Track II) to the PNAS office.
References
- 1.Pauling L. Chem Eng News. 1946;24:1375–1377. [Google Scholar]
- 2.Koshland D E., Jr Proc Natl Acad Sci USA. 1958;44:98–104. doi: 10.1073/pnas.44.2.98. [DOI] [PMC free article] [PubMed] [Google Scholar]
- 3.Berger C, Weber-Bornhauser S, Eggenberger J, Hanes J, Plückthun A, Bosshard H R. FEBS Lett. 1999;450:149–153. doi: 10.1016/s0014-5793(99)00458-5. [DOI] [PubMed] [Google Scholar]
- 4.Patten P A, Gray N S, Yang P L, Marks C B, Wedemayer G J, Boniface J J, Stevens R C, Schultz P G. Science. 1996;271:1086–1091. doi: 10.1126/science.271.5252.1086. [DOI] [PubMed] [Google Scholar]
- 5.Wedemayer G J, Patten P A, Wang L H, Schultz P G, Stevens R C. Science. 1997;276:1665–1669. doi: 10.1126/science.276.5319.1665. [DOI] [PubMed] [Google Scholar]
- 6.Nezlin R. The Immunoglobulins: Structure and Function. New York: Academic; 1998. [Google Scholar]
- 7.Rini J M, Schulze-Gahmen U, Wilson I A. Science. 1992;255:959–965. doi: 10.1126/science.1546293. [DOI] [PubMed] [Google Scholar]
- 8.Williams R J P. Eur Biophys J. 1993;21:393–401. [Google Scholar]
- 9.Jardetzky O, Lefèvre J F. FEBS Lett. 1994;338:246–250. doi: 10.1016/0014-5793(94)80277-7. [DOI] [PubMed] [Google Scholar]
- 10.Ishima R, Torchia D A. Nat Struct Biol. 2000;7:740–743. doi: 10.1038/78963. [DOI] [PubMed] [Google Scholar]
- 11.Rasmussen B F, Stock A M, Ringe D, Petsko G A. Nature. 1992;357:423–424. doi: 10.1038/357423a0. [DOI] [PubMed] [Google Scholar]
- 12.Fayer M D. Annu Rev Phys Chem. 2001;52:315–356. doi: 10.1146/annurev.physchem.52.1.315. [DOI] [PubMed] [Google Scholar]
- 13.Rella C W, Kwok A, Rector K, Hill J R, Schwettman H A, Dlott D D, Fayer M D. Phys Rev Lett. 1996;77:1648–1651. doi: 10.1103/PhysRevLett.77.1648. [DOI] [PubMed] [Google Scholar]
- 14.Lim M, Hamm P, Hochstrasser R M. Proc Natl Acad Sci USA. 1998;95:15315–15320. doi: 10.1073/pnas.95.26.15315. [DOI] [PMC free article] [PubMed] [Google Scholar]
- 15.Jimenez R, Case D A, Romesberg F E. J Phys Chem B. 2002;106:1090–1103. [Google Scholar]
- 16.Mukamel S. Principles of Nonlinear Optical Spectroscopy. New York: Oxford Univ. Press; 1995. [Google Scholar]
- 17.Fleming G R, Cho M. Annu Rev Phys Chem. 1996;47:109–134. [Google Scholar]
- 18.Whitlow M, Howard A J, Wood J F, Voss E W, Jr, Hardman K D. Protein Eng. 1995;8:749–761. doi: 10.1093/protein/8.8.749. [DOI] [PubMed] [Google Scholar]
- 19.Herron J N, Terry A H, Johnston S, He X-m, Guddat L W, Voss E W, Jr, Edmundson A B. Biophys J. 1994;67:2167–2183. doi: 10.1016/S0006-3495(94)80738-6. [DOI] [PMC free article] [PubMed] [Google Scholar]
- 20.Harlow E, Lane D. Antibodies: A Laboratory Manual. Plainview, NY: Cold Spring Harbor Lab. Press; 1988. [Google Scholar]
- 21.Ulrich H D, Patten P A, Yang P L, Romesberg F E, Schultz P G. Proc Natl Acad Sci USA. 1995;92:11907–11911. doi: 10.1073/pnas.92.25.11907. [DOI] [PMC free article] [PubMed] [Google Scholar]
- 22.Reimers J R. J Chem Phys. 2001;115:9103–9109. [Google Scholar]
- 23.Baldridge K K, Greenberg J P. J Mol Graphics. 1995;13:63–66. doi: 10.1016/0263-7855(94)00002-a. [DOI] [PubMed] [Google Scholar]
- 24.Klonis N, Clayton A H A, Voss E W, Jr, Sawyer W H. Photochem Photobiol. 1998;67:500–510. [PubMed] [Google Scholar]
- 25.Vajda S, Jimenez R, Rosenthal S J, Fidler V, Fleming G R, Castner E W., Jr J Chem Soc Faraday Trans. 1995;91:867–873. [Google Scholar]
Associated Data
This section collects any data citations, data availability statements, or supplementary materials included in this article.