Abstract
Amyloid β-protein (Aβ) is linked to neuronal injury and death in Alzheimer's disease (AD). Of particular relevance for elucidating the role of Aβ in AD is new evidence that oligomeric forms of Aβ are potent neurotoxins that play a major role in neurodegeneration and the strong association of the 42-residue form of Aβ, Aβ42, with the disease. Detailed knowledge of the structure and assembly dynamics of Aβ thus is important for the development of properly targeted AD therapeutics. Recently, we have shown that Aβ oligomers can be cross-linked efficiently, and their relative abundances quantified, by using the technique of photo-induced cross-linking of unmodified proteins (PICUP). Here, PICUP, size-exclusion chromatography, dynamic light scattering, circular dichroism spectroscopy, and electron microscopy have been combined to elucidate fundamental features of the early assembly of Aβ40 and Aβ42. Carefully prepared aggregate-free Aβ40 existed as monomers, dimers, trimers, and tetramers, in rapid equilibrium. In contrast, Aβ42 preferentially formed pentamer/hexamer units (paranuclei) that assembled further to form beaded superstructures similar to early protofibrils. Addition of Ile-41 to Aβ40 was sufficient to induce formation of paranuclei, but the presence of Ala-42 was required for their further association. These data demonstrate that Aβ42 assembly involves formation of several distinct transient structures that gradually rearrange into protofibrils. The strong etiologic association of Aβ42 with AD may thus be a result of assemblies formed at the earliest stages of peptide oligomerization.
Amyloid β-protein (Aβ) fibril formation and deposition long have been linked to the neuropathogenesis of Alzheimer's disease (AD) (1–5). However, recent data have shown that oligomeric Aβ assembly intermediates are potent neurotoxins, and that these intermediates may be the key effectors of neurotoxicity in AD (6). In transgenic mice expressing the human amyloid β-protein precursor (AβPP) and Aβ, neurologic deficits develop before and independently of the appearance of amyloid deposits (6, 7). Importantly, soluble oligomeric forms of Aβ are neurotoxic in vitro (8–15) and in vivo (15). The main alloforms of Aβ found in amyloid deposits are 40 and 42 amino acids long (designated Aβ40 and Aβ42, respectively). Despite the small structural difference between these two peptides, they display distinct clinical, biological, and biophysical behavior. The concentration of secreted Aβ42 is ≈10% that of Aβ40, yet the longer form is the predominant component in parenchymal plaques (16–18). An increase in the Aβ42/Aβ40 concentration ratio is associated with familial forms of early onset AD (19, 20). Treatments that reduce Aβ42 levels have been shown to correlate with decreased risk for AD (21). In addition, Aβ42 displays enhanced neurotoxicity relative to Aβ40 (22–24). Studies of the kinetics of Aβ fibril formation have shown that Aβ42 forms fibrils significantly faster than Aβ40 (25), leading to the oft-repeated statement “Aβ42 is more amyloidogenic” than Aβ40 (for a review, see ref. 26). However, the structural and thermodynamic meaning of this statement is not entirely clear. Moreover, if oligomeric assemblies, rather than fibrils, are the key effectors of neurotoxicity in AD, kinetic differences in fibril assembly may not underlie the differences in biological activity between the two alloforms. The distinct clinical results of elevated Aβ42 levels may stem from qualitative differences, such as the formation of unique intermediates. Thus, understanding the differences between Aβ40 and Aβ42 with regard to the assembly of these peptides is biologically and clinically important. Here a combination of biochemical, spectroscopic, and morphologic methods was used to study the initial oligomerization and assembly of Aβ40 and Aβ42. The data show that these peptides have distinct behaviors at the earliest stage of assembly, monomer oligomerization. This finding may explain the particularly strong association of Aβ42 with AD and suggest approaches for appropriate targeting of therapeutic agents for AD.
Materials and Methods
Isolation of Low Molecular Weight (LMW) Aβ.
LMW fractions of Aβ alloforms were isolated either by size-exclusion chromatography (SEC), as described (27), or by filtration through a 10,000 Mr cut-off filter, as described (28).§
Cross-Linking of Aβ and SDS/PAGE Analysis.
Freshly isolated LMW peptides were immediately subjected to photo-induced cross-linking of unmodified proteins (PICUP) and were analyzed by SDS/PAGE, as described (27).
Dynamic Light Scattering (DLS).
Experiments using SEC-isolated LMW Aβ were performed as described (29). In experiments in which LMW Aβ was isolated by filtration, the peptides were transferred to a DLS cuvette and then spun for 25 min at 5,000 × g to pellet dust particles. DLS measurements were performed as described (30).
Electron Microscopy (EM).
EM experiments were performed by using SEC-isolated LMW Aβ with or without cross-linking, essentially as described (9).
Circular Dichroism Spectroscopy (CD).
CD experiments were performed by using SEC-isolated LMW Aβ with or without cross-linking, essentially as described (31).
Results and Discussion
Determination of the Oligomer Size Distributions of Aβ40 and Aβ42.
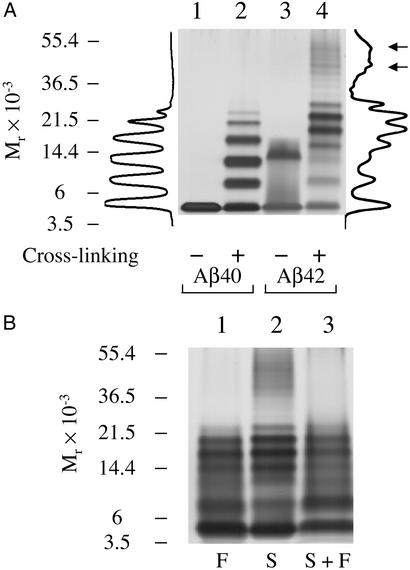
An obvious and attractive strategy for understanding the mechanistic basis of Aβ-associated neuropathogenesis is to identify biophysical differences between Aβ40 and Aβ42. Here, we performed a systematic multifaceted analysis of Aβ40 and Aβ42 oligomerization. The first step was to determine the oligomer size distributions of Aβ40 and Aβ42. To do so, PICUP (32) was used to cross-link an aggregate-free preparation [LMW Aβ (12)] of each peptide immediately after its isolation by SEC. PICUP is a very efficient method for rapid cross-linking of native proteins and has been used effectively in prior studies of Aβ (27). The oligomerization state of each peptide after cross-linking was determined by SDS/PAGE/densitometry analysis. The distribution of PICUP-derived oligomers of Aβ40 (Fig. 1A, lane 2) was characterized by similar amounts of monomer through tetramer, followed by a sharp decrease of the abundances of pentamer through heptamer. Uncross-linked Aβ40 electrophoresed with an Mr consistent with that of monomer. A distinctly different oligomer size distribution, comprising three groups of oligomers, was found for Aβ42 (Fig. 1A, lane 4). The first group, monomer through trimer, displayed decreasing intensity with increasing oligomer order. In the second group, a Gaussian-like distribution was observed between tetramer and octamer, with a maximum at pentamer and hexamer. The third group contained oligomers of Mr ≈ 30,000–60,000. Within this group, bands of nonamer through dodecamer could be resolved, and intensity maxima were observed at dodecamer and at a position consistent with octadecamer (Fig. 1A, arrows). Aβ42 oligomers from trimer and above migrated faster than predicted for their molecular weights, suggesting that they were stabilized in a nonextended structure by cross-linking. Uncross-linked Aβ42 produced predominantly two bands, a monomer band and a broad trimer band, the latter of which was found to be induced by SDS (data not shown). An analogous band was not observed after cross-linking.
Figure 1.
PICUP reveals distinct oligomer distributions for Aβ40 and Aβ42. LMW Aβ40 and Aβ42 were cross-linked immediately after preparation by SEC and analyzed by SDS/PAGE/silver staining. (A) Noncross-linked (lanes 1 and 3) or cross-linked (lanes 2 and 4) Aβ40 and Aβ42. Intensity profiles of lanes 2 (cross-linked Aβ40) and 4 (cross-linked Aβ42) are shown (left and right of the gel, respectively). These profiles were generated by using ONE-DSCAN (Scanalytics, Fairfax, VA). Arrows next to the intensity profile of cross-linked Aβ42 indicate intensity maxima corresponding to presumptive dodecamer and octadecamer species. (B) PICUP chemistry was performed on LMW Aβ42 samples immediately after preparation by filtration (“F”) through a 10,000 Mr cut-off filter (lane 1), SEC (“S,” lane 2), or SEC followed by filtration (“S + F,” lane 3). Positions of molecular weight standards (A and B) are shown on the left. The gels are representative of those obtained in each of at least three independent experiments.
The cross-linking experiments demonstrate that even though the primary structure difference between Aβ40 and Aβ42 is small, it causes Aβ42 to oligomerize in a profoundly different manner. The characterization of these oligomers provides an insight into the mechanism of Aβ42 assembly. Specifically, the intensity maxima in the third group of Aβ42 oligomers appear to comprise multiples (dodecamer, octadecamer) of the predominant small species (hexamer), suggesting that hexamers (and potentially pentamers) form basic units that associate further to form the larger assemblies.
Factors Controlling Aβ42 Oligomerization.
In the SEC preparation of Aβ for cross-linking, the observed retention times of LMW Aβ40 and Aβ42 were identical, within experimental error. (The chromatograms for Aβ40 and Aβ42 are published as Fig. 7 in the supporting information on the PNAS web site.) Coupled with the narrow (dimer, trimer, tetramer) Aβ40 oligomer size distribution revealed by PICUP, this suggested that cross-linking of LMW Aβ42 would produce a relatively restricted distribution of oligomer sizes. However, a broad range of molecular masses (≈4–60 kDa) of Aβ42-derived oligomers was observed in the PICUP experiments. This observation suggested that small Aβ42 oligomers, which comigrate during SEC due to the rapid equilibrium among them, associate during the time period (typically 1–2 min) between their isolation and cross-linking, producing the larger assemblies observed by PICUP/SDS/PAGE. To examine this question further, LMW Aβ42 was prepared by using filtration through a 10,000 Mr cut-off filter (28) and then cross-linked immediately. SDS/PAGE analysis of the oligomer size distribution revealed only the first two groups (monomer through trimer and tetramer through octamer) of oligomers (Fig. 1B, lane 1). The third group of oligomers, at ≈30–60 kDa, was not observed. When SEC-isolated LMW Aβ42 was filtered through a 10,000 Mr cut-off filter (Fig. 1B, lane 3), a similar shift of intensities was observed, and the distribution was similar to that of LMW Aβ42 prepared directly by filtration (see Fig. 1B, lanes 1 and 3). LMW Aβ42 prepared by SEC thus differs from that prepared by filtration. Oligomers up to octamer formed immediately after filtration, but larger oligomers were observed only when LMW Aβ42 was isolated by SEC. The oligomer size distributions of Aβ40, in contrast, were not affected by the preparation method (27), suggesting that Aβ40 trimer and tetramer formed immediately after filtration. The formation of larger oligomers by Aβ42 may be due to the duration of the chromatographic separation or to peptide–matrix or peptide–peptide interactions, which could facilitate formation of an Aβ conformer capable of more stable intermolecular interactions than the conformers existing immediately after filtration. Alternatively, filtration may have removed conformers prone to aggregation.
Characterization of the Size Distributions of Aβ40 and Aβ42 Oligomers by DLS.
In the PICUP experiments, oligomers of molecular mass >60 kDa were not observed. This likely was due to the requirement that all component peptides within these larger structures must be cross-linked to be observed in SDS/PAGE. Therefore, to monitor large Aβ oligomers, DLS was used. A useful feature of DLS is that detection sensitivity increases with increasing scatterer size (29). In addition, DLS does not require covalent association of the peptides composing large assemblies.
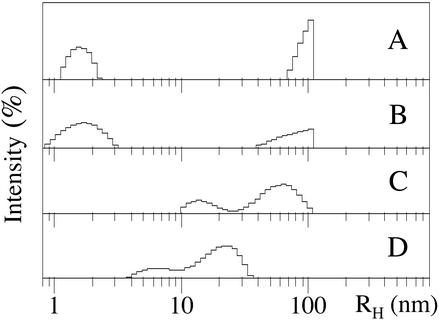
LMW Aβ40 and Aβ42 were isolated both by SEC and by filtration and their DLS spectra recorded immediately thereafter. The size distributions observed for Aβ40 revealed mainly particles of hydrodynamic radius (RH) = 1–2 nm (Fig. 2 A and B). All of the measurements also showed particles with large RH values (100+ nm). It is important to note that because the particle scattering intensity is proportional to molecular weight (29), the actual abundance of these large particles is significantly lower than indicated in the distributions. Comparison of the DLS data for LMW Aβ40 (Fig. 2 A and B) with those derived by PICUP (Fig. 1A, lane 2; and ref. 27) suggests that the 1- to 2-nm particles observed by DLS correspond to monomers, dimers, trimers, and tetramers, in equilibrium. The particle size distributions observed by DLS for LMW Aβ40 isolated by either SEC or filtration were indistinguishable experimentally (Fig. 2 A and B), also in agreement with the PICUP data (27). The particle size distribution of SEC-isolated LMW Aβ42 comprised two peaks, one at ≈10–20 nm and the other centered at ≈60 nm (Fig. 2C). In contrast, in the size distribution of LMW Aβ42 prepared by filtration, a peak at ≈6–7 nm was observed, and the 60-nm peak was missing (Fig. 2D). In qualitative terms, the DLS results thus were very similar to the data obtained by PICUP. The oligomer size distributions of Aβ40 and Aβ42 were distinct, with larger oligomers observed in the distribution of the longer alloform. In addition, the distribution of LMW Aβ42 was sensitive to the method of preparation, whereas the distribution of LMW Aβ40 was not.
Figure 2.
Analysis of the oligomer size distributions of Aβ by DLS. Representative DLS spectra are shown of LMW Aβ40 isolated by SEC (A) or filtration (B). Large particles (>100 nm) were not included in the measurement window, resulting in the truncation of the peaks in that region. Representative DLS spectra are shown of LMW Aβ42 isolated by SEC (C) or filtration (D). The data are representative of those obtained in each of at least three independent experiments.
Morphology of LMW Aβ40 and Aβ42.
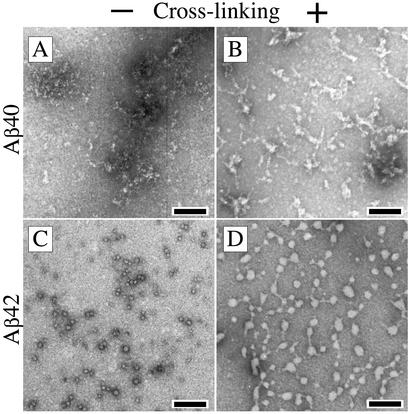
The PICUP and DLS data indicated that Aβ42 oligomerized in a manner distinct from that of Aβ40. In particular, the Aβ42 oligomer distribution suggested that higher oligomers formed through self-association of smaller pentamer/hexamer units. To determine the morphological manifestations of the distinct oligomerization behaviors of Aβ40 and Aβ42, LMW Aβ preparations were examined by EM. Noncross-linked LMW Aβ40 showed mainly amorphous threads of variable length (Fig. 3A). Within these structures, small (1- to 2-nm) “granules” could be observed. Upon cross-linking, similar, slightly larger amorphous structures were observed (Fig. 3B). These structures also appeared granular, but the granule size was 4–5 nm. The most frequently observed morphology in noncross-linked LMW Aβ42 was a quasicircular structure ≈5 nm in diameter (Fig. 3C). Presumably these structures are spheroidal in solution. These spheroids appeared either individually or associated together into small groups. After cross-linking, chains of spheroidal structures were apparent, most of which were connected to each other by narrow (1- to 2-nm) threads (Fig. 3D). These structures displayed higher variability in their diameter (≈2–30 nm) than did noncross-linked Aβ42. Thus, in agreement with the distinct oligomer size distributions observed by PICUP and DLS, the morphologies of the early oligomeric assemblies of Aβ40 and Aβ42 were also distinct.
Figure 3.
Morphologic analysis of cross-linked LMW Aβ. LMW Aβ40 (A and B) or Aβ42 (C and D) were isolated by using SEC. Aliquots of noncross-linked (A and C) or cross-linked (B and D) peptide were spotted on glow-discharged, carbon-coated grids, stained with uranyl acetate, and examined by EM. (Bars = 100 nm.) The images are representative of those in each of at least three independent experiments.
Correlation of Aβ42 Oligomer Size Distributions and Morphology.
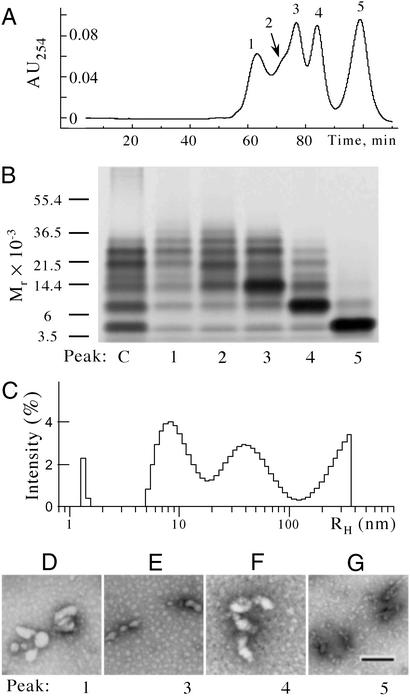
The combination of PICUP and DLS enabled monitoring of a broad range of assembly sizes, with high resolution of abundant LMW oligomers provided by PICUP and sensitive detection of low-abundance high molecular weight assemblies provided by DLS. To obtain morphologic information, EM studies complemented the PICUP and DLS work. The morphologies observed by EM for Aβ42, i.e., individual 5-nm-diameter spheroids and oligomers thereof, were consistent with the hypothesis that early assemblies of Aβ42 form by the oligomerization of pentamer/hexamer units, as suggested by the PICUP data. The EM-determined sizes of the oligomers also were consistent with the intensity maxima observed by DLS at RH ≈ 5–20 nm. However, estimates of the sizes of larger Aβ42 oligomers differed depending on whether PICUP or DLS was used. For example, PICUP data suggested that the largest oligomers were ≈30–60 kDa in molecular mass, whereas DLS revealed scatterers with RH ≈ 60 nm. These radii would correspond to assemblies much larger than 30–60 kDa. To better understand these observations, cross-linked LMW Aβ42 was fractionated by SEC, and then SDS/PAGE, DLS, and EM were used to examine concurrently the individual fractions. SEC produced five peaks (Fig. 4A), each of which was collected directly into a separate DLS cuvette. Aliquots from each fraction were taken for determination of protein concentration by amino acid analysis and for morphologic analysis by EM. The DLS spectrum in each fraction then was recorded, and finally each fraction was lyophilized, resolubilized at 20-fold higher concentration, and analyzed by SDS/PAGE.
Figure 4.
Comparative analysis of Aβ42 oligomer morphology and size distribution. (A) Cross-linked Aβ42 was fractionated by SEC and five peaks were collected (indicated as 1–5). SDS/PAGE (B), DLS (C), and EM (D) then were done on the five peaks obtained to characterize and correlate morphologic and oligomer size distribution data. (B) SDS/PAGE/silver stain analysis. Positions of molecular weight standards are shown on the left. (C) DLS analysis of peak 1. (D–G) EM images of peaks 1, 3, 4, and 5, respectively. (Bar = 100 nm.) The data shown are representative of those obtained in each of at least three independent experiments.
SDS/PAGE analysis showed that peaks 3–5 were enriched in trimer (43% of the total protein mass, determined densitometrically), dimer (63%), and monomer (90%), respectively (Fig. 4B). Peak 2 contained mainly trimer and oligomers of SDS/PAGE “group 2” (pentamer through octamer), in addition to small amounts of monomer and dimer. Only trace amounts of tetramer were observed. Relative to the nonfractionated mixture (Fig. 4B, lane C), peak 1, the void volume peak, was enriched in oligomers of group 2. The peptide concentrations in peaks 1–5, as measured by amino acid analysis, were 0.5–1 μM. At these concentrations, DLS is sensitive only to particles ≈40 kDa or more in molecular mass. Thus, not surprisingly, no particles were observed in peaks 2–5 (data not shown). In contrast, the DLS spectrum of peak 1 displayed intensity maxima centered at ≈8–9, ≈40, and >130 nm (Fig. 4C). The first two maxima likely result from the particles previously observed in DLS experiments on uncross-linked Aβ42 isolated by SEC or filtration (Fig. 2 C and D, respectively). The maximum at ≈40 nm appears to be an average of those observed at ≈10–20 and ≈60 nm before fractionation (Fig. 2C). The large particles (RH > 130 nm) were not observed in the uncross-linked LMW Aβ42 sample (Fig. 2 C and D). The morphologies observed electron microscopically in peaks 1, 3, and 4 were quasiglobular, with diameters ≈20–50 nm (Fig. 4 D–F), similar to those observed for nonfractionated, cross-linked Aβ42 (Fig. 3D). The lack of resolution of peak 2 from peak 3, and its low abundance, precluded acquisition of EM data for its components. Peak 5, containing predominantly monomer, showed amorphous morphologies with diameters of ≈5 nm (Fig. 4G), similar to those of cross-linked Aβ40. Some of these structures also were observed in peak 4.
The large (RH > 130 nm) structures revealed by DLS were not detected by SEC or PICUP. For SEC, it is likely that a combination of low resolution of high molecular weight solutes and low protein mass combined to preclude detection of these large structures. For PICUP, each peptide within a large assembly must be cross-linked for the assembly to be stabilized against SDS-induced dissociation. Although PICUP chemistry is very efficient, the efficiency is <100%, and as oligomer size increases, factors including chemical accessibility make complete cross-linking more difficult. This explains why the particles of RH ≈ 60 nm were detected as ≈30- to 60-kDa bands by SDS/PAGE.
Taken together, our data show that Aβ42 oligomerizes rapidly to form pentamer/hexamer units identifiable by PICUP/SDS/PAGE. The Aβ42 pentamer/hexamer units exist in equilibrium with monomers because repeated filtering does not change their relative intensities. Importantly, both the PICUP (Fig. 1A) and EM (Fig. 3 C and D) data suggest that rather than growing into fibrils solely by addition of monomers, pentamer/hexamer units self-associate to form larger beaded superstructures. Operationally, the pentamer/hexamer units may be considered “paranuclei,” because they represent an initial, and minimal, structural unit from which Aβ assemblies evolve.
Conformation of Cross-Linked LMW Aβ40 and Aβ42.
Assembly of Aβ into protofibrils and fibrils involves a significant conformational rearrangement from unstructured and helical conformations to extended β-sheets (33). To assess the conformational state of the Aβ oligomers identified through cross-linking, SEC-isolated LMW Aβ40 and Aβ42 were examined by circular dichroism spectroscopy before or immediately after PICUP reactions. The spectra of cross-linked and un-cross-linked Aβ40 and Aβ42 are published as supporting information on the PNAS web site. The predominant secondary structure element for both uncross-linked Aβ40 and Aβ42 was “random coil” (84% and 79%, respectively). Smaller amounts of β-sheet/β-turn (13% and 18%, respectively; Fig. 8, which is published as supporting information on the PNAS web site) and α-helix (3% for each) were also present. For both peptides, cross-linking resulted in an ≈10% decrease in random coil content accompanied by proportionate increases in β-sheet/β-turn (to 20% and 24%, respectively) and α-helix (to 6% and 7%, respectively). Comparison of the spectra produced by both uncross-linked and cross-linked Aβ40 and Aβ42 revealed a modestly (≈5%), but consistently, higher β-turn/sheet content in the Aβ42 samples. These data show that the initial oligomerization of Aβ does not involve substantial conformational rearrangement. The higher β-turn/β-sheet content initially present in Aβ42 may be necessary to allow its structural organization into paranuclei.
Factors Influencing the Oligomer Size Distribution.
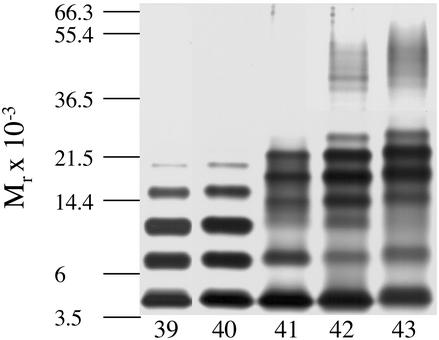
The distinct oligomer size distributions observed for Aβ40 and Aβ42 are related, by definition, to the Ile-41-Ala-42 dipeptide at the C terminus of Aβ. To determine how C terminus length affects oligomerization, PICUP was applied to SEC-isolated LMW Aβ ending at positions 39–43 (Fig. 5). The oligomer size distribution of Aβ39 was essentially identical to that of Aβ40, indicating that Val-40 is not necessary for production of the monomer–dimer–trimer–tetramer equilibrium. In contrast, the distributions obtained for Aβ41, Aβ42, and Aβ43 were distinct from those of Aβ39 and Aβ40. Densitometric analysis of the amount of each oligomer observed in six independent experiments with Aβ41, Aβ42, and Aβ43 revealed that, on average, as the peptide length increased, the intensities shifted from the first group of oligomers (monomer through trimer) to the second group (tetramer through octamer). The densitometry results are published as Fig. 9 in the supporting information on the PNAS web site. Parallel to the shift of abundances toward the second group of oligomers, an increase in the intensity of the third group of oligomers (≈30–60 kDa) was observed. This group was not observed with Aβ39, Aβ40, and Aβ41 but was observed clearly for Aβ42 and Aβ43. On average, the intensity of the oligomers in group 3 was twice as intense in the distribution of Aβ43 as in that of Aβ42. These data demonstrated that Ile-41 was essential for mediating paranucleus formation. Ala-42 was required for the self-association of paranuclei. The further elongation of the C terminus by Thr-43 facilitated this self-association. One thus would predict that mutations in the AβPP or in the γ-secretase complex that facilitated generation of Aβ41 would produce a disease phenotype similar to, but less severe than, that produced by mutations causing elevations in Aβ42 concentration. Importantly, the phenotype produced by such a mutation would help determine the pathogenetic role of paranuclei versus the larger oligomeric assemblies.
Figure 5.
C-terminal length-dependence of Aβ oligomerization. SEC-isolated LMW Aβ39, Aβ40, Aβ41, Aβ42, and Aβ43 were cross-linked individually and analyzed by SDS/PAGE. Positions of molecular weight standards are shown on the left. The gel is representative of three independent experiments.
Conclusion
The spheroidal structure of the Aβ42 paranuclei observed here is similar to structures observed by others (10, 11, 34). Interestingly, a “beads-on-a-string” morphology, similar to oligomeric paranuclei, has been observed during the assembly of the yeast prion-like protein Sup35 (35, 36), but the composition of the component “beads” was not determined. In contrast to Aβ42, Aβ40, immediately after isolation, appears to be grossly amorphous. In our experiments, no Aβ40 paranuclei, or oligomers thereof, were detected at early time points. However, in situ atomic force microscopy studies have shown that after incubation, Aβ40 can form beaded structures similar to those formed by Aβ42 (37). On longer incubation, both Aβ40 and Aβ42 appear to transform into protofibrillar structures (34, 37). Our data suggest that the critical difference between the assembly of Aβ40 and Aβ42 is the oligomerization occurring immediately after peptide production.
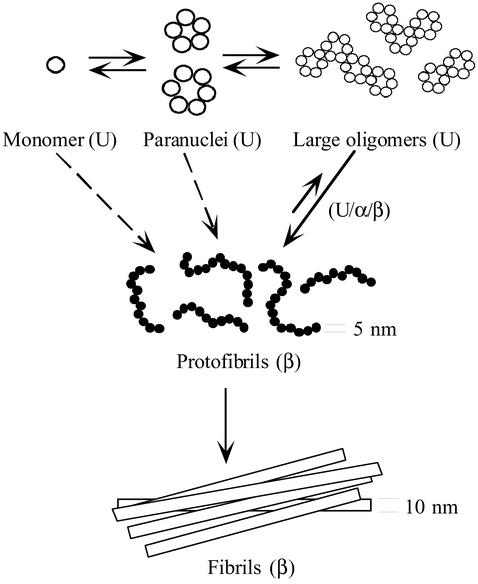
In summary, using a combination of biophysical and biochemical approaches, we have gained significant insights into the structural features that may govern the distinct biological and clinical behavior of Aβ40 and Aβ42. A simple model, consistent with our observations, illustrates how Aβ42 may assemble (Fig. 6). The initial phase of oligomerization involves formation of pentamer/hexamer units, paranuclei, that then associate to form large oligomers and protofibrils. The fact that at similar concentrations paranuclei were not observed for Aβ40 provides a plausible explanation for the distinct biological activity of oligomeric preparations of the two Aβ alloforms. Moreover, the data obtained here reveal how the primary structure difference between Aβ40 and Aβ42 is related to these distinct structure–activity relationships. The critical residue promoting the initial oligomerization of Aβ42 is Ile-41, whereas Ala-42 (and Thr-43) facilitate the self-association of paranuclei. Our results suggest that the paranuclei formed by Aβ42 may be important therapeutic targets.
Figure 6.
A simple model of Aβ42 assembly. Monomers rapidly oligomerize into paranuclei. Paranuclei themselves then can oligomerize to form larger, beaded structures. Paranuclei are the initial, and minimal, structural unit from which Aβ42 assemblies evolve. The equilibrium between monomer and paranucleus is rapid, as evidenced by the fact that paranuclei are detectable immediately after peptide dissolution. The conversion to protofibrils is slower (12), but is also reversible. Monomers, paranuclei, and large oligomers are predominately unstructured (U), but do contain β-sheet/β-turn (β) and helical (α) elements (see text). Protofibril formation involves substantial conformational rearrangements, during which unstructured, α-helix, and β-strand elements (U/α/β) transform into predominately β-sheet/β-turn structures. Protofibrils may form through the oligomerization of monomers into paranuclei, paranucleus self-association to form larger oligomers, and then maturation of these large oligomers into protofibrils. This “linear” pathway may not be the only one. Direct addition of monomers or paranuclei (dotted arrows) to protofibrils or fibrils cannot be ruled out. The final step in the overall pathway is protofibril maturation into fibrils, a process that appears irreversible, at least kinetically (38). The diameters of the protofibrils and fibrils are indicated, but the structures in the scheme are not drawn to scale.
Supplementary Material
Acknowledgments
We gratefully acknowledge Drs. Daniel Kirschner, Thomas Kodadek, and Jan Näslund for critical comments. This work was supported by National Institutes of Health Grants AG14366, AG18921, and NS38328 (to D.B.T.), by the Foundation for Neurologic Diseases (to D.B.T.), by the Massachusetts Alzheimer's Disease Research Center (1042312909A1, to G.B.), and by the Edward R. and Anne G. Lefler Foundation (to M.D.K.).
Abbreviations
- Aβ
amyloid β-protein
- DLS
dynamic light scattering
- EM
electron microscopy
- LMW
low molecular weight
- PICUP
photo-induced cross-linking of unmodified proteins
- SEC
size-exclusion chromatography
- AD
Alzheimer's disease
- RH
hydrodynamic radius
Footnotes
A comprehensive description of the materials and methods is published as supporting information on the PNAS web site, www.pnas.org.
References
- 1.Hardy J A, Higgins G A. Science. 1992;256:184–185. doi: 10.1126/science.1566067. [DOI] [PubMed] [Google Scholar]
- 2.Selkoe D J. J Neuropathol Exp Neurol. 1994;53:438–447. doi: 10.1097/00005072-199409000-00003. [DOI] [PubMed] [Google Scholar]
- 3.Hardy J. Proc Natl Acad Sci USA. 1997;94:2095–2097. doi: 10.1073/pnas.94.6.2095. [DOI] [PMC free article] [PubMed] [Google Scholar]
- 4.Glenner G G, Wong C W. Biochem Biophys Res Commun. 1984;120:885–890. doi: 10.1016/s0006-291x(84)80190-4. [DOI] [PubMed] [Google Scholar]
- 5.Masters C L, Simms G, Weinman N A, Multhaup G, McDonald B L, Beyreuther K. Proc Natl Acad Sci USA. 1985;82:4245–4249. doi: 10.1073/pnas.82.12.4245. [DOI] [PMC free article] [PubMed] [Google Scholar]
- 6.Klein W L, Krafft G A, Finch C E. Trends Neurosci. 2001;24:219–224. doi: 10.1016/s0166-2236(00)01749-5. [DOI] [PubMed] [Google Scholar]
- 7.Mucke L, Masliah E, Yu G Q, Mallory M, Rockenstein E M, Tatsuno G, Hu K, Kholodenko D, Johnson-Wood K, McConlogue L. J Neurosci. 2000;20:4050–4058. doi: 10.1523/JNEUROSCI.20-11-04050.2000. [DOI] [PMC free article] [PubMed] [Google Scholar]
- 8.Harper J D, Wong S S, Lieber C M, Lansbury P T. Chem Biol. 1997;4:119–125. doi: 10.1016/s1074-5521(97)90255-6. [DOI] [PubMed] [Google Scholar]
- 9.Walsh D M, Lomakin A, Benedek G B, Condron M M, Teplow D B. J Biol Chem. 1997;272:22364–22372. doi: 10.1074/jbc.272.35.22364. [DOI] [PubMed] [Google Scholar]
- 10.Oda T, Wals P, Osterburg H H, Johnson S A, Pasinetti G M, Morgan T E, Rozovsky I, Stine W B, Snyder S W, Holzman T F, et al. Exp Neurol. 1995;136:22–31. doi: 10.1006/exnr.1995.1080. [DOI] [PubMed] [Google Scholar]
- 11.Lambert M P, Barlow A K, Chromy B A, Edwards C, Freed R, Liosatos M, Morgan T E, Rozovsky I, Trommer B, Viola K L, et al. Proc Natl Acad Sci USA. 1998;95:6448–6453. doi: 10.1073/pnas.95.11.6448. [DOI] [PMC free article] [PubMed] [Google Scholar]
- 12.Walsh D M, Hartley D M, Kusumoto Y, Fezoui Y, Condron M M, Lomakin A, Benedek G B, Selkoe D J, Teplow D B. J Biol Chem. 1999;274:25945–25952. doi: 10.1074/jbc.274.36.25945. [DOI] [PubMed] [Google Scholar]
- 13.Hartley D M, Walsh D M, Ye C P P, Diehl T, Vasquez S, Vassilev P M, Teplow D B, Selkoe D J. J Neurosci. 1999;19:8876–8884. doi: 10.1523/JNEUROSCI.19-20-08876.1999. [DOI] [PMC free article] [PubMed] [Google Scholar]
- 14.Nilsberth C, Westlind-Danielsson A, Eckman C B, Condron M M, Axelman K, Forsell C, Stenh C, Luthman J, Teplow D B, Younkin S G, et al. Nat Neurosci. 2001;4:887–893. doi: 10.1038/nn0901-887. [DOI] [PubMed] [Google Scholar]
- 15.Walsh D M, Klyubin I, Fadeeva J V, Cullen W K, Anwyl R, Wolfe M S, Rowan M J, Selkoe D J. Nature. 2002;416:535–539. doi: 10.1038/416535a. [DOI] [PubMed] [Google Scholar]
- 16.Suzuki N, Cheung T T, Cai X-D, Odaka A, Otvos L, Jr, Eckman C, Golde T E, Younkin S G. Science. 1994;264:1336–1340. doi: 10.1126/science.8191290. [DOI] [PubMed] [Google Scholar]
- 17.Iwatsubo T, Odaka A, Suzuki N, Mizusawa H, Nukina N, Ihara Y. Neuron. 1994;13:45–53. doi: 10.1016/0896-6273(94)90458-8. [DOI] [PubMed] [Google Scholar]
- 18.Gravina S A, Ho L B, Eckman C B, Long K E, Otvos L, Jr, Younkin L H, Suzuki N, Younkin S G. J Biol Chem. 1995;270:7013–7016. doi: 10.1074/jbc.270.13.7013. [DOI] [PubMed] [Google Scholar]
- 19.Scheuner D, Eckman C, Jensen M, Song X, Citron M, Suzuki N, Bird T D, Hardy J, Hutton M, Kukull W, et al. Nat Med. 1996;2:864–870. doi: 10.1038/nm0896-864. [DOI] [PubMed] [Google Scholar]
- 20.Golde T E, Eckman C B, Younkin S G. Biochim Biophys Acta Mol Basis Dis. 2000;1502:172–187. doi: 10.1016/s0925-4439(00)00043-0. [DOI] [PubMed] [Google Scholar]
- 21.Weggen S, Eriksen J L, Das P, Sagi S A, Wang R, Pietrzik C U, Findlay K A, Smith T W, Murphy M P, Butler T, et al. Nature. 2001;414:212–216. doi: 10.1038/35102591. [DOI] [PubMed] [Google Scholar]
- 22.Younkin S G. Ann Neurol. 1995;37:287–288. doi: 10.1002/ana.410370303. [DOI] [PubMed] [Google Scholar]
- 23.Selkoe D J. Nature. 1999;399:A23–A31. doi: 10.1038/399a023. [DOI] [PubMed] [Google Scholar]
- 24.Dahlgren K N, Manelli A M, Stine W B, Baker L K, Krafft G A, LaDu M J. J Biol Chem. 2002;277:32046–32053. doi: 10.1074/jbc.M201750200. [DOI] [PubMed] [Google Scholar]
- 25.Jarrett J T, Berger E P, Lansbury P T., Jr Biochemistry. 1993;32:4693–4697. doi: 10.1021/bi00069a001. [DOI] [PubMed] [Google Scholar]
- 26.Teplow D B. Int J Exp Clin Invest. 1998;5:121–142. doi: 10.3109/13506129808995290. [DOI] [PubMed] [Google Scholar]
- 27.Bitan G, Lomakin A, Teplow D B. J Biol Chem. 2001;276:35176–35184. doi: 10.1074/jbc.M102223200. [DOI] [PubMed] [Google Scholar]
- 28.Fezoui Y, Hartley D M, Harper J D, Khurana R, Walsh D M, Condron M M, Selkoe D J, Lansbury P T, Fink A L, Teplow D B. Int J Exp Clin Invest. 2000;7:166–178. doi: 10.3109/13506120009146831. [DOI] [PubMed] [Google Scholar]
- 29.Lomakin A, Benedek G B, Teplow D B. Methods Enzymol. 1999;309:429–459. doi: 10.1016/s0076-6879(99)09029-1. [DOI] [PubMed] [Google Scholar]
- 30.Lomakin A, Chung D S, Benedek G B, Kirschner D A, Teplow D B. Proc Natl Acad Sci USA. 1996;93:1125–1129. doi: 10.1073/pnas.93.3.1125. [DOI] [PMC free article] [PubMed] [Google Scholar]
- 31.Kirkitadze M D, Condron M M, Teplow D B. J Mol Biol. 2001;312:1103–1119. doi: 10.1006/jmbi.2001.4970. [DOI] [PubMed] [Google Scholar]
- 32.Fancy D A, Kodadek T. Proc Natl Acad Sci USA. 1999;96:6020–6024. doi: 10.1073/pnas.96.11.6020. [DOI] [PMC free article] [PubMed] [Google Scholar]
- 33.Serpell L C. Biochim Biophys Acta. 2000;1502:16–30. doi: 10.1016/s0925-4439(00)00029-6. [DOI] [PubMed] [Google Scholar]
- 34.Nybo M, Svehag S E, Nielsen E H. Scand J Immunol. 1999;49:219–223. doi: 10.1046/j.1365-3083.1999.00526.x. [DOI] [PubMed] [Google Scholar]
- 35.Serio T R, Cashikar A G, Kowal A S, Sawicki G J, Moslehi J J, Serpell L, Arnsdorf M F, Lindquist S L. Science. 2000;289:1317–1321. doi: 10.1126/science.289.5483.1317. [DOI] [PubMed] [Google Scholar]
- 36.Xu S H, Bevis B, Arnsdorf M F. Biophys J. 2001;81:446–454. doi: 10.1016/S0006-3495(01)75712-8. [DOI] [PMC free article] [PubMed] [Google Scholar]
- 37.Blackley H K L, Sanders G H W, Davies M C, Roberts C J, Tendler S J B, Wilkinson M J. J Mol Biol. 2000;298:833–840. doi: 10.1006/jmbi.2000.3711. [DOI] [PubMed] [Google Scholar]
- 38.Lomakin A, Teplow D B, Kirschner D A, Benedek G B. Proc Natl Acad Sci USA. 1997;94:7942–7947. doi: 10.1073/pnas.94.15.7942. [DOI] [PMC free article] [PubMed] [Google Scholar]
Associated Data
This section collects any data citations, data availability statements, or supplementary materials included in this article.


