

Abstract
The deletion of the gene for the regulatory subunit of protein kinase A (PKA) results in constitutively active PKA in the pkaR mutant. To investigate the role of PKA in the basic motile behavior and chemotaxis of Dictyostelium discoideum, pkaR mutant cells were subjected to computer-assisted two- and three-dimensional motion analysis. pkaR mutant cells crawled at only half the speed of wild-type cells in buffer, chemotaxed in spatial gradients of cyclic AMP (cAMP) but with reduced efficiency, were incapable of suppressing lateral pseudopods in the front of temporal waves of cAMP, a requirement for natural chemotaxis, did not exhibit the normal velocity surge in response to the front of a wave, and were incapable of chemotaxing toward an aggregation center in natural waves generated by wild-type cells that made up the majority of cells in mixed cultures. Many of the behavioral defects appeared to be the result of the constitutively ovoid shape of the pkaR mutant cells, which forced the dominant pseudopod off the substratum and to the top of the cell body. The behavioral abnormalities that pkaR mutant cells shared with regA mutant cells are discussed by considering the pathway ERK2 —| RegA —| [cAMP] → PKA, which emanates from the front of a wave. The results demonstrate that cells must suppress PKA activity in order to elongate along a substratum, suppress lateral-pseudopod formation, and crawl and chemotax efficiently. The results also implicate PKA activation in dismantling cell polarity at the peak and in the back of a natural cAMP wave.
As a population of Dictyostelium amoebae aggregate to a center, each amoeba must respond to the different phases of relayed, outwardly moving, nondissipating symmetric waves of the chemoattractant cyclic AMP (cAMP) (Fig. 1). In the front of each wave, cells experience a positive spatial gradient of cAMP (i.e., the concentration increases in the direction of the aggregation center) and an increasing temporal gradient of cAMP (i.e., the concentration increases with time). At the peak of each wave, cells experience a cAMP concentration that causes cellular depolarization, and in the back of each wave, cells experience a negative spatial gradient of cAMP (i.e., the concentration decreases in the direction of the aggregation center) and a decreasing temporal gradient of cAMP (i.e., the concentration decreases with time) (Fig. 1). Amoebae respond to each phase of a natural wave in a distinct and reproducible fashion, resulting in a sequence of behaviors that together represent the natural chemotactic response (29, 32, 37, 40, 41, 47, 48). In the absence of any external chemotactic signal, Dictyostelium amoebae translocate at near-maximum velocity and turn frequently (47, 48). We propose that this basic motile behavior is modulated in the different phases of the natural wave, with the net result of directing cells into the aggregation center (29) (Fig. 1). During aggregation, cells are exposed to a series of waves with an average periodicity of 7 min (1). With each wave, translocation toward the aggregation center is restricted to a period of approximately 2 min while the amoebae are in the front of the wave (29, 40, 47, 48).
FIG. 1.

Model describing cell behavior in the different phases of the natural wave and the relationship of the wave to the basic motile behavior of a cell. The wave is separated into four phases, A, B, C, and D. Descriptions of the behavior of cells in each phase and the characteristics of the wave responsible for these behaviors were derived from previous studies (29, 37, 38, 40, 41, 47, 49). Vertical arrows represent regulatory pathways emanating from the different phases of the wave which target machinery involved in basic motile behavior, leading to the cell behaviors specific to each phase of the wave (29).
We have developed a number of specific experimental protocols to test whether the basic motile behavior of cells in buffer and/or the specific responses of cells to the different phases of a natural wave are defective in a particular mutant (29, 41, 47, 48). Employing these protocols and computer-assisted methods for quantitating cell motility (27, 28, 30, 31, 43), we have analyzed mutants lacking the regulatory subunit of the cAMP-dependent protein kinase A (PKA) (22, 23) in order to investigate the role of PKA in basic cell motility and chemotaxis. PKA is composed of a regulatory and a catalytic subunit (8). When cAMP binds to the regulatory subunit, it dissociates from the catalytic subunit and no longer inhibits it. Cells lacking the regulatory subunit as a consequence of mutation in their structural gene contain constitutively active PKA. Our results demonstrate that PKA activity must be suppressed in order for cells to elongate along a substratum, suppress lateral-pseudopod formation, and crawl and chemotax efficiently. Our results are also consistent with the idea that PKA activation has a role in dismantling cell polarity at the peak and in the back of a natural cAMP wave.
MATERIALS AND METHODS
Origin of control and pkaR mutant strains.
The mutant strain DG1075, which harbors a mutation in the regulatory subunit of PKA, was isolated from a pool of morphologically aberrant cell lines generated from strain Ax4 by DpnII REMI mutagenesis (22). The BSR1 plasmid was shown to have integrated at bp 973 of pkaR. The mutant strains 108d2 and 108d3, derived from strain Ax4, in which pkaR was disrupted at the EcoRV site by homologous recombination, have previously been described in detail (23). In both independent isolates selected for homologous recombination with the BSR1 plasmid, pkaR sequences were demonstrated to be flanked by the BSR cassette.
Maintenance and development of strains.
Cells of the parental Ax4 strain and the pkaR mutant strains DG1075, 108d2, and 108d3 were frozen in 7.5% dimethyl sulfoxide in HL-5 medium and stored at −80°C (33). For experimental purposes, cells were reconstituted every 3 weeks from stock cultures by being grown in suspension in HL-5 medium. Mutant strains were maintained in HL-5 medium supplemented with 5 μg of Blasticidin S/ml for mutant selection. For experimental purposes, mutant cells were grown for one generation in the absence of the drug. To initiate development, cells were grown to a density of 2 × 10⁶ to 5 × 10⁶ cells per ml, washed free of nutrients in basic salts solution (BSS; 20 mM KCl, 2.5 mM MgCl2, and 20 mM KH2PO4 [pH 6.4]), and then dispersed onto filter pads saturated with BSS as a smooth carpet at a density of 5 × 10⁶ cells per cm2 (26). For motility experiments in buffer and in spatial and temporal gradients of cAMP (see below), cells were harvested at the ripple stage, which represents the onset of aggregation under these conditions (25). The ripple stage occurred in pkaR mutant cultures approximately 1 h earlier than in control cultures under the conditions employed.
Analysis of basic motile behavior.
The methods for analyzing the basic motile behavior (Fig. 1) of cells have been described previously in detail (41, 47, 48). In brief, cells were inoculated into a Sykes-Moore chamber (Bellco Glass, Vineland, N.J.), the chamber was inverted and positioned on the stage of an upright microscope, and cell behavior was viewed through a 10× or 25× objective. The chamber was perfused with buffer at a rate that turned over the liquid volume every 15 s.
Analysis of cell motility in spatial and temporal gradients of cAMP.
The methods for analyzing in two dimensions (2D) the behavioral responses of cells to spatial and temporal gradients of cAMP have been described in detail previously (36-38, 41, 47, 48). To monitor in three dimensions (3D) the behavior of individual amoebae responding to simulated temporal waves of cAMP, 350 μl of a dilute suspension of cells was inoculated into a Dvorak-Stotler chamber (Lucas-Highland Inc., Chantilly, Va.) as previously described (42). The chamber was positioned on the stage of a Zeiss ICM 405 inverted microscope equipped with differential interference contrast optics and a Planapo 63× oil immersion objective. To obtain optical sections of the cells for 3D reconstruction (11, 31, 46), the coarse-focus knob of the microscope was connected to a customized stepper motor. Sixty optical sections were automatically collected in 2 s from the z axis at 0.3-μm increments. This process was repeated at 5-s intervals. Images were recorded onto digital videotape through a cooled charge-coupled-device camera (Zeiss Inc., Thornwood, N.J.) and subsequently transferred into a Macintosh computer equipped with a Data Translation (Marlboro, Mass.) frame grabber board capable of acquiring images at 30 frames per s with Adobe Premiere software (Adobe Systems Inc., San Jose, Calif.).
Analysis of cell behavior after rapid addition of 1 μM cAMP.
The methods for analyzing the response of cells to the rapid addition of 1 μM cAMP, the peak concentration in the natural wave, have previously been described in detail (42, 48).
Analysis of cell motility in natural aggregation territories.
To analyze the behavior of cells in natural aggregation territories, exponentially growing cells were washed free of nutrients and suspended in BSS at a concentration of 2.4 × 10⁶ cells per ml according to methods previously described (9). Wave propagation was analyzed by using the vector flow program of DIAS (9, 11, 31). The user selects a rectangular region of interest and the direction toward the aggregation center. When no aggregation center was apparent, an arbitrary point was selected. The behavior of each cell in the rectangle was converted into a vector, the length of which was proportional to the extent of translocation and the direction of which was the average for the cell track in the period of analysis. The vectors in the selected rectangular region were smoothed in a Tukey window to remove noise and artificial vectors. The magnitudes of the vector components parallel to the selected direction were averaged and plotted over time to form a vector flow plot. In a vector flow plot, the x axis represents time and the y axis represents the direction and extent of the displacement of cells in an aggregation territory.
Analysis of mutant cells in wild-type cell territories.
To test the behavior of mutant cells in wild-type cell aggregation territories, pkaR mutant cells were stained with the vital dye DiI (Molecular Probes, Inc., Eugene, Oreg.) and mixed with unlabeled Ax4 cells (10% pkaR mutant cells and 90% Ax4 cells) and their motion during aggregation was analyzed according to methods previously described (47, 48). Cells were imaged with a laser scanning confocal microscope (NORAN, Middleton, Wis.). Transmitted light images were continuously collected through a transmitted light detector. Settings in Oz Intervision software (NORAN) were selected so that cells were exposed for 0.5 s every 20 s to laser light at an intensity of 20% and at an excitation of 568 nm and an emission of greater than 590 nm.
2D computer-assisted analysis.
Cell behavior was either directly digitized or videorecorded and subsequently digitized into DIAS data files. Perimeters of cells in buffer, in spatial gradients of cAMP, in simulated temporal waves of cAMP, or in natural waves of cAMP were automatically outlined in 2D by using primarily the gray-scale threshold option of the DIAS program (27, 30, 31). Outlines were then converted to beta-spline replacement images that were used to compute motility and dynamic morphology parameters described in detail elsewhere (27, 30).
3D reconstruction and motion analysis.
The reconstruction of a 3D faceted image of the cell surface and the computation of 3D parameters are described elsewhere in detail (11, 31, 46). Briefly, the perimeter of the in-focus portion of the image in each optical section was automatically outlined by 3D-DIAS software by using a pixel complexity algorithm (30, 31). The interface between the particulate cytoplasm of the main cell body and the nonparticulate cytoplasm of the pseudopodial extensions was readily identified in differential interference contrast images of optical sections. The distal nonparticulate zones of all pseudopods were manually outlined at the in-focus portions of each optical section to generate a faceted 3D reconstruction of pseudopods that were color-coded red and inserted into the faceted cell image (46). The faceted image of the cell with the color-coded pseudopods could be viewed at any angle dynamically in 3D through a Crystal Eyes 3D display station (Stereographics, San Raphael, Calif.). The 3D position of the centroid of the cell was computed by averaging the x, y, and z coordinates of all points interior to the 3D faceted cell image. 3D motility and dynamic morphology parameters have been previously described in detail (27).
Fluorescent microscopic analysis of myosin II, F-actin, and tubulin.
For actin and myosin II localization, cells were fixed with 4% paraformaldehyde in 10 mM MES (morpholineethanesulfonic acid) buffer (pH 6.1) with 138 mM KCl, 3 mM MgCl2, and 2 mM EGTA to preserve the cytoskeletons. For tubulin localization, cells were fixed in Pen-Fix (Richard-Allan Scientific, Kalamazoo, Mich.). In both protocols, cells were fixed for 10 min at room temperature. Prior to immunostaining of cells for myosin II, antigen retrieval was performed by processing cells in Target retrieval solution (Dako Corp., Carpinteria, Calif.) in a steamer for 20 min at 90°C according to the manufacturer's recommendations. The polyclonal anti-myosin II antibody was a generous gift from Arturo De Lozanne (University of Texas at Austin). Tubulin immunolocalization was performed with the monoclonal antibody 12G10, obtained from the Developmental Studies Hybridoma Bank at the University of Iowa. To block nonspecific binding, cells were first treated with 10% normal goat serum in Tris-buffered saline (TBS). Cells were then incubated with rabbit anti-myosin II antibody (dilution, 1/1,000) or mouse anti-tubulin antibody (undiluted) in TBS for 45 min at 37°C. After being extensively rinsed with TBS, cells were stained with fluorescein isothiocyanate-labeled goat anti-rabbit antibody (dilution, 1/200) or goat anti-mouse antibody (Jackson ImmunoResearch, West Grove, Pa.) for 30 min at room temperature. Cells were stained for F-actin with Oregon Green-phalloidin (Molecular Probes, Inc.) according to methods previously described (42). Coverslips were mounted by using Moviol (Sigma, St. Louis, Mo.) with azide. Images were captured with a Zeiss LSM 510 laser scanning confocal microscope in the Central Microscopy Facility at the University of Iowa.
RESULTS
pkaR mutant cells are defective in aggregation.
pkaR mutant cells formed small aggregates on development pads. When dispersed on nonnutrient agar at low density, they failed to form streams (Fig. 2). To test whether aggregating pkaR mutant cells exhibited the rhythmic behavior of wild-type cells during aggregation, a characteristic reflecting the responses of cells to the outwardly moving, nondissipating waves of cAMP relayed through normal aggregation territories, cell populations on agar were analyzed by vector flow plot technology provided by DIAS software (9, 11, 28). While wild-type Ax4 cells exhibited surges toward the aggregation center with an average periodicity of 7 min (Fig. 2A), pkaR mutant cells appeared to move randomly (Fig. 2B), indicating impairment in the production of and/or in the response to cAMP waves.
FIG. 2.

pkaR mutant cells are defective in natural aggregation. The behavior of wild-type (Ax4) (A) and pkaR mutant (108d3) (B) cells in monolayers on nonnutrient agar was analyzed. For each cell type, a representative field of cells was videorecorded for 120 min and their motion was analyzed with the 2D-DIAS vector flow program (19, 28). For each cell type, representative video images at 20, 60, and 100 min are shown. In the vector flow plots, the magnitudes of the vector components parallel to the selected direction of the aggregation center for Ax4 cells and parallel to an arbitrary direction for 108d3 cells were averaged and plotted over time. The x axis represents time, and the y axis represents the direction (+ or −) and extent of the displacement of cells. Note that while Ax4 cells form streams, pkaR mutant cells do not and that while Ax4 cells exhibit cyclic surges toward the aggregation center, pkaR mutant cells do not.
pkaR mutant cells are impaired in their response to natural cAMP waves.
To test whether pkaR mutant cells were impaired in their response to waves of cAMP produced by wild-type cells, cells of strain DG1075 or strain 108d3 were labeled with DiI to identify them and then mixed with unlabeled Ax4 cells at a ratio of 1:9 and their motion was analyzed. The dynamics of the outwardly moving waves of cAMP generated by the predominantly wild-type cell population were assessed by the behavior of unlabeled Ax4 cells in the immediate vicinity of a labeled pkaR mutant cell. Unlabeled Ax4 cells moved in surges toward the aggregation center (Fig. 3A and C). Centroid tracks of individual Ax4 cells were directed toward the aggregation center and included periods of rapid translocation (presumably in response to the front of the wave) separated by periods of reduced translocation (presumably in response to the peak and back of the wave) (Fig. 3A and C). This behavior was reflected in velocity plots, which showed peaks and troughs with periods of 5.1 min for the two representative Ax4 cells in Fig. 3A and C. In marked contrast to those of neighboring Ax4 cells, the centroid tracks of pkaR mutant cells were clustered, velocities were generally depressed, and the peaks and troughs in velocity plots were far more erratic (Fig. 3B and D). These distinct behaviors were observed for 18 additional Ax4 cells, 4 additional strain DG1075 cells, and 4 additional strain 108d3 cells, demonstrating that pkaR mutant cells are defective in their response to natural cAMP waves. Reverse-mixing experiments, in which DiI-labeled Ax4 cells were mixed with 10-fold more unlabeled pkaR mutant cells, revealed the random behavior of wild-type cells, indicating that populations of pkaR mutant cells did not generate a series of relayed, outwardly moving, nondissipating chemotactic waves (data not shown).
FIG. 3.

pkaR mutant cells are impaired in their response to natural cAMP waves. The behavior of individual wild-type (Ax4) and pkaR mutant (DG1075 [1075] and 108d3) cells in aggregation territories composed of 90% Ax4 cells and 10% mutant cells was analyzed. In the top of each panel, a plot of the instantaneous velocity of the representative cell under analysis is shown, and at the bottom of each panel a centroid track is presented. The instantaneous velocity plots were smoothed 10 times with Tukey windows of 10, 20, 40, 20, and 10. The arrows denote the direction toward the aggregation center assessed from the behavior of the predominant Ax4 cells. For each pair (A and B and C and D), the Ax4 cell was the closest neighbor to the analyzed pkaR mutant cell. per, average period of velocity peaks in minutes; pk, average peak velocity in micrometers per minute; tr, average trough velocity in micrometers per minute; Inst. Vel., instantaneous velocity; Agg. Center, aggregation center.
pkaR mutant cells exhibit altered basic motile behavior.
To understand why pkaR mutant cells did not respond normally to a natural chemotactic wave, we first characterized basic motile behavior in the absence of a chemotactic signal by using 2D-DIAS. When compared with Ax4 cells, pkaR mutant cells exhibited significant reductions in average instantaneous velocity, a measure of cellular velocity based on the position of the cell centroid, and in average positive flow, a measure of cellular translocation based on area displacement per unit of time (27) (Table 1). pkaR mutant cells were also wider and rounder than Ax4 cells (Table 1).
TABLE 1.
2D-DIAS analysis of the behavior of pkaR mutant cells in buffera
| Cell type | No. of cells tested | Inst. velocity (μm/min) | Pos. flow (%/4 s) | Max. width (μm) | Rnd. (%) |
|---|---|---|---|---|---|
| Ax4 | 33 | 13.4 ± 4.2 | 24 ± 28 | 9.2 ± 1.5 | 43 ± 9 |
| pkaR mutant (DG1075) | 34 | 6.6 ± 2.0 | 9 ± 4 | 10.4 ± 2.1 | 52 ± 7 |
| pkaR mutant (108d3) | 37 | 8.0 ± 2.7 | 12 ± 4 | 11.3 ± 2.4 | 53 ± 12 |
The behavior of each cell was analyzed in 2D over a 10-min period while the cell was perfused with buffer in a Sykes-Moore chamber. Images were digitized at 4-s intervals. Values are means ± standard deviations. Inst. velocity, instantaneous velocity; Pos. flow, positive flow; Max. width, maximum width; Rnd, roundness. Student's t test was used to obtain P values. A P value below 0.050 was considered significant. t test comparisons between strains Ax4 and DG1075 and between strains Ax4 and 108d3 revealed that the differences between Ax4 cells and both mutant strains were significant for all parameters.
Since instantaneous velocity can be affected by the frequency of lateral-pseudopod formation, pseudopod formation by Ax4 and pkaR mutant cells translocating in buffer was compared. A lateral pseudopod was defined as a projection containing primarily particulate-free cytoplasm, attaining a minimum area of 5% of total cell area, and projecting from the main axis of translocation at an angle of ≥30°. While Ax4 cells translocating in buffer formed lateral pseudopods at an average frequency of 4 per 10 min, 108d3 and DG1075 cells translocating in buffer formed lateral pseudopods at approximately twice that frequency, 9 and 8 per 10 min, respectively (Table 2). Together, these 2D results demonstrate that pkaR mutant cells in buffer are rounder and slower and form lateral pseudopods more frequently than wild-type cells.
TABLE 2.
2D-DIAS analysis of lateral-pseudopod formation by pkaR mutant cells and control cells in buffer and in a spatial gradient of cAMPa
| Condition | Cell type | No. of cells | % that formed (every 10 min):
|
No. of lat. pseud. formed per 10 minb | ||
|---|---|---|---|---|---|---|
| ≤4 pseud. | 5 to 9 pseud. | ≥10 pseud. | ||||
| Buffer | Ax4 | 44 | 64 | 36 | 0 | 4.1 |
| pkaR mutant 108d3 | 34 | 3 | 53 | 44 | 9.3 | |
| pkaR mutant DG1075 | 36 | 14 | 53 | 33 | 7.9 | |
| Spatial gradient of cAMP | Ax4 | 51 | 98 | 2 | 0 | 1.6 |
| pkaR mutant 108d3 | 24 | 58 | 42 | 0 | 3.0 | |
| pkaR mutant DG1075 | 31 | 65 | 32 | 3 | 3.9 | |
A lateral pseudopod (lat. pseud.) is defined in the text.
Chi-square tests were performed to test the significance of the differences between Ax4 and the two mutant strains in the number of lateral pseudopods formed in 10 min. Both in buffer and in spatial gradients of cAMP, the frequency of lateral-pseudopod formation by wild-type cells was significantly lower (P < 0.05) than that by either mutant.
pkaR mutant cells chemotax, but less efficiently than wild-type cells, in a spatial gradient of cAMP.
To test whether pkaR mutant cells can assess and crawl in a directed fashion up a steep spatial gradient of cAMP, the presumed mechanism for establishing directionality in the front of a wave, cell behavior in a spatial gradient of cAMP generated in a gradient chamber (36, 49) was analyzed by using 2D-DIAS software. pkaR mutant cells were capable of positive chemotaxis, as evidenced by positive average chemotactic indices above +0.10 (Table 3). However, the average chemotactic indices were roughly half that of parental wild-type cells (Table 3). In addition, pkaR mutant cells exhibited a reduction in average instantaneous velocity, a significant increase in directional change, a parameter reflecting turning frequency, and a significant increase in roundness (Table 3). Far fewer mutant cells than Ax4 cells achieved chemotactic indices of at least +0.80 (data not shown). Perimeter tracks of pkaR mutant cells with the highest chemotactic indices (Fig. 4B and C) were more compressed than those of Ax4 cells with the highest indices (Fig. 4A), reflecting lower average translocation velocities during chemotaxis in a spatial gradient of cAMP. The tracks of pkaR mutant cells also contained more sharp turns on average than those of Ax4 cells. Since sharp turns are usually caused by the formation of lateral pseudopods on the substratum (44, 45), this result suggested that pkaR mutant cells were less efficient in suppressing lateral-pseudopod formation when chemotaxing up a spatial gradient of cAMP. To test this possibility directly, the frequencies of lateral-pseudopod formation by Ax4 and pkaR mutant cells were compared by using the same scoring method described for cells in buffer (Table 2). Although pkaR mutant cells suppressed lateral-pseudopod formation in spatial gradients of cAMP, mutant cells still formed on average approximately twice as many lateral pseudopods per unit of time as Ax4 cells, the same difference observed between these groups in buffer (Table 2). These results demonstrate that although pkaR mutant cells are capable of assessing a spatial gradient of cAMP and moving in a directed fashion up the gradient, they do so less efficiently than Ax4 cells.
TABLE 3.
2D-DIAS analysis of the behavior of pkaR mutant cells in a spatial gradient of cAMPa
| Cell type | No. of cells tested | Inst. velocity (μm/min) | Directional change (°/min) | Area (μm2) | Rnd. (%) | Pos. flow (%/4 s) | Chemo. index |
|---|---|---|---|---|---|---|---|
| Ax4 | 51 | 7.8 ± 2.0 | 25 ± 9 | 104 ± 32 | 52 ± 7 | 8.3 ± 6.3 | +0.60 ± 0.24 |
| pkaR mutant (DG1075) | 33 | 4.9 ± 1.6 | 38 ± 13 | 125 ± 55 | 58 ± 11 | 5.8 ± 3.7 | +0.30 ± 0.36 |
| pkaR mutant (108d3) | 25 | 4.4 ± 2.3 | 45 ± 15 | 111 ± 33 | 58 ± 11 | 5.3 ± 1.6 | +0.35 ± 0.31 |
After a 5-min incubation on the bridge of a spatial gradient chamber, each cell was analyzed in 2D over a 10-min period. Images were digitized at 4-s intervals. Values are means ± standard deviations. Abbreviations are as defined in the footnote to Table 1. Chemo. index, chemotactic index. Student's t test was used to obtain P values. A P value below 0.050 was considered significant. t test comparisons between strains Ax4 and DG1075 and between strains Ax4 and 108d3 were significant for all parameters, with the exception of the areas for strains Ax4 and 108d3.
FIG. 4.

Computer-generated perimeter tracks reveal that pkaR mutant cells translocate at lower velocities and turn more often than Ax4 cells in a spatial gradient of cAMP. Tracks of the three Ax4 cells (A) and the three pkaR mutant cells (B and C) with the highest chemotactic indices are shown. Cell perimeters were drawn every 4 s. 1075, DG1075.
pkaR mutant cells behave aberrantly in the front of temporal waves of cAMP.
To test whether pkaR mutant cells respond normally to the temporal and concentration components of a natural wave, they were challenged with four temporal waves of cAMP generated under conditions in which spatial gradients of cAMP were not established. As previously reported (35, 36, 40, 47, 48), wild-type cells did not respond to the first wave but then exhibited an increase in velocity in the front and a decrease in velocity at the peak and in the back of each of the three subsequent waves (Fig. 5A). In marked contrast, pkaR mutant cells did not undergo increases in velocity in the front of the last three in a series of four simulated temporal waves of cAMP (Fig. 5B and C).
FIG. 5.

pkaR mutant cells behave aberrantly in the front of temporal waves of cAMP. The instantaneous velocities (Inst. Vel.) of a representative Ax4 cell (A), a representative 108d3 cell (B), and a representative DG1075 (1075) cell (C) during four simulated temporal waves of cAMP generated in a perfusion chamber are plotted as a function of time. The concentration of cAMP (cAMP Conc.; top lines), estimated in dye experiments, is presented as a function of time through the four waves. Instantaneous velocity plots were smoothed 10 times with Tukey windows of 10, 20, 40, 20, and 10. Note that, unlike the Ax4 cell, pkaR mutant cells do not exhibit a velocity surge in the front of waves 2, 3, and 4.
2D-DIAS reconstruction of cell perimeters revealed that after the first wave, Ax4 cells suppressed lateral-pseudopod formation and exhibited an elongate morphology as they moved with increased velocity in the front of each of the last three waves, rounded up as they stopped translocating at the peak of each of these waves, and resumed pseudopod formation, but in all directions, in the back of each of these waves (data not shown). Although pkaR mutant cells suppressed lateral-pseudopod formation in the front of each of the last three temporal waves, they still formed them at five times the frequency of Ax4 cells (3.7 ± 1.0 pseudopods per wave for 108d3 cells versus 0.7 ± 0.7 pseudopods per wave for Ax4 cells) (Table 4). pkaR mutant cells were also far less elongate than Ax4 cells in the front of each temporal wave, remaining relatively round through all phases of each wave (data not shown).
TABLE 4.
pkaR mutant cells fail to suppress lateral-pseudopod formation in the front of simulated temporal waves of cAMP
| Cell type | Individual analyzed cell | No. of lateral pseudopods formed during the 3.5-min increasing phase ofa:
|
Total mean no. of lateral pseudopods at front of wave ± SDb | ||
|---|---|---|---|---|---|
| Wave 2 | Wave 3 | Wave 4 | |||
| Ax4 | 1 | 2 | 0 | 1 | |
| 2 | 2 | 1 | 1 | ||
| 3 | 1 | 1 | 0 | ||
| 4 | 0 | 0 | 0 | ||
| 5 | 0 | 1 | 0 | ||
| Mean ± SD | 1 ± 1 | 0.6 ± 0.5 | 0.4 ± 0.5 | 0.7 ± 0.7 | |
| pkaR mutant (108d3) | 1 | 3 | 4 | 3 | |
| 2 | 4 | 3 | 4 | ||
| 3 | 2 | 3 | 4 | ||
| 4 | 3 | 4 | 4 | ||
| 5 | 6 | 4 | 5 | ||
| Mean ± SD | 3.6 ± 1.5 | 3.6 ± 0.5 | 4.0 ± 0.7 | 3.7 ± 1.0 | |
A lateral pseudopod is defined methodologically in the text. The dynamics of lateral-pseudopod formation during wave 1 in a series of four are not reported because cells do not respond to the first wave in a series (37, 41).
Using Student's t test, we demonstrated that the difference in the mean numbers of lateral pseudopods formed by Ax4 and pkaR mutant cells at the front of waves 2, 3, and 4 was highly significant.
The abnormalities in pseudopod dynamics and in the shape of pkaR mutant cells in temporal waves were evident in 3D-DIAS reconstructions. In the front of each of the last three in a series of four waves, Ax4 cells became elongate, extending a single dominant anterior pseudopod along the substratum (Fig. 6A). The few lateral pseudopods that formed were extended off the substratum and retracted (Fig. 6A, data for 0 to 10 s). At the peak of the wave, Ax4 cells rounded up primarily in the x and y axes and retracted their dominant anterior pseudopods (Fig. 6B). In the back of the wave, Ax4 cells resumed pseudopod formation but extended new pseudopods in all directions (Fig. 6C). The shape of Ax4 cells remained relatively round in the back of the wave. In every Ax4 cell reconstructed in 3D, it was evident that while the periphery of the cell contacted the substratum in the front of the wave (Fig. 6A), it receded from the substratum at the peak and in the back of the wave (Fig. 6B and C). In marked contrast to wild-type cells, pkaR mutant cells in the front of a wave were ovoid (Fig. 7A). In addition, the dominant pseudopods usually formed off rather than on the substratum and were morphologically more complex in contour than the anterior pseudopods of Ax4 cells, frequently fragmenting. The dominant pseudopods of pkaR mutant cells did contact the substratum in the front of the wave at times, but contact was far more transient (Fig. 7A). At the peak of the wave, pkaR mutant cells remained ovoid and retracted their dominant pseudopods (Fig. 7B) in a fashion similar to that of Ax4 cells (Fig. 6B). In the back of the wave, pkaR mutant cells retained their ovoid shape and resumed pseudopod formation, extending the pseudopods in all directions in a fashion similar to that of Ax4 cells (Fig. 7C). The periphery of pkaR mutant cells receded from the substratum in the front (Fig. 7A) as well as at the peak and in the back (Fig. 7B and C, respectively) of the wave. These distinct morphological and general behaviors were observed in nine additional Ax4 cells and nine additional pkaR mutant cells reconstructed in 3D through the third in a series of four temporal waves. 3D-DIAS reconstructions of Ax4 and pkaR mutant cells in buffer (data not shown) revealed the same morphological differences observed in the front of the wave.
FIG. 6.

3D reconstructions of a representative Ax4 cell in the front (A), at the peak (B), and in the back (C) of a simulated temporal wave of cAMP generated in a perfusion chamber. Nonparticulate pseudopodial zones are demarcated in red. The cell is viewed at each time point at angles of 15 and 60° from the surface. Note that the Ax4 cell is elongate along the substratum in the front of the wave, rounds up and retracts the dominant pseudopod at the peak of the wave, and resumes pseudopod formation but in all directions and without cell elongation in the back of the wave. The behavior of this cell is representative of that of nine additional Ax4 cells reconstructed in 3D in a similar fashion.
FIG. 7.

3D reconstructions of a representative pkaR mutant cell in the front (A), at the peak (B), and in the back (C) of a simulated temporal wave of cAMP generated in a perfusion chamber. Nonparticulate pseudopodial zones are demarcated in red. The cell is viewed at each time point at angles of 15 and 60° from the surface. Note that pkaR mutant cells remain ovoid throughout the three phases of the wave. Note also that pkaR mutant cells retract the dominant pseudopod at the peak of the wave and resume apolar pseudopod formation in the back of a wave. The behavior of this cell is representative of that of nine additional pkaR mutant cells reconstructed in 3D in a similar fashion.
pkaR mutant cells respond to the rapid addition of 1 μM cAMP.
The rapid addition of 1 μM cAMP to cells crawling in buffer causes a rapid loss of cellular polarity and a rapid cessation of persistent cellular translocation, behaviors which have been compared to those at the peak of a simulated temporal or natural wave of cAMP (42, 47, 48). In Fig. 8, centroid tracks of Ax4 and pkaR mutant cells treated with 1 μM cAMP in such a fashion are compared. For each cell, the total track before and after the addition of cAMP (0 to 13.2 min), that portion of the track before the addition (0 to 6.6 min), and that portion after the addition (6.6 to 13.2 min) are individually displayed. In the case of Ax4 cells, the rapid addition of 1 μM cAMP resulted in a rapid reduction in velocity and loss of translocation persistence, as evidenced by the clustering of centroids after the addition (Fig. 8A). An analysis of perimeter tracks of Ax4 cells revealed a dramatic increase in roundness within 20 s after the addition of cAMP (data not shown), reflected in the increase in the roundness parameter (Fig. 8A). After the addition of cAMP, it was more difficult to discriminate a change in behavior in pkaR mutant cells along the total centroid track (Fig. 8B). However, when that portion of the track before the addition of cAMP and that portion after the addition of cAMP were displayed separately, differences were apparent. The centroid tracks after the addition were consistently more condensed (Fig. 8B). This was reflected in a decrease in the instantaneous velocity of each individually analyzed cell. An analysis of perimeter tracks did not reveal changes in the shape of pkaR mutant cells after the addition of cAMP (data not shown). However, measures of the average roundness parameter revealed a small increase after the addition of cAMP (Fig. 8B). These results support 3D reconstruction data indicating that pkaR mutant cells respond to the peak of a wave of cAMP.
FIG. 8.

pkaR mutant cells in buffer respond in an apparently normal fashion to the rapid addition of 1 μM cAMP. Centroid tracks of three representative Ax4 (A) and three representative pkaR mutant (108d3) (B) cells responding to the rapid addition of 1 μM cAMP are shown. The total track, that portion of the track before the addition of cAMP (in buffer), and that portion of the track after the addition of cAMP are shown for each representative cell. Inst. Vel., instantaneous velocity; Rnd., roundness parameter.
Cytoskeletons of pkaR mutant cells.
3D-DIAS reconstructions revealed that pkaR mutant cells were constitutively ovoid, suggesting a defect in their cytoskeletons. We therefore examined the distribution of the major cytoskeletal elements F-actin, myosin II, and tubulin. Phalloidin-stained F-actin localized to the pseudopods of Ax4 cells translocating in buffer (Fig. 9A and B). In the front of a temporal wave of cAMP, F-actin localized to the cortex as well as to the pseudopods (Fig. 9C and D). In spite of the difference in cell shape, the same localization patterns were evident in pkaR mutant cells in buffer (Fig. 9E and F) and in the front of a temporal wave of cAMP (Fig. 9G and H). In the case of pkaR mutant cells, confocal 3D projections were used to distinguish F-actin localization in the complex pseudopods extended off the substratum (data not shown). Antibody-stained myosin II was distributed throughout the cytoplasm of Ax4 cells translocating in buffer, with some punctate cortical localization (Fig. 9I and J). In the front of a temporal wave, there was a reproducible increase in cortical localization (Fig. 9K and L). Myosin II was also distributed throughout the cytoplasm of pkaR mutant cells in buffer (Fig. 9M and N). In the front of a temporal wave of cAMP, there was an increase in cortical staining (Fig. 9O and P) similar to that in Ax4 cells (Fig. 9K and L). Antibody-stained microtubules were found to emanate from a single microtubule organizing center (MTOC) in Ax4 cells, extending along the long axis of cells translocating in buffer (Fig. 9Q to S). In the minority of Ax4 cells that were round, microtubules radiating from the single MTOC conformed to the round shape of the cell (Fig. 9T). Microtubles in pkaR mutant cells also emanated from a single MTOC and conformed to the round shape of the cell (Fig. 9U to W) in a manner similar to that of round Ax4 cells (Fig. 9T). These studies of static cytoskeletal organization revealed no obvious abnormalities in pkaR mutant cells other than conformity to the constitutive ovoid cell shape.
FIG. 9.

The organization of the cytoskeletons of pkaR mutant cells appears normal in buffer and in the front of a temporal wave of cAMP. Representative Ax4 and pkaR mutant (108d3) cells in buffer and in the front of the third in a series of four temporal waves of cAMP were stained for F-actin (A to H), myosin II (I to P), and tubulin (Q to W). a, anterior end; u, uropod. Bars, 10 μm.
DISCUSSION
In Dictyostelium discoideum, PKA was previously demonstrated to play a role in the expression of a number of developmentally regulated genes, in developmental timing, and in cellular differentiation (2-5, 10, 12, 14, 16-19, 21, 22, 24, 39). Here, we demonstrate that cells must also regulate PKA activity in order to translocate efficiently and undergo natural chemotaxis.
PKA is activated by intracellular cAMP, which binds to the regulatory subunit, causing it to dissociate from the catalytic subunit. The dissociated catalytic subunit represents the active form of this kinase. Therefore, it has been hypothesized that PKA activity oscillates in phase with the concentration of internal cAMP through the natural wave (13), increasing in activity in conjunction with increasing intracellular cAMP concentration and decreasing with decreasing intracellular cAMP concentration. Preliminary measurements of PKA activity in cell suspensions support this contention (6). A general model to account for the oscillation of PKA is presented in Fig. 10. When cAMP binds to cAMP surface receptor 1 (cAR1), it activates both the adenyl cyclase A (ACA) and the mitogen-activated protein kinase ERK2 (15, 20). ACA catalyzes cAMP synthesis, and ERK2 inhibits the internal phosphodiesterase RegA (7, 22, 23, 34). As the internal concentration of cAMP rises, PKA is activated, which inhibits ERK2 (4, 5). When no longer inhibited by ERK2, RegA reduces the internal level of cAMP, which in turn leads to a reduction in PKA activity. This circuit (Fig. 10) can account for the increase and decrease in the intracellular cAMP and PKA activities associated with the natural wave.
FIG. 10.
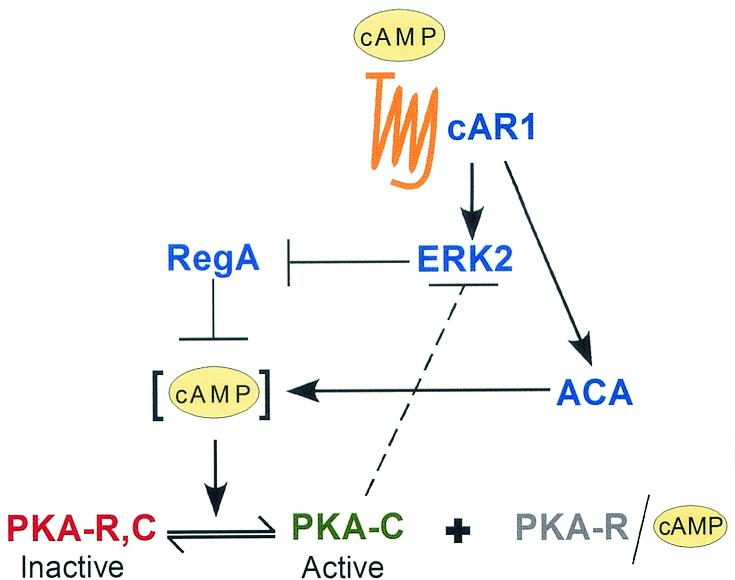
Model of the regulatory circuitry for PKA activation during normal Dictyostelium chemotaxis. When the cAMP receptor cAR1 is occupied in the increasing phase of the wave, the mitogen-activated protein kinase ERK2 and ACA are activated (4, 5, 15, 19). ERK2 inhibits the internal phosphodiesterase RegA (7, 22, 23, 34), which allows cAMP, synthesized by ACA, to accumulate. As the internal concentration of cAMP increases, so does the activity of PKA. When cAR1 occupancy decreases in the back of the wave, both ERK2 and ACA are deactivated, resulting in an increase in RegA activity, a decrease in the internal concentration of cAMP, and a decrease in PKA activity. PKA also inhibits ERK2 (4, 5), noted by a dashed line. Hence, when PKA activity increases, it begins to shut down ERK2 activity, resulting in an increase in RegA activity and a decrease in the intracellular cAMP concentration. In the pkaR mutant, PKA activity is uncoupled from this circuit and will remain constitutively high under all test conditions. R, regulatory subunit; C, catalytic subunit.
Defect in basic motile behavior.
In the absence of a chemotactic signal, wild-type cells are elongate and translocate at relatively high velocities, forming lateral pseudopods frequently (29). In the absence of a chemotactic signal, the level of intracellular cAMP is low and, hence, PKA activity should be low. In pkaR mutant cells translocating in buffer, however, PKA activity is constitutively high. We found that pkaR mutant cells perfused with buffer translocated at half the velocity of wild-type cells, formed lateral pseudopods at twice the frequency of wild-type cells, and were significantly rounder than wild-type cells. 3D reconstructions of pkaR mutant cells translocating in buffer revealed an abnormal ovoid shape and pseudopod formation generally off the substratum toward the top of the cell. The dominant pseudopods of pkaR mutant cells were morphologically more complex (i.e., less uniform) and fragmented frequently, presumably because they were less often in contact with the substratum, which stabilizes the anterior pseudopod (44, 45). Even though pkaR mutant cells were abnormally ovoid, they maintained a degree of polarity. pkaR mutant cells localized tail fibers in each translocating cell, thus defining their uropods. Together, these results indicate that to achieve efficient cellular translocation along a flat substratum in buffer, Dictyostelium amoebae must normally suppress PKA activity.
Defects in chemotaxis.
pkaR mutant cells did not respond normally to chemotactic waves in a wild-type cell aggregation territory. In particular, the mutant cells showed no directed movement toward the aggregation center and no increase in velocity in the deduced front of natural waves formed by wild-type cells that were the majority in mixed cultures. pkaR mutant cells also exhibited defects in their responses to both the spatial and temporal components of the wave (Fig. 1). The same abnormalities observed in buffer were manifested by pkaR mutant cells in both spatial and temporal gradients of cAMP. In spatial gradients of cAMP, pkaR mutant cells assessed the direction of the gradient and crawled toward the source, but they crawled at half the velocity of wild-type cells, did not suppress pseudopods to the extent that wild-type cells did, and turned more frequently. These defects lowered the efficiency of chemotaxis. Since assessment of a spatial gradient is the assumed mechanism of orientation at the onset of the front of a natural wave (phase A) (Fig. 1) (29, 47, 48), wild-type cells must also suppress PKA activity at the onset of a natural wave in order to achieve optimum orientation. This is consistent with the low level of intracellular cAMP and, hence, the low level of PKA activity expected in wild-type cells at the onset of a natural wave.
In response to the increasing temporal gradient of cAMP in the front of a natural wave (phase B), wild-type cells elongated, suppressed lateral-pseudopod formation, and translocated persistently and with increased velocity in the direction set in phase A (Fig. 1). pkaR mutant cells did not exhibit an increase in velocity, did not suppress lateral-pseudopod formation sufficiently, and did not translocate in a persistent fashion in response to the increasing temporal gradient in phase B of a simulated temporal wave of cAMP. pkaR mutant cells did, however, respond normally to the peak of the wave by suppressing lateral-pseudopod formation and retracting the dominant pseudopod(s). pkaR mutant cells also exhibited a reduction in velocity in response to a rapid increase in cAMP concentration to 1 μM, a treatment which has previously been suggested to reflect the responsiveness of a cell to the peak of a natural wave (29, 42, 47, 48). Wild-type cells also respond to the peak of a wave or to the rapid addition of 1 μM cAMP by rounding up. Since pkaR mutant cells are constitutively ovoid, they exhibited very little morphological change in response to the peak of a wave. In the back of the wave, pkaR mutant cells resumed lateral-pseudopod formation, but in all directions, just as with wild-type cells. These results suggest that although pkaR mutant cells respond abnormally to the increasing phase of a temporal wave, they respond normally to the peak and back of the wave. Since one expects the intracellular concentration of cAMP and hence the activity of PKA to cycle in a manner similar to but slightly later than that of the extracellular cAMP concentration (13), any role played by activated PKA would hence have to occur close to the peak of the natural wave and to some extent in the back of the wave. It therefore may be no coincidence that wild-type cells lose their elongate shape at the peak of a natural cAMP wave, when PKA activity should be close to maximal, and remain apolar in the back of the wave. We therefore suggest the possibility that the activation of PKA at the peak of a wave of cAMP plays a direct role in dismantling the elongate cell shape that facilitates rapid translocation along a substratum.
RegA-PKA pathway.
In wild-type cells, the level of intracellular cAMP and hence the level of cAMP-stimulated PKA activity are regulated by cAR1 occupancy according to the regulatory scheme shown in Fig. 10. At the trough of the wave, when the extracellular concentration of cAMP and hence cAR1 occupancy are lowest, increased RegA (ACA) phosphodiesterase activity and ACA inactivation lead to a decrease in PKA activity, and at the peak of the wave, when the extracellular cAMP concentration is maximal, RegA phosphodiesterase inactivation and ACA activation lead to an increase in PKA activity. The deletion of regA, therefore, should result in abnormally elevated PKA activity in the trough of a natural wave, much as pkaR mutant cells should have increased levels of PKA activity in the trough. One might therefore expect regA and pkaR mutant cells to share behavioral defects. Indeed, both regA (47) and pkaR mutant cells were incapable of undergoing normal chemotaxis in monolayers, and both behaved in similar abnormal fashions in natural waves of cAMP generated by wild-type cells that were the majority in mixed cultures. In the deduced front of a natural cAMP wave, both moved in an erratic fashion, exhibiting no directional movement toward the aggregation center, like their wild-type neighbors. In addition, neither mutant was capable of suppressing lateral-pseudopod formation or turning in an increasing temporal gradient of cAMP, a necessary response in natural chemotaxis. Both mutants were still capable, however, of chemotaxing in a spatial gradient of cAMP, albeit less efficiently than wild-type cells, and both responded to the peak and back of a temporal wave of cAMP in an apparently normal fashion. We tentatively conclude that the defects shared by the two mutants stem from the abnormally high levels of PKA activity in both.
However, in contrast to pkaR mutant cells, regA mutant cells were able to extend pseudopods and elongate along a substratum when they were incubated in buffer as well as when they were in the front of a temporal wave of cAMP and showed increased velocity in response to an increasing temporal gradient of cAMP (47). regA mutant cells also differed from pkaR mutant cells in the localization of myosin II when they were analyzed in the front of a temporal wave of cAMP. While regA mutant cells exhibited less cortical staining than wild-type cells (47), pkaR mutant cells exhibited cortical staining similar to that of wild-type cells in the front of a wave. These differences in behavior and in myosin II localization may reflect differences in the levels of PKA activity attained in the two mutants under different conditions. In the pkaR mutant, PKA activity should be maximal under all conditions. In regA mutant cells, PKA activity should be low until ACA is activated by the binding of cAMP to its receptor cAR1 (Fig. 10) and might be reduced to some degree in the trough of the wave by other cytoplasmic phosphodiesterases acting on internal cAMP. PKA activity in regA mutant cells may, therefore, never attain the constitutive levels present in pkaR mutant cells.
The constitutive ovoid cell shape and propensity of pkaR mutant cells to form lateral pseudopods may be indicative of defects in cortical rigor. High PKA activity may lead to defects in the actin-myosin cytoskeleton in the cortex by affecting myosin II phosphorylation. Consistent with such a mechanism, we have recently found that cells carrying mutations that preclude phosphorylation of the myosin II regulatory light chain remain elongate through the peak and back of a temporal wave (48). These cells may be unable to respond to the increases in PKA activity associated with the peak of the wave.
Conclusions.
Our results indicate that PKA activity must be inhibited through its regulatory subunit in order for cells to attain an elongate shape and extend their dominant pseudopods along a substratum in a normal fashion both in buffer and in phases A and B in the front of a chemotactic wave. The behavioral abnormalities identified in pkaR mutant cells in buffer and the absence of a velocity response in the front of a wave most likely are due to the basic defect in cell shape and the abnormal position of the dominant pseudopods. Although no major defects were observed in the general organization of F-actin, myosin II, and tubulin, our staining results were obtained with fixed cells and, therefore, do not exclude the possibility that there were defects in the dynamic cytoskeletal reorganization. Since regA mutant cells were elongate in buffer and in the front of a temporal wave while pkaR mutant cells were ovoid under both conditions, we conclude that the shared behavioral defects, namely, the incapacity to respond to natural waves of cAMP and the incapacity to suppress lateral-pseudopod formation in the front of a simulated temporal or natural wave of cAMP, are most likely unrelated to defects in cell shape but are consequences of abnormally high PKA activity in both mutants. Since wild-type cells become ovoid at the peak of simulated temporal and natural waves, we suggest that PKA activation may play a role in dismantling cell polarity during this phase of the wave through the reorganization of the actin-myosin cytoskeleton, possibly through the regulation of myosin II regulatory light-chain phosphorylation.
Acknowledgments
The research described here was supported by National Institutes of Health grants HD-18577 to D.R.S. and GM60447 to W.F.L., a grant from the W. M. Keck Foundation to D.R.S., and a postdoctoral fellowship provided by the American Cancer Society (PF-01-110-01-CSM) to P.J.H.
REFERENCES
- 1.Alcantara, F., and M. Monk. 1974. Signal propagation during aggregation in the slime mould Dictyostelium discoideum. J. Gen. Microbiol. 85:321-324. [DOI] [PubMed] [Google Scholar]
- 2.Anjard, C., R. Pinaud, R. Kay, and C. D. Reymond. 1992. Overexpression of DdPK2 protein kinase causes rapid development and affects the intra-cellular cAMP pathway of Dictyostelium discoideum. Development 115:785-790. [DOI] [PubMed] [Google Scholar]
- 3.Anjard, C., M. van Bemmelen, M. Veron, and C. D. Reymond. 1997. SDF, a new spore differentiation factor secreted by Dictyostelium cells, is phosphorylated by the cAMP dependent protein kinase. Differentiation 62:43-49. [DOI] [PubMed] [Google Scholar]
- 4.Aubry, L., and R. A. Firtel. 1999. Integration of signaling networks that regulate Dictyostelium differentiation. Annu. Rev. Cell Dev. Biol. 15:469-517. [DOI] [PubMed] [Google Scholar]
- 5.Aubry, L., M. Maeda, R. Insall, P. N. Devreotes, and R. A. Firtel. 1997. The Dictyostelium mitogen-activated protein kinase ERK2 is regulated by ras and cAMP-dependent protein kinase (PKA) and mediates PKA function. J. Biol. Chem. 272:3883-3886. [DOI] [PubMed] [Google Scholar]
- 6.Behrens, M. M., M. H. Juliani, and J. C. C. Maia. 1986. Periodic changes in the cAMP-dependent protein kinase activity ration in Dictyostelium discoideum. Biochem. Int. 13:221-226. [Google Scholar]
- 7.Chang, W. T., P. A. Thomason, J. D. Gross, and P. C. Newell. 1998. Evidence that the RdeA protein is a component of a multistep phosphorelay modulating rate of development in Dictyostelium. EMBO J. 17:2809-2816. [DOI] [PMC free article] [PubMed] [Google Scholar]
- 8.De Gunzburg, J., D. Part, N. Guiso, and M. Veron. 1984. An unusual adenosine 3′,5′-phosphate dependent protein kinase from Dictyostelium discoideum. Biochemistry 23:3805-3812. [DOI] [PubMed] [Google Scholar]
- 9.Escalante, R., D. Wessels, D. R. Soll, and W. F. Loomis. 1997. Chemotaxis to cAMP and slug migration in Dictyostelium both depend on MigA, a BTB protein. Mol. Biol. Cell 8:1763-1775. [DOI] [PMC free article] [PubMed] [Google Scholar]
- 10.Harwood, A. J., N. A. Hopper, M.-N. Simon, S. Bouzid, M. Veron, and J. G. Williams. 1992. Multiple roles for cAMP dependent protein kinase during Dictyostelium development. Dev. Biol. 149:90-99. [DOI] [PubMed] [Google Scholar]
- 11.Heid, P., E. Voss, and D. R. Soll. 2002. 3D-DIASemb: a computer-assisted system for reconstructing and motion analyzing in 4D every cell and nucleus in a developing embryo. Dev. Biol. 245:329-347. [DOI] [PubMed] [Google Scholar]
- 12.Kay, R. R. 1989. Evidence that intracellular cAMP triggers spore maturation in Dictyostelium. Development 105:753-759. [Google Scholar]
- 13.Laub, M., and W. F. Loomis. 1998. A molecular network that produces spontaneous oscillations in excitable cells of Dictyostelium. Mol. Biol. Cell 9:3521-3532. [DOI] [PMC free article] [PubMed] [Google Scholar]
- 14.Loomis, W. F. 1998. Role of PKA in the timing of developmental events in Dictyostelium cells. Microbiol. Mol. Biol. Rev. 62:684-694. [DOI] [PMC free article] [PubMed] [Google Scholar]
- 15.Maeda, M., L. Aubry, R. Insall, C. Gaskins, P. N. Devreotes, and R. A. Firtel. 1996. Seven helix chemoattractant receptors transiently stimulate mitogen-activated protein kinase in Dictyostelium: role of heterotrimeric G proteins. J. Biol. Chem. 271:3351-3354. [DOI] [PubMed] [Google Scholar]
- 16.Mann, S. K. O., and R. A. Firtel. 1991. A developmentally regulated, putative serine/threonine protein kinase is essential for development in Dictyostelium. Mech. Dev. 35:89-101. [DOI] [PubMed] [Google Scholar]
- 17.Mann, S. K. O., and R. A. Firtel. 1993. cAMP-dependent protein kinase differentially regulates prestalk and prespore differentiation during Dictyostelium development. Development 119:135-146. [DOI] [PubMed] [Google Scholar]
- 18.Mann, S. K. O., L. Richardson, S. Lee, A. R. Kimmel, and R. A. Firtel. 1994. Expression of cAMP-dependent protein kinase in prespore cells is sufficient to induce spore cell differentiation in Dictyostelium. Proc. Natl. Acad. Sci. USA 91:10561-10565. [DOI] [PMC free article] [PubMed] [Google Scholar]
- 19.Mann, S. K. O., W. M. Yonemoto, S. S. Taylor, and R. A. Firtel. 1992. DdPK3, which plays essential roles during Dictyostelium development, encodes the catalytic subunit of cAMP-dependent protein kinase. Proc. Natl. Acad. Sci. USA 89:10701-10705. [DOI] [PMC free article] [PubMed] [Google Scholar]
- 20.Pitt, G. S., N. Milona, J. Borleis, K. C. Lin, R. R. Reed, and P. N. Devreotes. 1992. Structurally distinct and stage-specific adenylyl cyclase genes play different roles in Dictyostelium development. Cell 69:305-315. [DOI] [PubMed] [Google Scholar]
- 21.Reymond, C. D., P. Schaap, M. Veron, and J. G. Williams. 1995. Dual role of cAMP during Dictyostelium development. Experientia 51:1166-1174. [DOI] [PubMed] [Google Scholar]
- 22.Shaulsky, G., R. Escalante, and W. F. Loomis. 1996. Developmental signal transduction pathways uncovered by genetic suppressors. Proc. Natl. Acad. Sci. USA 93:15260-15265. [DOI] [PMC free article] [PubMed] [Google Scholar]
- 23.Shaulsky, G., N. Wang, and W. F. Loomis. 1998. A cAMP phosphodiesterase response-regulator controls PKA dependent differentiation. Dev. Biol. 125:691-697. [DOI] [PubMed] [Google Scholar]
- 24.Simon, M. N., D. Driscoll, R. Mutzel, D. Part, J. G. Williams, and M. Veron. 1989. Overexpression of the regulatory subunit of the cAMP-dependent protein kinase blocks the differentiation of Dictyostelium discoideum. EMBO J. 8:2039-2043. [DOI] [PMC free article] [PubMed] [Google Scholar]
- 25.Soll, D. R. 1979. Timers in developing systems. Science 203:841-849. [DOI] [PubMed] [Google Scholar]
- 26.Soll, D. R. 1987. Methods for manipulating and investigating developmental timing in Dictyostelium discoideum. Methods Cell Biol. 28:413-431. [DOI] [PubMed] [Google Scholar]
- 27.Soll, D. R. 1995. The use of computers in understanding how animal cells crawl. Int. Rev. Cytol. 163:43-104. [PubMed] [Google Scholar]
- 28.Soll, D. R. 1999. Computer-assisted three-dimensional reconstruction and motion analysis of living, crawling cells. Comput. Med. Imaging Graph. 23:3-14. [DOI] [PubMed] [Google Scholar]
- 29.Soll, D. R., D. Wessels, P. Heid, and H. Zhang. A contextual framework for analyzing motility and chemotaxis mutants in Dictyostelium discoideum. J. Muscle Res. Cell Motil., in press. [DOI] [PubMed]
- 30.Soll, D. R., and E. Voss. 1998. Two and three dimensional computer systems for analyzing how cells crawl, p. 25-52. In D. R. Soll and D. Wessels (ed.), Motion analysis of living cells. John Wiley, Inc., New York, N.Y.
- 31.Soll, D. R., E. Voss, O. Johnson, and D. Wessels. 2000. Three-dimensional reconstruction and motion analysis of living, crawling cells. Scanning 22:249-257. [DOI] [PubMed] [Google Scholar]
- 32.Soll, D. R., D. Wessels, J. Murray, H. Vawter, E. Voss, and A. Bublitz. 1990. Intracellular vesicle movement, cAMP and myosin-II in Dictyostelium. Dev. Genet. 11:341-353. [DOI] [PubMed] [Google Scholar]
- 33.Sussman, M. 1987. Cultivation and synchronous morphogenesis of Dictyostelium under controlled experimental conditions. Methods Cell Biol. 28:9-20. [DOI] [PubMed] [Google Scholar]
- 34.Thomason, P. A., D. Traynor, G. Cavet, W. T. Chang, A. Harwood, and R. Kay. 1998. An intersection of the cAMP/PKA and two component signal transduction system in Dictyostelium. EMBO J. 17:2838-2845. [DOI] [PMC free article] [PubMed] [Google Scholar]
- 35.Varnum, B., K. B. Edwards, and D. R. Soll. 1985. Dictyostelium amoebae alter motility differently in response to increasing versus decreasing temporal gradients of cAMP. J. Cell Biol. 101:1-5. [DOI] [PMC free article] [PubMed] [Google Scholar]
- 36.Varnum, B., and D. R. Soll. 1984. Effects of cAMP on single cell motility in Dictyostelium. J. Cell Biol. 99:1151-1155. [DOI] [PMC free article] [PubMed] [Google Scholar]
- 37.Varnum-Finney, B., K. B. Edwards, E. Voss, and D. R. Soll. 1987. Amoebae of Dictyostelium discoideum respond to an increasing temporal gradient of the chemoattractant cAMP with a reduced frequency of turning: evidence for a temporal mechanism in amoeboid chemotaxis. Cell Motil. Cytoskelet. 8:7-17. [DOI] [PubMed] [Google Scholar]
- 38.Varnum-Finney, B. J., E. Voss, and D. R. Soll. 1987. Frequency and orientation of pseudopod formation of Dictyostelium discoideum amoebae chemotaxing in a spatial gradient: further evidence for a temporal mechanism. Cell Motil. Cytoskelet. 8:18-26. [DOI] [PubMed] [Google Scholar]
- 39.Wang, N., F. Soderbom, C. Anjard, G. Shaulsky, and W. F. Loomis. 1999. SDF-2 induction of terminal differentiation in Dictyostelium discoideum is mediated by the membrane-spanning sensor kinase DhkA. Mol. Cell. Biol. 19:4750-4756. [DOI] [PMC free article] [PubMed] [Google Scholar]
- 40.Wessels, D., J. Murray, and D. R. Soll. 1992. Behavior of Dictyostelium amoebae is regulated primarily by the temporal dynamic of the natural cAMP wave. Cell Motil. Cytoskelet. 23:145-156. [DOI] [PubMed] [Google Scholar]
- 41.Wessels, D., J. Reynolds, O. Johnson, E. Voss, R. Burns, K. Daniels, E. Garrard, T. J. O'Halloran, and D. R. Soll. 2000. Clathrin plays a novel role in the regulation of cell polarity, pseudopod formation, uropod stability and motility in Dictyostelium. J. Cell Sci. 113:21-36. [DOI] [PubMed] [Google Scholar]
- 42.Wessels, D., N. A. Schroeder, E. Voss, A. L. Hall, J. Condeelis, and D. R. Soll. 1989. cAMP-mediated inhibition of intracellular particle movement and actin reorganization in Dictyostelium. J. Cell Biol. 109:2841-2851. [DOI] [PMC free article] [PubMed] [Google Scholar]
- 43.Wessels, D., and D. R. Soll. 1998. Computer-assisted characterization of the behavioral defects of cytoskeletal mutants of Dictyostelium discoideum, p. 101-140. In D. R. Soll and D. Wessels (ed.), Motion analysis of living cells. John Wiley, Inc., New York, N.Y.
- 44.Wessels, D., M. Titus, and D. R. Soll. 1996. A Dictyostelium myosin I plays a crucial role in regulating the frequency of pseudopods formed on the substratum. Cell Motil. Cytoskelet. 33:64-79. [DOI] [PubMed] [Google Scholar]
- 45.Wessels, D., H. Vawterhugart, J. Murray, and D. R. Soll. 1994. 3-dimensional dynamics of pseudopod formation and the regulation of turning during the motility cycle of Dictyostelium. Cell Motil. Cytoskelet. 27:1-12. [DOI] [PubMed] [Google Scholar]
- 46.Wessels, D., E. Voss, N. Von Bergen, R. Burns, J. Stites, and D. R. Soll. 1998. A computer-assisted system for reconstructing and interpreting the dynamic three-dimensional relationships of the outer surface, nucleus and pseudopods of crawling cells. Cell Motil. Cytoskelet. 41:225-246. [DOI] [PubMed] [Google Scholar]
- 47.Wessels, D. J., H. Zhang, J. Reynolds, K. Daniels, P. Heid, S. J. Lu, A. Kuspa, G. Shaulsky, W. F. Loomis, and D. R. Soll. 2000. The internal phosphodiesterase RegA is essential for the suppression of lateral pseudopods during Dictyostelium chemotaxis. Mol. Biol. Cell 11:2803-2820. [DOI] [PMC free article] [PubMed] [Google Scholar]
- 48.Zhang, H., D. Wessels, P. Fey, K. Daniels, R. Chisholm, and D. R. Soll. 2002. Phosphorylation of the myosin regulatory light chain plays a role in motility and polarity during Dictyostelium chemotaxis. J. Cell Sci. 115:1733-1747. [DOI] [PubMed] [Google Scholar]
- 49.Zigmond, S. H. 1977. The ability of polymorphonuclear leukocytes to orient in gradients of chemotactic factors. J. Cell Biol. 75:606-616. [DOI] [PMC free article] [PubMed] [Google Scholar]