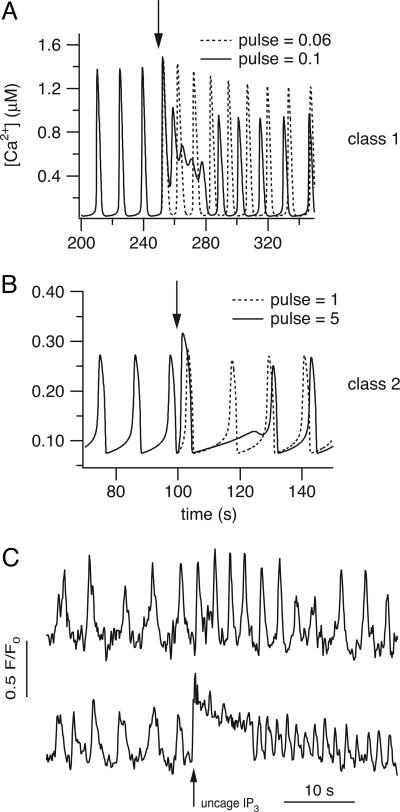
Abstract
In some cell types, oscillations in the concentration of free intracellular calcium ([Ca2+]) are accompanied by oscillations in the concentration of inositol 1,4,5-trisphosphate ([IP3]). However, in most cell types it is still an open question as to whether oscillations in [IP3] are necessary for Ca2+ oscillations in vivo, or whether they merely follow passively. Using a wide range of models, we show that the response to an artificially applied pulse of IP3 can be used to distinguish between these two cases. Hence, we show that muscarinic receptor-mediated, long-period Ca2+ oscillations in pancreatic acinar cells depend on [IP3] oscillations, whereas short-period Ca2+ oscillations in airway smooth muscle do not.
Keywords: mathematical model
Oscillations in the concentration of free intracellular calcium ([Ca2+]) are a crucial control mechanism in many cell types. The temporal and spatial information encoded by these oscillations controls many processes, including secretion, gene expression, differentiation, muscular contraction, cell movement, and apoptosis (1). Thus, it is of great interest to determine the mechanisms underlying such oscillations. In many cell types, these oscillations depend on the production of inositol 1,4,5-trisphosphate (IP3). Binding of an agonist to cell membrane receptors initiates a series of reactions that ends in the formation of IP3 that diffuses through the cytoplasm and binds to and opens IP3 receptors (IPR; they are also Ca2+ channels) on the endoplasmic reticulum (ER) membrane, leading to the release of Ca2+ from the ER. The released Ca2+ is then transported back into the ER, or removed from the cell, by pumps and exchangers. Without the presence of positive or negative feedback, such a process would, in general, simply give an increase and decay of the Ca2+ concentration. The presence of cycles of Ca2+ release and reuptake to and from the ER (i.e., Ca2+ oscillations) indicates instead that the [Ca2+] is regulated by feedback processes. The precise identity of these feedback processes has proven difficult to elucidate.
There are, in general, two different classes of models of Ca2+ oscillations. These two classes have been recognized for almost 20 years (2, 3) and have been the basis for the majority of quantitative models of intracellular Ca2+ dynamics. The first class (class 1) assumes that oscillations arise from the kinetics of the IPR. It is well known that Ca2+ can both increase and decrease the IPR open probability. This allows for the possibility that Ca2+ oscillations are caused by sequential positive and negative feedback of Ca2+ on the IPR; in models of this type (4–6), Ca2+ oscillations occur at constant [IP3]. The second class (class 2) of models (7–9) assumes instead that Ca2+ modulation of IP3 levels, either through feedback regulation of degradation or production, is the cause of the Ca2+ oscillations, which are thus necessarily accompanied by oscillations in [IP3]. Ca2+ modulation of IP3 production or degradation occurs in two principal ways; firstly, the activity of phospholipase C, and thus the rate of production of IP3, is an increasing function of [Ca2+]; secondly, the activity of the 3-kinase that degrades IP3 to IP4 is an increasing function of [Ca2+].
The observation that Ca2+ oscillations are accompanied by IP3 oscillations in a given cell type (10) does not, by itself, distinguish between these two mechanisms. IP3 oscillations could be merely passive reflections of the Ca2+ oscillations, resulting from Ca2+ modulation of phospholipase C activity (for example); although they would modulate the exact properties of the Ca2+ oscillations, they would nevertheless not be an essential ingredient of the oscillatory mechanism. Other experimental investigations that try to clamp [IP3] while simultaneously measuring Ca2+ oscillations (11, 12) suffer from the disadvantage that the efficacy of the clamp remains unknown, especially in a highly localized intracellular domain. In addition, observation of Ca2+ oscillations in conditions where [IP3] is thought to be clamped (12) shows only that Ca2+ oscillations are possible under conditions of constant [IP3], even though that might not be the actual mechanism in vivo. For these reasons, although experimental methods are being developed to measure [IP3] directly, the question of the underlying oscillatory mechanism often remains unresolved.
Despite these difficulties, the different dynamic behavior of the two classes of model allows for the possibility of designing a simple experimental test to determine which oscillatory mechanism is dominant. In models of class 1, the frequency of the oscillation is an increasing function of [IP3]. Thus, if a pulse of IP3 is applied to a model cell exhibiting Ca2+ oscillations of class 1, the additional IP3 will cause a transient increase in the oscillation frequency. Conversely, in oscillations of class 2, IP3 is a dynamic variable rather than merely a parameter that sets oscillation frequency. In these models, Ca2+ oscillations are necessarily accompanied by IP3 oscillations and thus can occur only when [IP3] is in the appropriate range. Application of an external pulse of IP3 forces [IP3] out of this oscillatory range, and the oscillations cannot reappear until [IP3] has decreased sufficiently, thus causing a change in the phase of the next oscillation peak.
The previous paragraph describes the predictions from the general mathematical theory of oscillators, which are independent of the actual assumptions made in constructing the models. To confirm that this is indeed so, we studied 13 different models and showed that, no matter what the specific assumptions underlying the model, they all behaved as predicted by the general theory. We then tested the predictions in two different cell types, pancreatic acinar cells (PAC) and airway smooth muscle (ASM). Application of an exogenous pulse of IP3 can be accomplished by preloading cells with photoreleasable IP3 and then flash releasing a bolus of IP3 after initiation of oscillations by agonist application.
Results
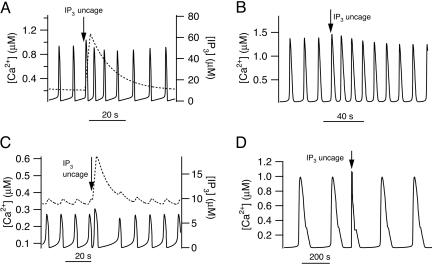
If a pulse of IP3 is added to a simulation of a model cell exhibiting Ca2+ oscillations, the response of the model cell is qualitatively different, depending on whether the Ca2+ oscillations rely on IP3 oscillations. For class 1 models (i.e., if the Ca2+ oscillations occur at constant [IP3]) then the pulse of IP3 increases the frequency of the Ca2+ oscillations (Fig. 1 A and B). We have included a plot of [IP3] in the graph to show how it is acting as a bifurcation parameter, controlling the oscillation period. As [IP3] increases, so does the oscillation frequency; this dependence of oscillation frequency on [IP3] is usually summarized in a bifurcation diagram, examples of which have appeared for many different models of this class (13, 14).
Fig. 1.
Model responses to pulses of IP3. (A and B) Responses of class 1 models to a pulse of IP3. (A) Response of the Atri model (4); pst = 10, M = 20, tpulse = 70, twidth = 3. The solid line is [Ca2+] and is plotted against the left axis; the dotted line is [IP3] and is plotted against the right axis. (B) Response of the Li–Rinzel model (6); pst = 0.8, M = 0.05, tpulse = 250, twidth = 10. (C and D) Responses of class 2 models to a pulse of IP3. These responses were calculated from the same models as A and B but modified so that Ca2+ oscillations depend on oscillations in [IP3] (details in Appendix). In each panel a pulse of IP3 was added at the arrow. (C) Response of the modified Atri model (4); ν4 = 6, M = 3, tpulse = 100, twidth = 3. (D) Response of the modified Li–Rinzel model (6); ν4 = 0.7, M = 5, tpulse = 600, twidth = 2.
For class 2 models (i.e., IP3 oscillations are required), the pulse of IP3 delays the next oscillation peak (Fig. 1 C and D). The reason for this can be seen by considering the graph of [IP3]; during oscillations, [IP3] is also oscillating between two values. When [IP3] is increased by the pulse, it lies outside the range for which it can oscillate (Fig. 1C, dotted line) and takes some time to return. This time taken to return is precisely what causes the phase lag in the next oscillation peak. Here, we measure the phase lag by calculating the time between successive oscillation peaks, not counting the peak caused by the flash itself. This is the traditional approach that has been used in a wide variety of previous studies of biological oscillators (15, 16).
We have illustrated these responses using two different models (4, 6) to show how models based on different assumptions about the behavior of the IP3 receptors, the SERCA pumps, and other details still exhibit the same qualitative behavior. The behavior of each of the 13 models we studied exhibited the same qualitative behavior; we do not have the space to present results from each of these models.
These theoretical results show how a relatively simple experimental test can determine whether Ca2+ oscillations depend on IP3 oscillations. If the response to a pulse of IP3 is an increase in the frequency of the oscillations, then the Ca2+ oscillations do not depend on IP3 oscillations. If, instead, the next Ca2+ peak is merely changed in phase, then IP3 is a dynamic variable and oscillations in [IP3] are crucial for the oscillatory mechanism. Note that in both cases an increase in agonist concentration will increase oscillation frequency (via an increase in IP3 production).
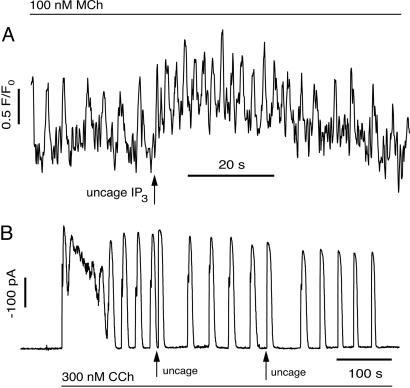
Application of this test to methacholine (MCh)-induced Ca2+ oscillations in ASM shows that these oscillations do not depend on oscillations in [IP3] (Fig. 2A). Lung slices from the mouse were imaged with a confocal microscope as described in refs. 17 and 18. Oscillations were stimulated by the addition of 100 nM MCh. Subsequent flash photolysis of IP3 caused a transient increase in the oscillation frequency (Fig. 2A).
Fig. 2.
Responses of ASM and PAC to pulses of IP3. (A) In ASM, photorelease of IP3 causes a transient increase in oscillation frequency. (B) In PAC, photorelease of IP3 causes a delay in the next peak of the Ca2+ oscillation.
The reverse happens in PAC. Single PAC and small acini were prepared by collagenase digestion according to established procedures (19). Whole-cell Ca2+-activated Cl− currents were monitored as a sensitive measurement of subapical membrane [Ca2+] as described in ref. 20. Oscillations of Ca2+ were initiated by superfusion of 300 nM carbachol (CCh) (Fig. 2B). Increasing IP3 during the oscillations by flash photolysis of 10 μM IP3 loaded via the patch pipette resulted in a delay before the next transient, with no significant change in oscillation frequency or the rise and decay time of the oscillations when they resumed. We conclude that the observed Ca2+ oscillations in PAC depend on IP3 oscillations, whereas those in ASM do not.
In both PAC and ASM, photorelease of Ca2+ changes the phase of the next spike, with no subsequent change in period (in PAC and ASM the time to the next spike is, respectively, 177 ± 9.2% and 150% of the prepulse spike period). This is as predicted by both classes of model and demonstrates that the responses to a pulse of IP3 are not merely reflections of the subsequent increase in [Ca2+].
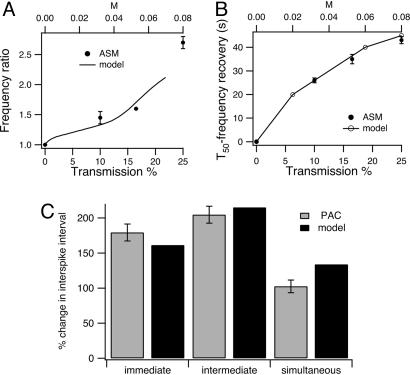
Larger IP3 pulses cause greater increases in frequency in ASM (Fig. 3A), while the time taken for the frequency to decay to baseline also increases with IP3 pulse strength (Fig. 3B). Both these results agree with predictions from class 1 models. In PAC and class 2 models, the phase delay in response to an IP3 pulse depends on the timing of the pulse (Fig. 3C). Because the IP3 pulse can be applied with only limited temporal resolution, the data were collected only at three approximate pulse timings; immediate (the pulse occurs <5 s after the spike has returned to baseline), intermediate (the pulse occurs between the spikes but not close to either one), and simultaneous (the pulse occurs at the same time as a spike). In the immediate case, the phase delay, as measured by the time between calcium spikes, not counting the spike caused by the pulse itself, is 179.2 ± 12% (n = 4) of the prepulse spike period, whereas in the intermediate case, the phase delay is 204.6 ± 12% (n = 10) of the prepulse spike period.
Fig. 3.
Comparison of model and experimental results. (A and B) The dose-dependence of the changes in the oscillation frequency induced by flash photolysis of caged IP3 in ASM. The initial baseline rate of Ca2+ oscillations was induced by MCh (100 nM). The incremental increase in IP3 concentration was achieved by increasing the UV flash intensity with a series of neutral density filters with optical density (OD) values of 1.0. 0.8, and 0.6 where transmission % equals 10OD× 100. The UV exposure time was constant (100 ms) and the diameter of the area illuminated was 50 μm in all experiments. Data were obtained from different airways of two mice. The same dye and caged IP3 loading process was used for each slice. Each data point is the average of responses from four different cells. (A) Solid symbols: the ratio of the average frequency of Ca2+ oscillations during the first 20 s after the UV exposure to the preexposed frequency (30 s) induced by MCh was plotted with respect to the flash intensity (UV transmission percentage). Smooth curve: frequency increase in the class 1 Li–Rinzel model (pst = 0.6), plotted against the pulse strength (the upper axis). Calculations were performed by using the bifurcation tracking program auto, as incorporated into xppaut (29), using M as the principal bifurcation parameter. The relationship between M and transmission percentage is arbitrary but the same in A and B. (B) Time taken (T50) for the oscillation frequency to return to 50% of the average frequency increase achieved during the first 20 s after UV exposure. The open symbols are from the class 1 Li–Rinzel model (pst = 0.6) and are plotted against the upper axis. The model results are estimated at three different values of M. (C) Percent change in interspike interval in PAC for three approximate timings of the IP3 pulse. Immediate, IP3 pulse occurs right after a Ca2+ spike; intermediate, IP3 pulse occurs between two Ca2+ spikes, but not close to either one; simultaneous, IP3 pulse occurs at the same time as a Ca2+ spike would have occurred, judging by the previous oscillations. The model results are from the class 2 Atri model.
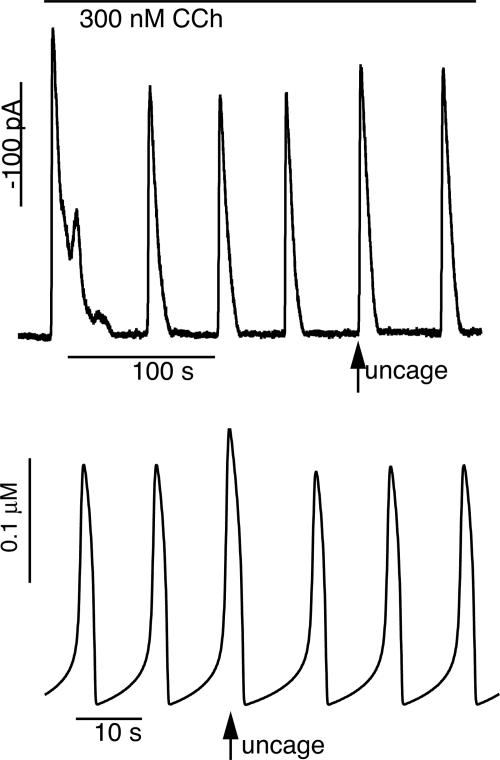
When the IP3 pulse occurs right on top of a Ca2+ spike (as predicted by extrapolation from the baseline frequency), the spikes carry on almost unaffected (delay is 102 ± 9% of the prepulse period; see Fig. 3C), with only a small increase in amplitude at the time of the IP3 pulse. Examples of the first two cases can be seen in Fig. 2B, and an example of the simultaneous case is shown in Fig. 4. In all cases, the spike period after the pulse returned to the same as the prepulse spike period (116 ± 24%, n = 10, of the mean interval between the three spikes before uncaging). When the pulse is applied at the same time as a Ca2+ spike, the spike interval after the pulse is calculated as the time interval between the pulse and the next Ca2+ spike.
Fig. 4.
Response of PAC (Upper) and the class 2 Atri model (Lower) to a pulse of IP3 that occurs right on a Ca2+ spike. In both the experiment and the model the IP3 pulse causes a Ca2+ spike of slightly greater amplitude, with little change in subsequent spike frequency (see Fig. 3C).
Class 1 and 2 models can also be distinguished by their responses to pulses of IP3 of increasing size. We have already seen (Fig. 3A) how increasing the size of the IP3 pulse causes a greater increase in frequency in class 1 models and ASM. In addition, in class 1 models a sufficiently large increase in the size of the IP3 pulse leads to fast oscillations superimposed on a raised baseline (Fig. 5A), whereas in class 2 models an increase in the size of the pulse increases the phase lag of the response (Fig. 5B). The responses of ASM are again consistent with those of the class 1 models (Fig. 5C). In PAC, a smaller IP3 pulse following photolysis of 3 μM resulted in a phase delay of 132 ± 28%, which was not statistically significantly different from the period before uncaging. Thus, PAC responses are again consistent with the prediction from class 2 models.
Fig. 5.
Model and experimental responses to IP3 pulses of increasing magnitude. (A) In class 1 models, an increase in the strength of the IP3 pulse causes oscillations of greater frequency and smaller amplitude, superimposed on a raised baseline. If the pulse is large enough, the oscillations can disappear entirely, leaving only the raised baseline (traces calculated from the Li–Rinzel model). (B) In class 2 models, an increase in the strength of the IP3 flash leads to a greater phase delay (traces calculated from the Atri model). (C) In ASM, an increase in the strength of the IP3 pulse leads to fast oscillations superimposed on a raised baseline, as in class 1 models. C Upper was with a smaller light flash, and thus a smaller IP3 release than in C Lower. The responses of all four cells (from two different animals) were qualitatively similar.
Discussion
The mechanisms underlying Ca2+ oscillations have been studied for almost 20 years now. The majority of quantitative explanations fall into one of two camps; those models that assume that Ca2+ oscillations rely on IP3 oscillations, and those that assume that Ca2+ oscillations occur as a result of the time-dependent gating of the IPR by Ca2+ (2, 3). It has proven difficult to distinguish between these two different mechanisms. Firstly, the oscillations themselves show no clear differences in behavior between the two types; and secondly, it is difficult to measure [IP3] experimentally and even more difficult to control it effectively. Because of these experimental difficulties, many of the methods that could be used to distinguish between these hypotheses are not feasible. Thus, to answer this question requires the development of experimental procedures that are realistic and relatively simple.
Such a test was originally proposed by Harootunian et al. (21); by photorelease of IP3 they showed that Ca2+ oscillations in the fibroblast cell line REF52 depend on oscillations in IP3. Here, we develop this approach further, investigate the predictions from 13 different models, and thus probe the mechanisms underlying Ca2+ oscillations in two cell types, pancreatic acinar cells (PAC) and airway smooth muscle (ASM). We conclude that the longer-period oscillations in PAC depend on oscillations in [IP3], whereas the shorter-period oscillations in ASM do not. This conclusion is consistent with estimates of the kinetics of IP3 metabolism (22), which suggest that IP3 production and degradation are unlikely to be fast enough to mediate oscillations with a period of only a few seconds. On the other hand, the kinetics of Ca2+ activation and inactivation of the IPR (23) are fast enough to mediate oscillations with such short periods.
There are few cell types in which the necessity (or otherwise) of IP3 oscillations to generate Ca2+ oscillations has been demonstrated. One notable exception is the work of Nash et al. (24), who showed in a tissue-culture cell line, the Chinese hamster ovary cell, that two quite different mechanisms can cause Ca2+ oscillations. Activation of the metabotropic glutamate receptor mGluR5a causes longer-period synchronized oscillations in both Ca2+ and IP3, whereas activation of the M3-muscarinic receptor causes shorter-period Ca2+ oscillations at a constant [IP3]. It is undeniable that such direct experimental measurement of both IP3 and Ca2+ is a better way to answer the question posed here. However, these experiments are not always practical; acutely isolated cells such as PAC would generally require viral expression of the IP3 probe, while transfection of the probe has not yet been accomplished successfully in living tissue such as a lung slice. Neither are there suitable transgenic animals. Thus, our work provides a much simpler way in which the mechanisms underlying Ca2+ oscillations can be studied.
In reality, both oscillatory mechanisms will operate simultaneously in most cell types. In this case, one might expect a continuum of behavior from one extreme to the other. However, preliminary computations show that this continuum exhibits threshold-like behavior, and that the oscillations are controlled principally by one mechanism or the other. We have constructed a version of the Atri model that contains both classes of oscillatory mechanism. By varying a parameter in the model, we can make each oscillatory mechanism stronger or weaker. When this model is probed with IP3 pulses, the response is either that of a class 1 model or that of a class 2 model. There was no significant parameter regime (that we could find) that allows for ambiguous behavior intermediate between that of the class 1 and class 2 responses. As yet, we have done this only for a single model, not for each of the models shown here. Nevertheless, they are a strong indication that cells containing both oscillatory mechanisms will still exhibit either a class 1 or a class 2 response, with little ambiguity. The behavior of the Dupont and Swillens model (11, 25), which also contains both oscillatory mechanisms, is consistent with this result, because in that model the oscillation is controlled by a single dominant mechanism.
This method provides a simple way in which the evolution of dynamic properties and their dependence on agonist dose can be determined. By flash release of IP3 at different times after application of the agonist, it is possible to determine whether the underlying oscillatory mechanism changes over time. In addition, it is plausible that different agonist concentrations cause oscillations with different mechanisms, again something that is relatively easy to test.
Methods
We first investigated 10 different models [5 models, each in two different forms: those of Atri et al. (4), Li and Rinzel (6), Sneyd et al. (26), Dupont and Swillens (25), and Höfer et al. (8)]. Each of these models was (where necessary) modified so that Ca2+ transport across the plasma membrane was included and was studied in two different forms corresponding to the two classes of models discussed above; one in which the kinetics of Ca2+ feedback on the IPR was included but Ca2+ feedback on IP3 production and/or degradation was omitted and one for which the reverse was true. We also investigated the models of Cutherbertson and Chay (7), Swillens and Mercan (27), and Falcke et al. (28). Thus, we studied a total of 13 different models.
These 13 models included, in various combinations, Ca2+ activation and inactivation of the IPR, the dependence of the SERCA pump on both cytosolic and ER Ca2+, depletion of the ER calcium stores, the feedback of Ca2+ on both the production and degradation of IP3, Ca2+ feedback on phospholipase C and the G-protein, the transport of Ca2+ across the plasma membrane, the dependence of Ca2+ influx on agonist stimulation (whether by a store-operated mechanism or an arachidonic acid regulated channel), and mitochondrial Ca2+ transport. Some of these models were closed (i.e., they ignored Ca2+ influx and efflux across the plasma membrane).
In every case, the model behaved as predicted from the general theory. We thus conclude that the general theory is an accurate guide to model behavior and that our predictions are model-independent.
We illustrate our results using the models of Atri et al. and of Li and Rinzel, full details of which are given in Appendix. Note that in both classes of models, Ca2+ will activate and inactivate the IPR, and the steady-state of the IPR will follow the usual bell-shaped curve as a function of [Ca2+]. However, in class 2 models the activation and inactivation of the IPR occurs on a faster time scale than the production and degradation of IP3. In this case, the gating of the IPR can be simplified by omitting its kinetics. This is a reasonable assumption for many cell types in which IP3 production and degradation occurs on the time scale of several seconds, whereas Ca2+ activation and inactivation of the IPR occurs with a time scale of much less than a second (23). In class 1 models, any feedback from Ca2+ to IP3 metabolism is omitted. Instead, the oscillations arise from the kinetics of Ca2+ feedback on the IPR.
Acknowledgments
J.S. and K.T.-A. were supported by the Marsden Fund of the Royal Society of New Zealand, V.R. and D.I.Y. were supported by National Institutes of Health Grants DE14756 and DK54568, and Y.B. and M.J.S. were supported by National Institutes of Health Grant HL71930.
Abbreviations
- ASM
airway smooth muscle
- ER
endoplasmic reticulum
- IP3
inositol 1,4,5-trisphosphate
- IPR
IP3receptor
- MCh
methacholine
- PAC
pancreatic acinar cells.
Appendix
We illustrate our results using two different models, each in two different forms. Both models have the same basic structure but different expressions for the various Ca2+ fluxes.
The Atri model of the first class includes the kinetics of the IP3 receptor but no feedback from Ca2+ to the production or degradation of IP3. Thus,
 |
 |
 |
 |
where c denotes [Ca2+], ce denotes [Ca2+] in the ER, p denotes [IP3], and n denotes the proportion of IP3 receptors that are not inactivated by Ca2+. The fluxes are given by
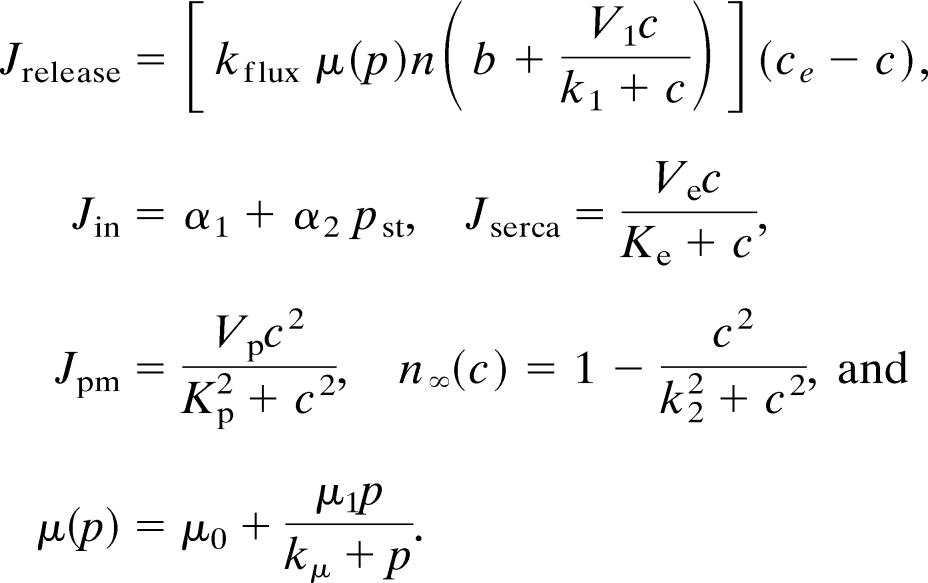 |
The Atri model of the second class omits any kinetics of Ca2+ feedback on the IP3 receptor (equivalent to taking the limit as τn → 0) but instead incorporates Ca2+ modulation of IP3 production via the equation
 |
where ν4 is the maximum rate of IP3 production and βosc is the rate constant for loss of IP3. We have used the same values for the parameters α = 0.97 and k4 = 1.1 as in Eq. 5. In addition, the influx of Ca2+ (Jin) from the outside of the cell is assumed to be a function of ν4 of the form equation Jin = α1 + α2ν4 for some constants α1 and α2, and n is assumed to be an instantaneous function of c, i.e., n = n∞(c). This expression for the inward flux of Ca2+ is not based directly on experimental measurement. It is known that the inward Ca2+ flux increases with agonist concentration (because otherwise the steady-state [Ca2+] would not change with agonist concentration, which it does), but the exact mechanisms underlying such an increase are controversial. Here (and in each of the other models), we just assume that the influx is linearly related to the rate of IP3 production. Note that, since the rate of IP3 production is used as a direct measure of agonist concentration, this is equivalent to assuming that Ca2+ influx depends on agonist concentration directly. However, agonist concentration is not a variable in the model and thus cannot be used explicitly.
The pulses of IP3 are added via the function s(t) = M H(t − tpulse) × H(tpulse + twidth − t), where H is the Heaviside function, tpulse is the time the pulse is added, twidth is the width of the pulse, and M is the strength of the pulse.
The parameter values for the Atri model are δ = 0.01, k1 = 0.7 μM, γ = 5.405, k2 = 0.7 μM, kflux = 4.8 μM·s−1, kμ = 4 μM, Vp = 24 μM·s−1, τ = 2 s, Kp = 0.4 μM, μ0 = 0.57, Ve = 20 μM·s−1, μ1 = 0.433, Ke = 0.06 μM, b = 0.111, α1 = 1 μM·s−1, V1 = 0.889, α2 = 0.2 s−1, βst = 0.02 s−1, and βosc = 0.08 s−1.
The equations for the Li–Rinzel model of class 1 are
 |
 |
 |
where Jin = α1 + α2pst and where ce = (ct − c)/σ. The variable h is analogous to the inactivation variable h in the Hodgkin–Huxley model and represents the proportion of IP3 receptors that have not been closed by Ca2+. The parameter values are ε = 0.01, α1 = 400 μM·s−1, σ = 0.185, α2 = 100 s−1, fi = 0.01, L = 0.37 s−1, Vi = 4, P̃ = 26,640 s−1, Vp = 2,000 μM·s−1, A = 0.5 s−1, Kp = 0.3 μM, Ki = 1 μM, Ve = 400 μM·s−1, Ka = 0.4 μM, Ke = 0.2 μM, Kd = 0.4 μM, βst = 0.02 s−1, and βosc = 0.08 s−1.
The Li–Rinzel model of class 2 has h = Kd/(c + Kd), and p obeys the differential equation (Eq. 5).
Footnotes
Conflict of interest statement: No conflicts declared.
This paper was submitted directly (Track II) to the PNAS office.
References
- 1.Berridge M. J., Bootman M. D., Roderick H. L. Nat. Rev. Mol. Cell Biol. 2003;4:517–529. doi: 10.1038/nrm1155. [DOI] [PubMed] [Google Scholar]
- 2.Berridge M. J., Galione A. FASEB J. 1988;2:3074–3082. doi: 10.1096/fasebj.2.15.2847949. [DOI] [PubMed] [Google Scholar]
- 3.Tsien R.W., Tsien R.Y. Annu. Rev. Cell Biol. 1990;6:715–760. doi: 10.1146/annurev.cb.06.110190.003435. [DOI] [PubMed] [Google Scholar]
- 4.Atri A., Amundson J., Clapham D., Sneyd J. Biophys. J. 1993;65:1727–1739. doi: 10.1016/S0006-3495(93)81191-3. [DOI] [PMC free article] [PubMed] [Google Scholar]
- 5.De Young G. W., Keizer J. Proc. Natl. Acad. Sci. USA. 1992;89:9895–9899. doi: 10.1073/pnas.89.20.9895. [DOI] [PMC free article] [PubMed] [Google Scholar]
- 6.Li Y.-X., Rinzel J. J. Theor. Biol. 1994;166:461–473. doi: 10.1006/jtbi.1994.1041. [DOI] [PubMed] [Google Scholar]
- 7.Cuthbertson K. S. R., Chay T. R. Cell Calcium. 1991;12:97–109. doi: 10.1016/0143-4160(91)90012-4. [DOI] [PubMed] [Google Scholar]
- 8.Hofer T., Venance L., Giaume C. J. Neurosci. 2002;22:4850–4859. doi: 10.1523/JNEUROSCI.22-12-04850.2002. [DOI] [PMC free article] [PubMed] [Google Scholar]
- 9.Keizer J., Young G. W. D. Biophys. J. 1992;61:649–660. doi: 10.1016/S0006-3495(92)81870-2. [DOI] [PMC free article] [PubMed] [Google Scholar]
- 10.Hirose K., Kadowaki S., Tanabe M., Takeshima H., Iino M. Science. 1999;284:1527–1530. doi: 10.1126/science.284.5419.1527. [DOI] [PubMed] [Google Scholar]
- 11.Dupont G., Koukoui O., Clair C., Erneux C., Swillens S., Combettes L. FEBS Lett. 2003;534:101–105. doi: 10.1016/s0014-5793(02)03789-4. [DOI] [PubMed] [Google Scholar]
- 12.Wakui J., Potter B. V. L., Petersen O. H. Nature. 1989;339:317–320. doi: 10.1038/339317a0. [DOI] [PubMed] [Google Scholar]
- 13.Falcke M. Adv. Phys. 2004;53:255–440. [Google Scholar]
- 14.Schuster S., Marhl M., Höfer T. Eur. J. Biochem. 2002;269:1333–1355. doi: 10.1046/j.0014-2956.2001.02720.x. [DOI] [PubMed] [Google Scholar]
- 15.Glass L., Mackey M. C. From Clocks to Chaos. Princeton: Princeton Univ. Press; 1988. [Google Scholar]
- 16.Winfree A. T. The Geometry of Biological Time. Berlin: Springer; 1980. [Google Scholar]
- 17.Perez J. F., Sanderson M. J. J. Gen. Physiol. 2005;125:535–553. doi: 10.1085/jgp.200409216. [DOI] [PMC free article] [PubMed] [Google Scholar]
- 18.Perez J. F., Sanderson M. J. J. Gen. Physiol. 2005;125:555–567. doi: 10.1085/jgp.200409217. [DOI] [PMC free article] [PubMed] [Google Scholar]
- 19.Williams J. A., Korc M., Dormer R. L. Am. J. Physiol. 1978;235:517–524. doi: 10.1152/ajpendo.1978.235.5.E517. [DOI] [PubMed] [Google Scholar]
- 20.Giovannucci D. R., Bruce J. I., Straub S. V., Arreola J., Sneyd J., Shuttleworth T. J., Yule D. I. J. Physiol. 2002;540:469–484. doi: 10.1113/jphysiol.2001.013453. [DOI] [PMC free article] [PubMed] [Google Scholar]
- 21.Harootunian A. T., Kao J. P., Tsien R. Y. Cold Spring Harbor Symp. Quant. Biol. 1988;53:935–943. doi: 10.1101/sqb.1988.053.01.108. [DOI] [PubMed] [Google Scholar]
- 22.Wang S. S., Alousi A. A., Thompson S. H. J. Gen. Physiol. 1995;105:149–171. doi: 10.1085/jgp.105.1.149. [DOI] [PMC free article] [PubMed] [Google Scholar]
- 23.Sneyd J., Dufour J. F. Proc. Natl. Acad. Sci. USA. 2002;99:2398–2403. doi: 10.1073/pnas.032281999. [DOI] [PMC free article] [PubMed] [Google Scholar]
- 24.Nash M. S., Young K. W., Challiss R. A., Nahorski S. R. Nature. 2001;413:381–382. doi: 10.1038/35096643. [DOI] [PubMed] [Google Scholar]
- 25.Dupont G., Swillens S. Biophys. J. 1996;71:1714–1722. doi: 10.1016/S0006-3495(96)79373-6. [DOI] [PMC free article] [PubMed] [Google Scholar]
- 26.Sneyd J., LeBeau A., Yule D. Physica D. 2000;145:158–179. [Google Scholar]
- 27.Swillens S., Mercan D. Biochem. J. 1990;271:835–838. doi: 10.1042/bj2710835. [DOI] [PMC free article] [PubMed] [Google Scholar]
- 28.Falcke M., Hudson J. L., Camacho P., Lechleiter J. D. Biophys. J. 1999;77:37–44. doi: 10.1016/S0006-3495(99)76870-0. [DOI] [PMC free article] [PubMed] [Google Scholar]
- 29.Ermentrout B. Simulating, Analyzing, and Animating Dynamical Systems: A Guide to XPPAUT for Researchers and Students. Philadelphia: Soc. Indust. Appl. Math.; 2002. [Google Scholar]


