Abstract
As a consequence of adult neurogenesis, the olfactory bulb (OB) receives a continuous influx of newborn neurons well into adulthood. However, their rates of generation and turnover, the factors controlling their survival, and how newborn neurons intercalate into adult circuits are largely unknown. To visualize the dynamics of adult neurogenesis, we produced a line of transgenic mice expressing GFP in ≈70% of juxtaglomerular neurons (JGNs), a population that undergoes adult neurogenesis. Using in vivo two-photon microscopy, time-lapse analysis of identified JGN cell bodies revealed a neuronal turnover rate of ≈3% of this population per month. Although new neurons appeared and older ones disappeared, the overall number of JGNs remained constant. This approach provides a dynamic view of the actual appearance and disappearance of newborn neurons in the vertebrate central nervous system, and provides an experimental substrate for functional analysis of adult neurogenesis.
Keywords: neurogenesis, olfaction
Newborn neurons in the adult mammalian brain continuously migrate into the hippocampus and the olfactory bulb (OB) (1, 2). In the OB, newborn neurons originate in the subventricular zone and differentiate into two distinct populations of interneurons: granule cells and juxtaglomerular neurons (JGNs). Adult neurogenesis in the mammalian brain was discovered and has been primarily analyzed by methods that label dividing cells by incorporation of labeled cyclic nucleotides, such as radiolabeled thymidine or the uridine analogue 5-bromo-2-deoxyuridine (BrdUrd). These methods have significant limitations. For example, neither radiolabeled thymidine nor BrdUrd are neuron-specific, and both can be analyzed only in fixed tissue after histological processing. These caveats and others (see discussions in refs. 3 and 4) limit direct analysis of the dynamics of neurogenesis, such as turnover rates and subtle changes in levels of neurogenesis in response to different experimental conditions and manipulations.
To study adult neurogenesis using an alternative approach, we developed transgenic mice expressing GFP in a subset of JGNs and imaged adult neurogenesis over periods of up to 3 months, in vivo. We observed an ≈3%-per-month turnover rate of JGN in the OB. The number of newly appearing JGNs (representing newborn neurons) was balanced by the number of JGNs disappearing (presumably by cell death) thereby maintaining a stable population of JGN neurons.
Results
Labeling of JGNs in Transgenic Mice.
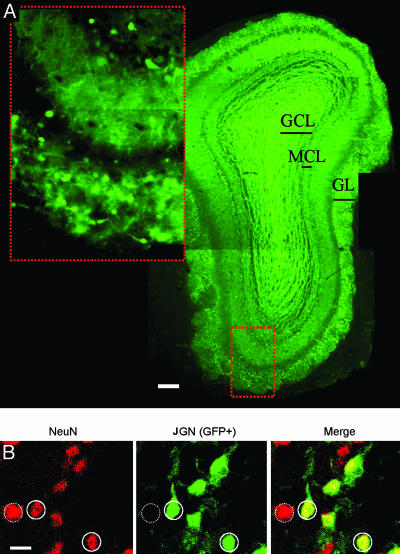
Using a methodology based on transgenic GFP expression under control of the Thy-1 promoter, Feng et al. (5) created a bevy of mouse lines in which distinct neuronal subpopulations were strongly labeled by GFP and other fluorescent proteins. These lines have proven invaluable for numerous in vivo imaging experiments (6–10) enabling visualization of axonal and dendritic dynamics in developing and adult animals. However, none of the existing lines of Thy-1–XFP mice has labeling in the regenerating populations of the OB (granule and juxtaglomerular neurons). Because the cellular labeling by the Thy-1–XFP transgene results from positional effects of the transgene insertion, the labeled brain regions and extent of labeling cannot be predicted. To develop a line with labeling in the appropriate cell populations, we therefore created and screened 14 new Thy-1–GFP lines. One line, named Thy-1–GFP–K12, expresses GFP in the JGN population. GFP expression in this line is neither as intense nor extensive as the Golgi-like labeling in some previously described lines (5) but is concentrated in the cell body and proximal dendrites with sufficient intensity and contrast for in vivo two-photon imaging of labeled somata. Scattered GFP-positive neurons are present in numerous other regions including the midbrain, thalamus, striatum, and accessory OB. GFP is not expressed in the newborn neurons in the subventricular zone and rostral migratory stream. In the main OB, GFP expression is evident both in fully developed JGNs and in the mitral/tufted (M/T) neurons (Fig. 1A).
Fig. 1.
GFP expression in the OB of Thy-1–GFP–K12 mice. (A) Fluorescent micrograph (montage of three images) of a coronal slice from an adult Thy-1–GFP–K12 mouse OB. GFP expression is diffuse in the GC layer (GCL) but confined to cell bodies in the mitral cell layer (MCL) and glomerular layer (GL). (Inset) High magnification of the GL and MCL showing that GFP is expressed in cell bodies and primary dendrites but not in higher order dendrites. The Inset and the dotted red box of the lower magnification image are the same region. (Scale bar: 100 μm.) (B) Confocal micrographs of the GL from the bulb of a Thy-1–GFP–K12 mouse processed with an antibody to the neuronal marker NeuN (red). GFP (green) is expressed by the transgene. Some neurons express both GFP and NeuN (solid circles), and some neurons express NeuN but not GFP (dotted circle). The vast majority of cells expressing GFP also expressed NeuN, indicating that the GFP is expressed in a subset of neurons. (Scale bar: 10 μm.)
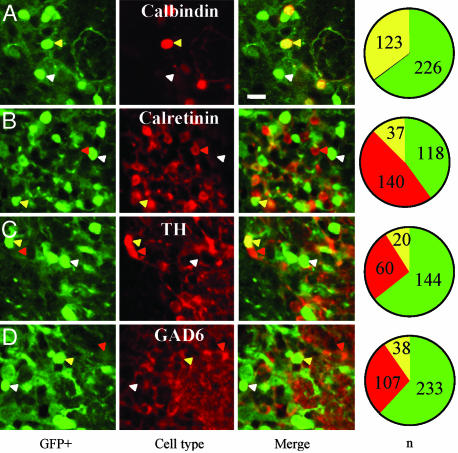
To quantify the extent of neuronal expression of the GFP-positive cells, we immunolabeled OB slices with the pan-neuronal marker NeuN. Quantification of double- vs. single-labeled cells reveals that 70% of the JGN population in the Thy-1–GFP–K12 mice express GFP (Fig. 1B). GFP expression is confined almost exclusively to neurons, and no glia express GFP in double fluorescent-labeling experiments with anti-glial fibrillary acidic protein (GFAP) and GFP (data not shown). Because the JGN population is not neurochemically homogenous (11, 12), we tested whether the GFP-positive JGN population comprised a specific phenotype or whether GFP-positive neurons span a larger phenotypic range, using double fluorescent staining with antibodies directed against calbindin, calretinin, tyrosine hydroxylase (TH), and glutamic acid decarboxylase (GAD). Neurons were characterized either as GFP+/[Phenotype]−, GFP−/[Phenotype]+, or GFP+/[Phenotype]+. All calbindin neurons were GFP+/Calbindin+ (Fig. 2A), but other cell phenotypes showed only partial GFP expression (Fig. 2 B–D). Because we did not exhaust all possible labeling combinations between phenotypes, it is difficult to construct a complete quantitative description of GFP expression in all JGN phenotypes; however, GFP expression is clearly not restricted to a specific JGN phenotype but rather represents a broad range of JGN phenotypes.
Fig. 2.
Quantification of GFP expression in different JGN phenotypes. (A–D) Images in Left are GFP fluorescence (green), Middle images denote the neurochemical phenotype (red), and Right images are a merge of the green and red images. Cells were assigned to one of three categories: (i) GFP+/Phenotype− (white arrowheads; green in pie chart), (ii) GFP−/Phenotype+ (red arrowheads; red in pie chart), and (iii) GFP+/Phenotype+ (yellow arrowheads; yellow in pie chart). Four different phenotypes were tested: calbindin (A), calretinin (B), tyrosine hydroxylase (TH) (C), and glutamic acid decarboxylase (GAD6) (D). The pie charts show the quantitative analysis of the different cellular categories of the experiment, and the numbers correspond to the total number of neurons that were counted from several such micrographs. (Scale bar: 10 μm.)
In Vivo Imaging of Neuronal Turnover.
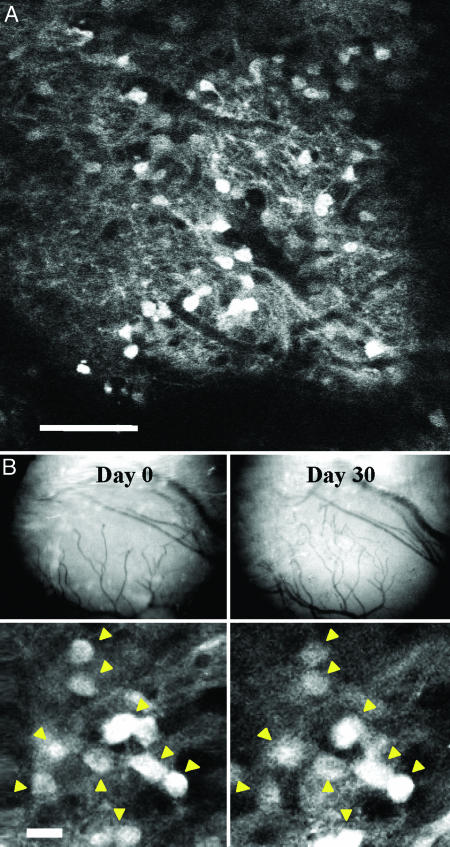
In this line of mice, GFP-labeling of JGN cell bodies made visualization of individual cells straightforward using in vivo two-photon laser scanning microscopy. Importantly, GFP expression per se does not have any apparent detrimental effects on neurons and can be repeatedly imaged for prolonged periods (13). A small craniotomy over the OB revealed ≈100 glomeruli on the dorsal surface. Using methods we have described previously, we could readily image several hundred micrometers deep into the tissue (8), allowing us to record the positions of both JGN and mitral cell bodies. To determine the dynamic behavior of the JGN population, we counted identified cell bodies over periods ranging from days to months. Typically, we repeatedly imaged single brain regions encompassing three to four glomeruli (normally 230 μm × 230 μm × 100 μm in the x, y, and z axes, respectively). This produced high-resolution images of cell bodies decorating the circumference of dorsal glomeruli (Fig. 3A; the complete image stack is shown as Movie 1, which is published as supporting information on the PNAS web site).
Fig. 3.
In vivo imaging of the JGN population. (A) Single optical slice from the GL of a Thy-1–GFP–K12 mouse. The image is a raw data image and shows JGN cell bodies at a depth of ≈80 μm beneath the pial surface. The complete image stack (showing other image planes above and below this section) is shown in Movie 1. (Scale bar: 50 μm.) (B) Time-lapse in vivo imaging. (Upper) Blood vessel pattern of the dorsal surface of the OB. Note that the large blood vessels remained similar and are used for coarse alignment. (Lower) High-magnification optical sections (raw data of single optical planes) of the same glomerular region populated with JGNs. All neurons in this region can be identified at the two time points (yellow arrowheads) and are used for fine alignment. (Scale bar: 10 μm.)
We initially imaged cell bodies of GFP-positive JGNs 30 days apart. Based on DNA labeling experiments and retroviral labeling over this time period newborn JGNs are expected to appear in the GL (14, 15). Mice were imaged on a custom-made stereotaxic device that allowed precise repeated orientation of the skull into the identical position in multiple imaging sessions (see Methods and ref. 8). Gross and fine alignment was attained by the blood vessel pattern on the surface of the brain and the geometrical orientation of identified JGN cell bodies, respectively (Fig. 3B). Although fluorescent intensities varied between imaging sessions, clusters of cell bodies were readily re-identified and were used as landmarks for subsequent quantitative analysis (Fig. 3B). Two complete raw image stacks, obtained 30 days apart, show that similar clusters of neurons can be readily re-identified (Movies 2 and 3, which are published as supporting information on the PNAS web site). For example, note the group of five JGNs in the central field of view in both movies (red rectangles on the first image in Movies 2 and 3 and Fig. 6, which is published as supporting information on the PNAS web site). When analyzed in magnified view and in three dimensions, these cells are clearly the same group of neurons (Fig. 6 and Movie 4, which is published as supporting information on the PNAS web site).
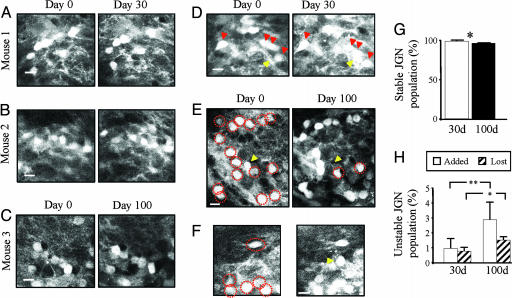
We repeatedly imaged JGN cell bodies 30 (n = 4 mice) and 100 days apart (n = 3 mice). Cells were counted manually by analyzing the 3D image stacks using software that enabled comparison of cell positions in different sets of image stacks (16). Cell bodies were counted as “stable” (appearing in both sessions), “added” (appearing only in the second session), or “lost” (appearing only in the first session). The vast majority of neurons were stable (Fig. 4 A–C and G). In all long-term imaging sessions, we identified both “added” JGNs (Fig. 4 D and F) and “lost” JGNs (Fig. 4 E and H). Based on time-lapse imaging of >1,000 JGNs (an average of 143 JGNs per animal), we determined that the turnover of GFP-positive JGNs is ≈2% per month. This turnover value was consistent both at the 30- and 100-day intervals. The number of added and lost JGNs was not significantly different, indicating that the number of newborn neurons is balanced by the number of lost neurons, thereby maintaining a stable JGN population (Fig. 4H).
Fig. 4.
In vivo analysis of JGN turnover. (A–F) Representative examples of in vivo time-lapse images of the JGN population. (A–C) Examples from two different mice imaged at 30-day intervals (A and B) and from a 100-day-interval experiment (C). All cell bodies can be re-identified in this field of view. All images are unprocessed raw data showing single optical sections. (D–F) Examples of JGN dynamics from a 30-day interval (D), added cell body highlighted with a yellow arrowhead), and 100-day experiments (E). In D and F, a new cell is gained (yellow arrowhead), whereas in E, a previously present cell was lost (yellow arrowhead). Stable cells are denoted with red circles. (G) Histogram of the average value of stable JGN cell bodies in both 30- and 100-day-interval experiments. (H) Statistical breakdown of the gain and loss of JGN cell bodies in the 30- and 100-day experiments. Both the level of stability and dynamics are significantly different between the 30- and 100-day experiments (Student’s t test). ∗, P < 0.05; ∗∗, P < 0.01. (Scale bars in A–F: 10 μm.)
Imaging Dynamic and Stable Neuronal Populations.
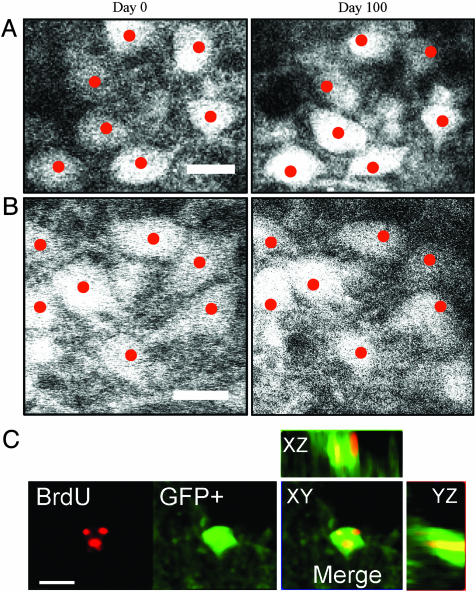
Our observations of neurogenesis are based on the appearance and disappearance of GFP-labeled cell bodies. To address the possibility that changes in GFP expression could explain the apparent appearance and disappearance of neurons, we simultaneously imaged both the JGN population (a dynamic population) and the M/T population (a stable population) over a 100-day interval. Whereas JGNs appeared and disappeared, the number and position of M/T cells were stable because all of the 81 cells imaged (n = 2 mice) remained with no detectable additions or losses. Both M/T cells and JGN showed changes in fluorescent intensity, but appearance and disappearance of cell bodies was observed exclusively in the JGN population (Fig. 5A and B). To further validate that GFP-positive neurons are part of the newly generated population of cells, we injected Thy-1–GFP–K12 mice with BrdUrd to label newborn cells. We performed double labeling on sections of the OB with antibodies directed against BrdUrd and GFP. Double-labeled neurons appeared only in the GL. A single BrdUrd injection resulted in relatively small numbers of BrdUrd-labeled cells as assessed 30 days after injection (144 cells located around 206 glomeruli) (see Fig. 7, which is published as supporting information on the PNAS web site). One example of a double-labeled cell, 2 weeks after BrdUrd injection, is shown in Fig. 5C. Together, these data provide independent lines of evidence that we are indeed following JGN turnover and that it is possible to use two-photon microscopy to follow neurogenesis in vivo. These therefore provide direct observations of neuronal gain and loss in the intact adult mammalian brain.
Fig. 5.
Control experiments. (A and B) Time-lapse imaging of M/T cell bodies (≈300 μm beneath the pial surface). Two representative examples of the same population of M/T cell bodies imaged 100 days apart. Compared with JGNs, both the number and position of M/T cells are stable (red dots are shown for alignment between images). (C) Confocal micrograph of a BrdUrd-labeled cell (red) and a GFP-positive neuron (green). The overlay of three different views (XY, XZ, and YZ) show that the BrdUrd label is encompassed within this GFP-labeled cell body. (Scale bars: A and B, 20 μm; C, 10 μm.)
Discussion
We developed a new experimental setting to study neurogenesis in the mammalian central nervous system. The JGN population was targeted by using transgenesis and imaged by using in vivo two-photon microscopy over months. Because only 70% of the JGN population is GFP-labeled in this mouse line, we infer an overall turnover rate of ≈3%. This value (3%) might vary to some extent. First, we scored cells as added or lost only if they were completely new or absent from the field of view and only if the geometrical relationship of closely positioned cells was stable between imaging sessions. Thus, a certain level of stability was required for analysis. This stability probably led us to underestimate the level of neurogenesis. On the other hand, it is conceivable that the remaining 30% of the JGN population (those not expressing GFP) show completely different dynamics (either slower or higher). This possibility seems unlikely because immunohistochemical labeling demonstrates that we are sampling representatives from all of the known neurochemical classes of the JGN neurons. Thus, we believe that the observed turnover rates represent the whole JGN population. Notwithstanding, our method is the first to directly observe population dynamics in this subclass of neurons, in vivo.
One clear advantage of our method is our ability to study the same JGN population repeatedly, enabling the study of subtle in vivo dynamics not possible otherwise (e.g., using histology). Our method might be used in combination with other in vivo imaging techniques like intrinsic signal imaging or voltage-sensitive-dye imaging to explore how changes in activity correlates with neurogenesis. One limitation of our technique remains the incomplete surface area of OB available for imaging (i.e., only the dorsal surface of the OB). Although we use this “window” as an approximation to neurogenesis throughout the glomerular region, it might not be a true representation. The level of neurogenesis in different spatial regions of the glomerular sheath remains to be further investigated.
We chose the use of the Thy-1 promoter because it has proven invaluable for numerous long-term imaging studies (8–13). This promoter proved to be expressed stably for several months in different neuronal populations ranging from neuromuscular junctions to cortical neurons. In the cortex, even subtle differences in dendritic spines (10-fold smaller structures than the cell bodies counted here) could be reliably detected. However, other promoters and genetic combinations may well prove useful. For example, in vivo imaging of specific neuronal populations by using cell-specific promoters can be used to discover whether neurogenesis differs in different JGN subpopulations. Also notable are differences in fluorescent levels at different time points (see quantitative analysis and discussion in Fig. 8, which is published as supporting information on the PNAS web site). Fluorescent intensity is one measure difficult to be rigorously controlled in the thick and highly scattering tissue of an in vivo preparation. Although differences in intensity might reflect some real (yet unknown) biological measure, we limited our study only to the presence or absence of a cell in the field of view. Because cell bodies are well within our resolution, we think our criteria for data point selection is conservative. In the future, fluorescent intensities might be used to study expression levels of well characterized promoters.
If a 3% turnover value of neurogenesis is constant over the lifetime of the adult mouse, this value implies that the JGN population turns over completely only once during a period of 35 months, which is essentially the maximum lifespan of a laboratory mouse. It is noteworthy, however, that we started analyzing animals at ≈70 days of age and followed them up to 170 days postnatally. Although these may be considered “adult” animals by numerous standards, caution should be made when implicating to all ages. Indeed, neurogenesis decreases with increasing age of the animal (17). Our values are thus relevant to early adulthood and probably represent some upper limit of neurogenesis in the lifetime of the adult mouse. It has also been shown that neurogenesis during the early postnatal life is markedly different from that in early adulthood. Newborn granular cells (GCs) born at postnatal day (PD) 3 to PD7 are targeted to different layers within the granule cell layer than newborn GCs born at PD60 (18). Thus, neurogenesis at different ages has different spatiotemporal profiles and might well serve different functions. Our method is well suited to study neurogenesis across all age groups.
What biological function, if any, could such a slow pace of turnover serve during early adulthood? Adult neurogenesis of GCs in the hippocampus and the OB have both been suggested to be involved in learning and memory (19–21), as has neurogenesis in songbirds (22, 23). Recently, the rate of GC turnover has been estimated at almost five times higher (14% per month) than the value we find for the JGNs (24). Given the slower rate of turnover, it is unlikely that JGN neurogenesis is important for learning and memory, especially because the number of newborn GCs in the bulb dwarfs the number of new JGN neurons. Notwithstanding, the role of newborn GCs in memory formation remains an open question (for a recent review, see ref. 25).
Circuitry in the glomeruli is highly dynamic because olfactory sensory neurons are also known to turn over rapidly (26). Because sensory neuron axons synapse directly onto M/T dendrites (27) and JGNs shape the electrophysiological input from olfactory sensory neurons (12, 28, 29), JGN neurogenesis may play a role in maintaining correct wiring. Newly formed dendrites from newly arrived JGNs may provide the appropriate postsynaptic substrate for the in-growing axons of newly generated sensory neurons. Consistent with this idea, we have recently shown that although dendrites of M/T cells remain generally stable, structural dynamics at dendritic tips are always evident (8). Although this remains to be proven, such fine structural dynamics of M/T dendrites may work in concert with the newly formed JGN dendrites to maintain the olfactory sensory neuron–JGN–M/T synaptic triad.
Methods
Generation of Transgenic Mice.
To generate new lines of Thy-1–GFP transgenic mice, a cDNA encoding EGFP (Clontech) was subcloned into the modified Thy-1 vector, which contains 3.5-kb 5′ regulatory sequences and a 2.5-kb 3′ untranslated region (5, 30). Transgenic mice were generated by injection of gel-purified DNA constructs into fertilized oocytes, using standard pronuclear injection techniques (31). Fertilized eggs were collected from mating males and superovulated females of C57BL/6J and CBA F1 hybrids. Genotypes were determined by PCR from mouse tail DNA samples. A forward PCR primer from the mouse Thy-1.2 gene (Thy1F1, TCTGAGTGGCAAAGGACCTTAGG) and a reverse primer from the EGFP sequence (EGFPR1, CGCTGAACTTGTGGCCGTTTACG) were used for genotyping. PCR-positive animals were kept as founders to establish transgenic lines by mating to C57BL/6J mice.
Animals.
Adult (PD55–PD80) transgenic mice were used in all experiments. Animals were maintained at the Duke University animal facility. Animal care and experiments were in accordance with the National Institutes of Health guidelines and approved by the Duke University Institutional Animal Care and Use Committee.
Two-Photon Imaging and Analysis.
Mice were anesthetized by ketamine/xylazine (0.1 mg per g of body weight, i.p.). Additional anesthesia (1% isoflurane in O2, by inhalation) was supplied as needed. Body temperature was maintained at 38°C, heart rate, and blood oxygenation (SpO2) were monitored. The skull overlying the OB was either thinned or partially removed and a cranial window over the OB was constructed as described in ref. 8. Imaging was carried out on a Zeiss LSM 510 microscope equipped with a ×40 (0.8 numerical aperture) Achroplan water immersion objective. A femtosecond laser (Tsunami, Spectra Physics) was used to excite GFP at ≈900 nm.
Images (1, 024 × 1, 024 pixels) were acquired at 0.22-μm resolution in the XY dimension and 2 μm in the Z dimension. Care was taken to adjust fluorescence levels to partial saturation of the central region of the cell bodies. Under these conditions, imaging was stable with no movements caused by heartbeat or respiration. Quantitative analyses of neuronal turnover were performed manually by using a program written in matlab (Mathworks) that enabled simultaneous visual comparison of two Z stacks as described for spine counting (16). All images within the 3D image stacks were analyzed without any image processing. All of the cells were scored as either “stable, ” “added, ” or “lost.” Cells were scored as “added” or “lost” only if they appeared (or disappeared) from a larger group of “stable” population. Given the relatively large size of neuronal cell bodies (≈7–10 μm in diameter) all of the cell bodies within a volume could be resolved.
Immunocytochemistry and Histology.
Mice were perfused transcardially with 0.9% saline followed by 4% paraformaldehyde, and the brains were prepared for histology as described in ref. 16. Brains were sectioned coronally (40 μm) on a sliding microtome and processed with the following primary antibodies: mouse anti-NeuN (1:1,000), rabbit anti-TH (1:540), rabbit anti-GFAP (1:10, 000), chicken anti-GFP (1:2,500), rabbit anti-calbindin (1:1,000), and rabbit anti-calretinin (1:1,000) from Chemicon; rat anti-BrdUrd (1:200) from Accurate Scientific; and mouse anti-GAD6 from Developmental Studies Hybridoma Bank (Iowa City). The following secondary antibodies were used: goat anti-rabbit Cy3 (1:500), goat anti-mouse Cy3 (1:500), and donkey anti-rat Cy5 (1:500) from Chemicon; goat anti-chicken Alexa Fluor 488 (10 μg/ml) from Molecular Probes; and biotinylated rabbit anti-rat (1:100) from Vector Laboratories. Amplification was carried out by using Texas red streptavidin (5 μg/ml; Vector Laboratories) or streptavidin Cy5 (2 μg/ml; Jackson ImmunoResearch).
For the BrdUrd labeling in Fig. 5, BrdUrd was injected four times on a single day (50 μg per g of body weight dissolved in distilled water), and the animal was killed 21 days later and prepared for histology. For Fig. 7, the animal was killed on day 1 or day 30 after injection. BrdUrd staining was performed on a free-floating section pretreated for DNA denaturation (by incubation in 2 M HCl at room temperature for 30 min). For double detection of both BrdUrd and GFP, the GFP was immunolocalized before BrdUrd staining because native GFP fluorescence is abolished by the DNA denaturation protocol.
Slices were imaged at high resolution with a confocal microscope (Zeiss LSM510) using a ×40 (1.3 numerical aperture) oil-immersion objective. Cell counting was performed by choosing 10 random regions and manually counting all of the cells (scored as either singly or doubly labeled).
Additional Controls.
Surgery did not seem to chronically impair neurogenesis because mice that underwent surgery had similar levels of neurogenesis to mice that did not as compared by the BrdUrd label of injections 3 days after surgery (data not shown). Although we did not exhaust a comparison across many mouse species, levels of neurogenesis seemed generally comparable to C57BL/6J mice (data not shown). This finding argues that this transgenic method does not impair neurogenesis.
Supplementary Material
Acknowledgments
G.F. is supported by a Beckman Young Investigator Award from the Arnold and Mabel Beckman Foundation. A.M. is supported by a fellowship from the International Human Frontier Science Program Organization. This work was supported by National Institutes of Health Grant DC005671. L.C.K. was an investigator in the Howard Hughes Medical Institute.
Abbreviations
- GC
granular cell
- GL
glomerular layer
- JGN
juxtaglomerular neuron
- M/T
mitral/tufted
- OB
olfactory bulb
- PD
postnatal day.
Footnotes
§Deceased November 26, 2005.
Conflict of interest statement: No conflicts declared.
This paper was submitted directly (Track II) to the PNAS office.
References
- 1.Altman J. J. Comp. Neurol. 1969;137:433–457. doi: 10.1002/cne.901370404. [DOI] [PubMed] [Google Scholar]
- 2.Gross C. G. Nat. Rev. Neurosci. 2000;1:67–73. doi: 10.1038/35036235. [DOI] [PubMed] [Google Scholar]
- 3.Gould E., Gross C. G. J. Neurosci. 2002;22:619–623. doi: 10.1523/JNEUROSCI.22-03-00619.2002. [DOI] [PMC free article] [PubMed] [Google Scholar]
- 4.Rakic P. J. Neurosci. 2002;22:614–618. doi: 10.1523/JNEUROSCI.22-03-00614.2002. [DOI] [PMC free article] [PubMed] [Google Scholar]
- 5.Feng G., Mellor R. H., Bernstein M., Keller-Peck C., Nguyen Q. T., Wallace M., Nerbonne J. M., Lichtman J. W., Sanes J. R. Neuron. 2000;28:41–51. doi: 10.1016/s0896-6273(00)00084-2. [DOI] [PubMed] [Google Scholar]
- 6.Gan W. B., Kwon E., Feng G., Sanes J. R., Lichtman J. W. Nat. Neurosci. 2003;6:956–960. doi: 10.1038/nn1115. [DOI] [PubMed] [Google Scholar]
- 7.Grutzendler J., Kasthuri N., Gan W. B. Nature. 2002;420:812–816. doi: 10.1038/nature01276. [DOI] [PubMed] [Google Scholar]
- 8.Mizrahi A., Katz L. C. Nat. Neurosci. 2003;6:1201–1207. doi: 10.1038/nn1133. [DOI] [PubMed] [Google Scholar]
- 9.Nguyen Q. T., Sanes J. R., Lichtman J. W. Nat. Neurosci. 2002;5:861–867. doi: 10.1038/nn905. [DOI] [PubMed] [Google Scholar]
- 10.Trachtenberg J. T., Chen B. E., Knott G. W., Feng G., Sanes J. R., Welker E., Svoboda K. Nature. 2002;420:788–794. doi: 10.1038/nature01273. [DOI] [PubMed] [Google Scholar]
- 11.Kosaka K., Toida K., Aika Y., Kosaka T. Neurosci. Res. 1998;30:101–110. doi: 10.1016/s0168-0102(98)00002-9. [DOI] [PubMed] [Google Scholar]
- 12.Shepherd G. M., Chen W. R., Greer C. A. In: The Synaptic Organization of the Brain. Shepherd G. M., editor. New York: Oxford Univ. Press; 2004. pp. 165–216. [Google Scholar]
- 13.Young P., Feng G. Curr. Opin. Neurobiol. 2004;14:642–646. doi: 10.1016/j.conb.2004.08.007. [DOI] [PubMed] [Google Scholar]
- 14.Carleton A., Petreanu L. T., Lansford R., Alvarez-Buylla A., Lledo P. M. Nat. Neurosci. 2003;6:507–518. doi: 10.1038/nn1048. [DOI] [PubMed] [Google Scholar]
- 15.Lois C., Alvarez-Buylla A. Science. 1994;264:1145–1148. doi: 10.1126/science.8178174. [DOI] [PubMed] [Google Scholar]
- 16.Mizrahi A., Crowley J. C., Shtoyerman E., Katz L. C. J. Neurosci. 2004;24:3147–3151. doi: 10.1523/JNEUROSCI.5218-03.2004. [DOI] [PMC free article] [PubMed] [Google Scholar]
- 17.Kuhn H. G., Dickinson-Anson H., Gage F. H. J. Neurosci. 1996;16:2027–2033. doi: 10.1523/JNEUROSCI.16-06-02027.1996. [DOI] [PMC free article] [PubMed] [Google Scholar]
- 18.Lemasson M., Saghatelyan A., Olivo-Marin J. C., Lledo P. M. J. Neurosci. 2005;25:6816–6825. doi: 10.1523/JNEUROSCI.1114-05.2005. [DOI] [PMC free article] [PubMed] [Google Scholar]
- 19.Kempermann G., Wiskott L., Gage F. H. Curr. Opin. Neurobiol. 2004;14:186–191. doi: 10.1016/j.conb.2004.03.001. [DOI] [PubMed] [Google Scholar]
- 20.Rochefort C., Gheusi G., Vincent J. D., Lledo P. M. J. Neurosci. 2002;22:2679–2689. doi: 10.1523/JNEUROSCI.22-07-02679.2002. [DOI] [PMC free article] [PubMed] [Google Scholar]
- 21.Shors T. J., Miesegaes G., Beylin A., Zhao M., Rydel T., Gould E. Nature. 2001;410:372–376. doi: 10.1038/35066584. [DOI] [PubMed] [Google Scholar]
- 22.Brainard M. S., Doupe A. J. Nature. 2002;417:351–358. doi: 10.1038/417351a. [DOI] [PubMed] [Google Scholar]
- 23.Li X. C., Jarvis E. D., Alvarez-Borda B., Lim D. A., Nottebohm F. Proc. Natl. Acad. Sci. USA. 2000;97:8584–8589. doi: 10.1073/pnas.140222497. [DOI] [PMC free article] [PubMed] [Google Scholar]
- 24.Petreanu L., Alvarez-Buylla A. J. Neurosci. 2002;22:6106–6113. doi: 10.1523/JNEUROSCI.22-14-06106.2002. [DOI] [PMC free article] [PubMed] [Google Scholar]
- 25.Doetsch F., Hen R. Curr. Opin. Neurobiol. 2005;15:121–128. doi: 10.1016/j.conb.2005.01.018. [DOI] [PubMed] [Google Scholar]
- 26.Mackay-Sim A., Kittel P. J. Neurosci. 1991;11:979–984. doi: 10.1523/JNEUROSCI.11-04-00979.1991. [DOI] [PMC free article] [PubMed] [Google Scholar]
- 27.Kosaka K., Aika Y., Toida K., Kosaka T. J. Comp. Neurol. 2001;440:219–235. doi: 10.1002/cne.1381. [DOI] [PubMed] [Google Scholar]
- 28.Aungst J. L., Heyward P. M., Puche A. C., Karnup S. V., Hayar A., Szabo G., Shipley M. T. Nature. 2003;426:623–629. doi: 10.1038/nature02185. [DOI] [PubMed] [Google Scholar]
- 29.Schoppa N. E., Urban N. N. Trends Neurosci. 2003;26:501–506. doi: 10.1016/S0166-2236(03)00228-5. [DOI] [PubMed] [Google Scholar]
- 30.Vidal M., Morris R., Grosveld F., Spanopoulou E. EMBO J. 1990;9:833–840. doi: 10.1002/j.1460-2075.1990.tb08180.x. [DOI] [PMC free article] [PubMed] [Google Scholar]
- Feng G., Gross J., Lu J. In: Methods in Molecular Medicine. Luo D. Z., editor. Totowa, NJ: Humana; in press. [Google Scholar]
Associated Data
This section collects any data citations, data availability statements, or supplementary materials included in this article.


