


Abstract
The oncogene BMI1 encodes a polycomb group transcription factor that is required for embryonic development and self-renewal of stem cells. Despite these important functions little is known about the regulation of BMI1 expression. A cDNA microarray based search for target genes of E2F-1 in neuroblastoma cells expressing a 4-OHT-regulated E2F-1-ER fusion protein identified many hitherto unknown E2F-1 regulated genes. A total of 10% of these genes, including BMI1, encode proteins that function primarily in the regulation of gene expression. The BMI1 promoter contains a putative E2F binding site that was required for the activation of a BMI1 promoter-dependent reporter construct by E2F-1. Chromatin immunoprecipitation revealed 4-OHT-dependent binding of E2F-1-ER and binding of endogenous E2F-1 to the BMI1 promoter in tumor cells. We have previously shown activation of the oncogene MYCN by E2F. Thus, in neuroblastomas deregulated E2F-1 can activate two oncogenes, MYCN and BMI1 that are known to co-operate in tumor formation. Consistent with a role of Bmi1 in neuroblastoma tumorigenesis we found strong Bmi1 expression in primary neuroblastomas. Our results reveal a novel link between E2F and polycomb transcription factors and suggest a role of Bmi1 in neuroblastomas.
INTRODUCTION
The Bmi1 protein is a member of the polycomb group (PcG) proteins. PcG proteins form multiprotein complexes that function as transcriptional repressors [for a review see (1)]. Several distinct PcG complexes have been described (2,3). One of these, termed polycomb repressive complex 2 (PRC2), contains the PcG group proteins Ezh2 and Eed. The core of the other complex, termed polycomb repressive complex 1 (PRC1), in Drosophila contains the Bmi1-homologous protein Psc (posterior sex combs), Ph (polyhomeotic), Pc (polycomb) and Ring-1 (4,5). The corresponding complex in human cells, hPRC, consists of the orthologous set of proteins (6). The two different PcG complexes are functionally redundant in the control of HOX gene expression during embryonic development but act antagonistically on the proliferation of hematopoietic cells (7).
Several lines of evidence implicate Bmi1 in tumorigenesis. Firstly, Bmi1 cooperates with c-Myc in the generation of lymphomas in double transgenic mice (8,9). Secondly, Bmi1 blocks senescence and immortalizes mouse embryo fibroblasts, although not human fibroblasts, and in combination with an activated H-ras gene leads to neoplastic transformation (10). These oncogenic functions depend on the ability of Bmi1 to repress the INK4A-locus, which encodes the tumor suppressor proteins p16Ink4a and p14Arf. Thirdly, the BMI1 gene is amplified in certain mantle cell lymphomas and is overexpressed in a subset of non-small cell lung cancer, colorectal carcinomas, multiple myelomas and medulloblastomas, but not glioblastomas (11–15). Fourthly, the transformation of human hematopoietic progenitor cells by the oncogenic fusion protein E2a-Pbx1 requires Bmi1 (16). Indeed, based on a list of genes differentially expressed in a mouse model of metastatic prostate cancer on a wild-type and bmi1-deficient genetic background a gene signature was recently identified that may predict response to therapy and survival in multiple types of cancer (17).
The oncogenic activity of Bmi1 may be linked to another fundamental function of Bmi1. Several recent reports showed that Bmi1 is essential for the self-renewal of both hematopoietic and neuronal stem cells as well as cancer stem cells (11,18–20). This function of Bmi1 depends on its ability to repress the INK4A-locus. Consistent with a role of Bmi1 in stem cell biology, BMI1 expression in the bone marrow is strong in undifferentiated precursor cells but gradually declines in the course of differentiation (21). This expression pattern distinguishes BMI1 from most other PcG genes, whose expression increases during differentiation of hematopoietic cells. Despite these important functions little is known about the transcriptional regulation of the BMI1 gene. The only transcription factor known to regulate BMI1 expression is the sonic hedgehog-activated Gli1 protein (22). Whether this regulation is direct is not known.
Neuroblastoma is an early childhood tumor of the peripheral nervous system developing from an as yet undefined population of neural crest derived cells [reviewed in (23)]. Several observations, including the early onset of the disease and the potential of some neuroblastoma cell lines to differentiate into several distinct cell types in vitro, point to neuroblastoma as a disease of neural crest derived stem cells (24–26). Several genetic changes including amplification of the MYCN gene are used to predict neuroblastoma progression and outcome (27). In contrast, the events that initiate neuroblastomas are unknown.
E2F transcription factors control several distinct genetic programs including cell cycle progression and apoptosis (28–30). E2F-activity is controlled by the retinoblastoma pathway, which is deregulated in the majority of human cancers. In neuroblastomas, E2F proteins regulate the expression of the MYCN gene, which is the single most important molecular marker of a subset of aggressive neuroblastomas (31). Recently, expression of the mitotic checkpoint gene MAD2, also a direct target gene of E2F, was shown to closely correlate with poor prognosis in neuroblastoma patients, suggesting that E2F-activity and strong expression of E2F-regulated genes, respectively, may predict outcome (32).
Here we show that the oncogene BMI1 is a direct target gene of E2F-1. In addition, we show that Bmi1 is strongly expressed in primary neuroblastomas. These data provide a novel link between E2F and polycomb group proteins and suggest a role of Bmi1 in neuroblastomas.
MATERIALS AND METHODS
Cell culture
Neuroblastoma cells were cultured as described (33). Primary mouse embryo fibroblasts were isolated from day E13.5 embryos and cultured in DMEM medium containing 10% fetal calf serum (FCS). Drugs were added to the cell culture medium at the following concentrations: 4-OHT: 200 nM; G418: 200 µg/ml. cycloheximide (ICN Biomedicals, Cat. # 194 527): 20 µg/ml; the inhibitory effect on protein synthesis of the batch of cycloheximide used was tested in a parallel experiment by measuring the inhibition of 13C-Methionine incorporation. 1A3 is a clone of SK-N-SH-EP neuroblastoma cells stably expressing an E2F-1-ER fusion protein (34).
Cell synchronization and flow cytometry
1A3 cells and mouse embryo fibroblasts were starved in serum free medium for 42 and 36 h, respectively, and then stimulated to re-enter the cell cycle with 10% FCS. At different times cells were harvested for isolation of RNA or fixed and stained with propidium iodide for analysis of cell cycle distribution using a FACS Calibur.
Plasmids, transfection and reporter assay
For cloning of the luciferase reporter constructs an 816 bp NotI-fragment of the human BMI1 gene was isolated from the BAC-clone RP11-232K21 (obtained from the German Resource Center for Genome Research, Berlin) and inserted into NotI-digested pBluescript. From there the promoter fragment was transferred as a SacI/XhoI-fragment into pGL3-Basic resulting in pGL3-BMI1wt. To obtain pGL3-BMI1mut clustered point mutations were introduced into the putative E2F binding site using the QuikChange Site-Directed Mutagenesis Kit and primers that create a novel NheI restriction site. Cells were transfected in DMEM medium using calcium phosphate precipitation. The reporter assays were performed as described (31). The following amounts of plasmids were co-transfected: 2.5 µg pCMV-eGFP, 2.5 µg pCMV-lacZ, 2.5 µg each of pCMV-E2F-1 and pCMV-DP1 and 6 µg of pGL3-BMIwt or pGL3-BMImut.
cDNA microarray experiments and statistical analysis
The procedure has been described in detail (35). Briefly, total RNA was prepared from untreated and drug-treated cells using the RNeasy Kit (Quiagen). An aliquot of 40 µg of RNA was used to synthesize Cy3- and Cy5-labeled cDNAs. The microarray used contained a total of 11 500 sequence-verified UniGene cDNAs (Research Genetics, Huntsville, Alabama). The labeled cDNAs were hybridized to two microarrays simultaneously. A flip colour experiment was performed with RNA from an independent experiment. The procedure used to control the quality of the primary data and the details of the statistical analysis have been described (35).
Quantitative RT–PCR
Total cytoplasmic RNA was isolated with the RNeasy Kit (Qiagen) or Trizol Reagent, and 1 µg was reverse transcribed using MoMuLV Reverse Transcriptase and random primers. An amount of cDNA first strands corresponding to 50 ng of total RNA was used as template for PCR amplification on an ABI7000 in the presence of SYBR Green. All amplifications were performed using a two-step temperature profile with annealing and extension at 60°C. Differences are either presented as the difference in threshold cycle numbers between different samples or were calculated according to the ΔΔCt relative quantitation method using the S14 gene encoding a protein of the small ribosomal subunit as calibrator. (Applied Biosystems User Bulletin #2). The primers used are listed in Table 1.
Table 1.
Sequences of primers used for RT–PCR
| Gene | Forward primer (5′–3′) | Reverse primer sequences (5′–3′) |
|---|---|---|
| BMI1 | AATTAGTTCCAGGGCTTTTCAA | CTTCATCTGCAACCTCTCCTCTAT |
| rat/mouse BMI1 | AATTAGTCCCAGGGCTTTTCAA | TCTTCTCCTCATCTGCAACTTCTC |
| mouse ccna2 | GCCTTCACTCATTGCTGGAG | TGTTGTGCCAATGACTCAGG |
| CCNE1 | AGACGGGGAGCTCAAAACTG | TCGTCCACCAGGGCACCAT |
| mouse ccne1 | CTGAGAGATGAGCACTTTCTGC | TGGAGCTTATAGACTTCGCACA |
| EED | TGCGCCGGCGGGAACAGACAT | TTTCCCTTTCCCCAACTTTTCCTT |
| EZH2 | ACGGGGATAGAGAATGTGGGTTTA | AGGTGGGCGGCTTTCTTTATCATC |
| FHL1 | GGAGGACTTCTACTGCGTGAC | CTGCCCAGCCAGCTTCTTAGA |
| HPC2 | TCGCGGTGGAGAGCATCGAGAAGA | AGCTGCTCCTGCCGTTCCCTGTTC |
| MEL18 | TGGGGATGGGGACAAAGAGAAAAC | TCCGCCGCCAGGGGTAGAT |
| PKNOX1 | CACAGGGCTCTGAAGGCACAA | ATGAATGCGCAAAACCTGGATTG |
| PRDM2 | GGCACCCACTTGGGACATCTG | CCGCCACAGGCTCAGTAGT |
| RCOR | TTGGCATGTTGGTCTGGTCAC | TTTTCTTTGGCAATGGCAATGTAT |
| RING1a | GGGGGTGCCGGAGGAGGTG | CCAGGGTCAGCGAGCCATTCAAC |
| RYBP | GGTTTTGGGATTGTAGCGTCTG | GGGTGGTGGGGTGGCATACT |
| SOX2 | GCCGCCCCCAGCAGACTTC | ACCCCTCCCATTTCCCTCGTT |
| TRIP-Br2 | CCCTCCTGATGCGTTAGTTC | GGCCTGTGGTTATAGAGTTTC |
| ZNF22 | CCCAGCGAGCCAGAGTGG | CTTGGCTTGAGCTCCGAGAA |
Chromatin immunoprecipitation
The details of the chromatin immunoprecipitation assay have been described (31,34). PCR products were directly quantified on an ABI7000 using SYBR Green with all PCRs run in duplicate. Fold enrichment of the BMI1 promoter sequence in chromatin immunoprecipitated with different antibodies was calculated with the ΔΔCt method using the input samples as reference and the sample without antibody as calibrator. The following antibodies were used: α-Gadd-45 (sc-H165; Santa Cruz); α-diacetylated histone H3 (06-599, Upstate Biotechnologies), α-acetylated histone H4 (06-866, Upstate Biotechnologies); the antibodies specific for E2F family members and pocket proteins have been used for chromatin immunoprecipitation experiments before (31). The primers for p107 (36) and the ALU repeat sequence (37) have been described. The primers for BMI1 anneal downstream of the transcription start site in the first exon and had the sequences: 5′-CCACTGGCCTGACTACACCGACAC-3′ and 5′-CGCCCCGATCTCTGCCTCTCATAC-3′. The control primers annealing in the first intron of BMI1 had the sequences: 5′-AGCCCCCACCCCAGACTTTC-3′ and 5′-TCAGATCGGAATCAGTTCTACCAA-3′.
Retroviral infection
Human IMR-32 neuroblastoma cells expressing the ecotropic receptor were infected with retroviruses based on pBABE-hygro as has been described (31). RNA was isolated from infected cells immediately after selection with hygromycin.
Protein analyses
Neuroblastoma tissue was lysed as described before (38). Cultured cells were lysed by three rounds of freeze/thaw in a buffer containing 50 mM Tris (pH 8), 150 mM NaCl, 1% Triton X-100, 1 mM DTT and a cocktail of protease inhibitors. For cell fractionation, cells were lysed in hypotonic buffer. After removal of the supernatant containing cytosolic proteins, nuclei were extracted with 400 mM NaCl. The following antibodies were used for immunblotting: α-Cdk2 (Santa Cruz, sc-163), anti-β-Actin (Sigma, clone AC-15), anti-β-Tubulin (Chemicon, MAB3408), α-Bmi1 (Upstate Biotechnology, clone F6). The chromatin-binding assay was performed according to a published procedure (39).
RESULTS
Novel E2F-1 target genes in neuroblastoma cells
We have previously identified the MYCN oncogene as a tissue-specific target gene of E2F in neuroblastomas (31). To search for additional oncogenic target genes of E2F-1 we used 1A3 cells, a derivative of the human neuroblastoma cell line SK-N-SH-EP constitutively expressing an E2F-1-ER fusion protein that can be reversibly activated by 4-OHT (34). Upon addition of 4-OHT 1A3 cells rapidly induce known E2F target genes, such as CCNE1 (cyclin E) (34). Labeled cDNAs were prepared from RNA of cells cultured with and without 4-OHT for 12 h and hybridized to cDNA-microarrays representing 11 500 human genes. Statistical analyses of the microarray data identified 234 genes that were upregulated and 75 genes that were downregulated in 4-OHT treated cells (see Supplementary Data). Less than 2% of these genes responded to treatment with 4-OHT in parental SK-N-SH-EP cells (Supplementary Figure 1). Of the genes with a functional annotation 79 have been described as E2F-1 target genes in U2OS cells (40). To verify the microarray data we performed RT–PCR on nine genes that had not been previously described as E2F target genes. We deliberately included genes that showed a less than 4-fold change in expression in response to E2F-1. Differential expression was confirmed for eight of these nine genes. A majority of these genes contain putative E2F binding sites in their promoters (Table 2). According to DAVID (GOCharts, classification type: biological process, level 5) (41), 10% of the annotated, E2F-1-responsive genes function as regulators of transcription (Table 2 and data not shown). These genes included BMI1, TRIP-Br2 encoding a transcriptional co-regulator of E2F (42), and RYBP. RYBP encodes a repressor protein that can interact with both E2F and the polycomb protein Ring-1 (43,44) and is associated with a mammalian Bmi1-containing complex (6,45).
Table 2.
E2F-1 regulated genes
| Gene symbol | Accession number | Description | Up/down | Fold change (array) | Fold change (RT–PCR) | E2F site (position) |
|---|---|---|---|---|---|---|
| RYBP | AA454193 | RING-1 and YY1 binding protein | up | 5.0 | 5.3 | — |
| ZNF22 | R37224 | Zinc finger protein 22 (KOX 15) | down | 4.9 | 10.6 | TCTGGCGC (−30) |
| PKNOX1 | H77399 | PBX/knotted 1 homeobox 1 | up | 4.8 | 5.7 | GTTCCCGC (−120) |
| TGTGCCGC (−520) | ||||||
| RCOR | AA457026 | REST corepressor | up | 4.5 | 4.6 | — |
| BMI1 | AA478036 | Bmi1 | up | 4.1 | 8.6 | TGTGGCGC (−320) |
| FHL1 | AA455925 | Four and a half LIM domains 1 | up | 4.1 | 3.7 | TCTCCCGC (−180) |
| TRIP-Br2 | AA489659 | Transcriptional co-regulator | up | 3.9 | 2.3 | TATCGCGC (−130) |
| PRDM2 | W73060 | RIZ1, histone methyltransferase | up | 3.8 | 9.2 | — |
The polycomb group gene BMI1 is regulated by E2F-1
To verify regulation of BMI1 by E2F-1, RT–PCR was performed with RNA from 1A3 cells that had been cultured with 4-OHT for various times (Figure 1A). BMI1 was induced more than 10-fold by activated E2F-1-ER. The induction was as rapid as that of CCNE1. The increase in BMI1 mRNA was paralleled by an increase in Bmi1 protein (Figure 1B). An induction of BMI1 by E2F-1 was also seen in Rat1 fibroblasts and NIH3T3 cells (Figure 1B). EED and EZH2, two PcG genes that encode components of the PRC2 complex and were described previously as E2F target genes in osteosarcoma cells (40,46), were induced by E2F-1 also in neuroblastoma cells (Figure 1C). In contrast, expression of HPC2 and RING1a, two PcG proteins that like Bmi1 are components of PRC1, was not affected by E2F-1. Likewise, expression of the Bmi1 homologue Mel18, which synergizes with Bmi1 to repress HOX gene clusters during development (47), but in contrast to Bmi1 represses self-renewal of hematopoietic stem cells (48), was not changed by E2F-1. Thus, beside components of PRC2, E2F-1 specifically increases expression of Bmi1 but not other proteins of the PRC1 complex.
Figure 1.

E2F-1 activates the BMI1 gene. (A) Rapid induction of BMI1 mRNA in response to activated E2F-1. 1A3, a clone of the human neuroblastoma cell line SK-N-SH-EP expressing an E2F-1-ER fusion protein, was cultured with 4-OHT for various times. RNA was isolated, reverse transcribed and used for quantitative PCR. The CCNE1 gene was used as a positive control. (B) E2F-1 increases Bmi1 protein levels. 1A3 cells and Rat1 cells stably expressing E2F-1-ER and NIH3T3 cells infected with a retrovirus carrying E2F-1-ER were treated with 4-OHT or ethanol for 15 h. Bmi1 was detected in cell lysates by immunoblotting. Antibodies specific for Cdk2 or β-Tubulin were used to control for equal loading. (C) Not all PcG genes are regulated by E2F-1. 1A3 cells were treated with 4-OHT or the solvent control ethanol for 12 h and then analyzed by RT–PCR.
BMI1 is a direct target gene of E2F-1
To analyze whether the induction of BMI1 by E2F-1 was direct, cells expressing E2F-1-ER were treated with 4-OHT in the presence of the protein synthesis inhibitor cycloheximide. Cycloheximide did not interfere with the activation of BMI1 indicating that protein biosynthesis is not required for the induction of BMI1 by E2F-1 (Figure 2A). Indeed, the promoter of the human BMI1 gene contains a putative E2F binding site whose sequence and position is conserved in the mouse gene (Figure 2B). A luciferase reporter gene under control of 600 bp of the human BMI1 gene including the putative E2F binding site was activated 7-fold by co-expressed E2F-1 in neuroblastoma cells (Figure 2C). The reporter gene was also activated by E2F-2 and E2F-3, but not by E2F-4 and E2F-5, which where expressed at similar levels (Figure 2C and data not shown). In contrast, a reporter construct with a mutated E2F binding site did not respond to E2F-1 (Figure 2D). Moreover, the mutant reporter construct showed less than 30% of the activity of the wild-type construct in the absence of ectopic E2F, suggesting that the E2F binding site is required for full promoter activity.
Figure 2.

BMI1 is a direct target gene of E2F-1. (A) Protein synthesis is not required for induction of BMI1 by E2F-1. 1A3 cells were treated for 16 h with cycloheximide (CHX) and for 10 h with 4-OHT and then analyzed by RT–PCR. (B) The human BMI1 promoter contains a putative E2F binding site. Shown are the BMI1 promoter-dependent reporter constructs used and the location and sequence of the putative E2F binding site. The arrow at position +1 marks the 5′ end of the published cDNA sequence. The transcription start site has not yet been experimentally defined. Thus, the E2F binding site may be positioned closer to the transcription start site than indicated. (C) E2F-1, E2F-2 and E2F-3 activate BMI1 through a binding site in the proximal promoter. SK-N-SY5Y human neuroblastoma cells were transiently co-transfected with a BMI1 promoter-controlled reporter construct and either empty vector or expression vectors for different E2F proteins and the dimerization partner DP1. Error bars represent the standard deviation obtained with triplicate samples. (D) E2F-1 activates BMI1 through a binding site in the proximal promoter. SK-N-SY5Y human neuroblastoma cells were transiently co-transfected with wild-type or mutated reporter constructs and either empty vector or expression vectors for E2F-1 and DP1. Error bars represent the standard deviation obtained with triplicate samples.
E2F-1 binds to the BMI1 promoter in vivo
Chromatin immunoprecipitation with an E2F-1 specific antibody demonstrated 4-OHT-dependent binding of the E2F-1-ER fusion protein to the BMI1 promoter in 1A3 cells (Figure 3A). In addition, endogenous E2F-1 binds to the BMI1 promoter in SK-N-SY5Y neuroblastoma cells that strongly express BMI1 (Figure 3B). Binding of E2F-1 was also detected at the promoter of the p107 gene, a well-known target gene of E2F-1, but not at the first intron of BMI1 4 kb downstream of the promoter and at an ALU repeat sequence used as a negative control (Figure 3B). In line with the reporter assays we also observed binding of endogenous E2F-2, E2F-3 and to a much lesser extent E2F-4 to the BMI1 promoter (Figure 3B). E2F-1 recruits several histone acetyltransferases leading to the rapid acetylation of histones H3 and H4 at target promoters (49). Consistent with transcriptional activation of the BMI1 gene by E2F-1-ER, acetylation of histone H4 was strongly increased at the BMI1 promoter after activation of E2F-1 (Figure 3C). There was no change in the acetylation of histone H3, which was already acetylated prior to activation of E2F-1-ER by 4-OHT. In summary, we concluded that BMI1 is regulated by E2F-1 via direct binding of E2F-1 to the BMI1 promoter.
Figure 3.

E2F-1 binds to the BMI1 promoter in vivo. (A) E2F-1-ER binds to the BMI1 promoter upon activation by 4-OHT. Crosslinked chromatin was isolated from untreated and 4-OHT treated 1A3 cells and precipitated with an E2F-1 specific antibody or a control antibody. The precipitated chromatin was used as template for PCR. (B) Endogenous E2F proteins bind to the BMI1 promoter in vivo. Crosslinked chromatin was isolated from SK-N-SY5Y human neuroblastoma cells and precipitated either with antibodies specific for different E2F proteins, an unrelated control antibody, or proteinA/G-sepharose without antibody. As a positive control we used primers that amplify the proximal promoter of the E2F target gene p107. A primer pair that amplifies a sequence at the 3′ end of the first intron of BMI1 4 kb downstream of the E2F binding site and a specific ALU repeat sequence located within heterochromatin were used as negative controls. The bars represent enrichment of the BMI1 promoter sequence relative to the control sample precipitated without antibody. (C) E2F-1-ER induces acetylation of histone H4 but not histone H3 at the BMI1 promoter. Chromatin from untreated and 4-OHT treated 1A3 cells was precipitated with antibodies specific for acetylated histones H3 and H4 and analyzed by PCR.
E2F-1 induced Bmi1 is associated with chromatin
Bmi1 acts as a subunit of nuclear multiprotein complexes that associate with chromatin. Consistent with this, in untreated 1A3 cells almost all Bmi1 was detected in the nuclear fraction and only very little in the cytosolic fraction (Figure 4A). After activation of E2F-1-ER, Bmi1 was still almost exclusively localized in the nucleus. To show association of Bmi1 with chromatin we performed a chromatin-binding assay (39). After mild cell lysis, nuclei were collected and were either left untreated or were incubated with micrococcal nuclease to solubilize specifically chromatin-bound proteins but not nuclear matrix-bound proteins. The samples were then centrifuged to separate soluble and insoluble proteins. Without nuclease treatment only a small fraction of Bmi1 was detected in the soluble nuclear fraction of both untreated and 4-OHT treated cells (Figure 4B). Treatment of the nuclei with micrococcal nuclease solubilized a large amount of Bmi1 protein in both treated and untreated cells. Together, these data show that the increased amount of Bmi1 protein produced in response to E2F-1 associates with chromatin.
Figure 4.
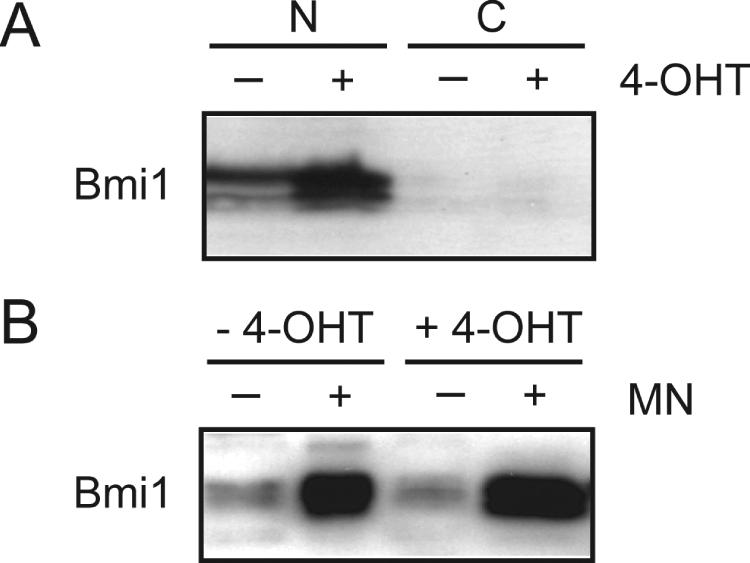
E2F-1 induced Bmi1 binds to chromatin. (A) E2F-1 induced Bmi1 localizes to the nucleus. 1A3 cells were treated for 12 h with 4-OHT or the solvent control ethanol. Cells were then separated into cytosolic (C) and nuclear (N) fractions and analyzed by immunoblotting. (B) E2F-1 induced Bmi1 is associated with chromatin. Nuclei of untreated and 4-OHT treated cells were incubated with micrococcal nuclease (MN) to solubilize specifically chromatin-bound proteins. Bmi1 protein in the different fractions was detected by immunoblotting.
Expression of BMI1 is not regulated during cell cycle or differentiation
E2F-1 can induce several distinct genetic programs including the progression of cells into the S phase of the cell cycle. Consequently, many E2F target genes are expressed in a cell cycle-regulated manner. To see whether BMI1 expression changes during the cell cycle serum-starved 1A3 cells were stimulated with 10% FCS to synchronously re-enter the cell cycle. At various times after serum stimulation mRNA was isolated to measure by RT–PCR the expression of different E2F-1 target genes. Compared to serum-starved cells the expression of CCNE1 was increased more than 4-fold after 7 h of serum stimulation and remained elevated thereafter (Figure 5A). In contrast, the amount of BMI1 mRNA did not change during the experiment. The levels of BMI1 RNA were also measured in primary mouse embryo fibroblasts (MEFs) that had been arrested by serum starvation and then stimulated with mitogens (Figure 5B). Expression of Ccne1 and CcnaA2 (cyclin A2) increased 12 and 16 h, respectively, after serum addition. Again, the levels of BMI1 mRNA remained unchanged. A recent report applying ChIP on chip technology provided evidence that in T98G and U2OS cells arrested by removal of growth factors, contact inhibition or overexpression of the Cyclin-dependent kinase inhibitor p16Ink4a, E2F-4 and the pocket protein p130 are associated with the BMI1 promoter, suggesting that BMI1 expression is repressed in these cells under conditions of growth arrest (50). Using the same approach binding of E2F-4 and pocket proteins to the BMI1 promoter was also observed in cycling cells in early G1 phase (51). Yet, similar to the situation in neuroblastoma cells and primary MEFs BMI1 expression was not reduced in growth-arrested versus proliferating T98G cells (data not shown). Consistent with a lack of cell cycle regulation, the overexpression of p16Ink4a, which blocks activation of cell cycle-regulated E2F target genes by inhibiting Cyclin-dependent kinases, resulted in down-regulation of CCNE1 but not BMI1 (Figure 5C).
Figure 5.

Expression of BMI1 is not cell cycle-regulated. (A) 1A3 cells were serum-starved for 42 h and then stimulated to re-enter the cell cycle by the addition of 10% FCS. At various time points cells were harvested for RT–PCR and analysis of the cell cycle distribution by propidiumiodide staining and flow cytometry. The bars indicate the fold change in mRNA levels relative to starved cells for the indicated E2F-1 target genes. (B) Primary mouse embryo fibroblasts were treated and analyzed as described in Figure 5A except that primers specific for the mouse genes were used. (C) Overexpression of p16Ink4a does not affect BMI1 expression. IMR-32 human neuroblastoma cells expressing the ecotropic receptor were infected with a retrovirus carrying the INK4a gene or an empty control virus. RNA was prepared from pools of infected cells that had been selected with hygromycin and used for RT–PCR.
E2F proteins have recently been implicated in the control of gene expression during development and differentiation (52–54). The BMI1 gene is shut-off during differentiation in several cell lineages (21,22). We therefore measured the expression of BMI1 in LA-N-5 neuroblastoma cells before and after neuronal differentiation. LA-N-5 cells treated with pharmacological concentrations of all-trans retinoic acid ceased proliferation and within 10 days aggregated into pseudoganglia that were interconnected by a network of long axon-like processes (data not shown). Despite these extensive morphological changes, the expression of BMI1 did not change (data not shown). We concluded that BMI1 is not regulated in a differentiation-dependent manner in neuroblastoma cells.
Bmi1 is expressed in primary neuroblastomas
The events that initiate neuroblastoma are still unknown. Since E2F-regulated genes are disproportionately overexpressed in many types of cancer including neuroblastoma, and since the expression of several E2F target genes correlates with poor outcome in neuroblastoma (32,55) we measured Bmi1 protein levels in 68 primary neuroblastomas of different tumor stages and MYCN status. Previous histochemical analyses showed that these tumors contain less than 5% nontumor cells (35). Strong Bmi1 expression similar to the expression seen in the neuroblastoma cell line SK-N-SH-EP was detected in more than 90% of these tumors regardless of tumor stage and MYCN status (Figure 6A and B and data not shown). We have previously shown that E2F-activity is required but not sufficient for full expression of MYCN in neuroblastomas, providing an explanation for why not all tumors that express BMI1 also express MYCN, although both genes are activated by deregulated E2F (34).
Figure 6.

Bmi1 is strongly expressed in primary neuroblastomas. (A) Bmi1 levels in primary neuroblastomas. Shown is a representative immunoblot detection of Bmi1 in lysates of primary neuroblastomas of different tumor stages including two of the tumors that were scored as negative for Bmi1 expression. Bmi1 expression in the neuroblastoma cell line SK-N-SH-EP is shown for comparison. β-Actin was used as a loading control. (B) Summary of the immunoblot results for 68 primary neuroblastomas showing the number and percentage of Bmi1-positive tumors among tumors of different stages and MYCN status.
DISCUSSION
Bmi1 has important functions in embryonic development, stem cell biology, and cancer. Thus, it is surprising, that only little is known about the transcriptional regulation of the BMI1 gene. We show here that the transcription factor E2F-1 directly regulates BMI1. This is based on the following observations: (i) E2F-1 activates BMI1 in multiple cell types from different species. (ii) E2F-1 activates BMI1 in the absence of protein synthesis and with the same kinetics as known E2F target genes. (iii) Activation of BMI1 by E2F requires an evolutionary conserved E2F binding site located in the proximal promoter. (iv) Endogenous E2F-1 is associated with the BMI1 promoter in cancer cells.
However, BMI1 is not expressed in a cell cycle-regulated manner in various primary and transformed cells and is not affected by overexpression of p16Ink4a. Thus, BMI1 is not a classical E2F target gene. Indeed, in recent years numerous genes have emerged that are regulated by E2F in a cell cycle-independent manner (52,56). Several observations indicate a role of E2F in development, and induction of BMI1 may be related to one of these developmental functions (52–54). For example, in Drosophila, E2F acts as a suppressor of position effect variegation, indicating an epigenetic influence of E2F on developmental processes (57).
Alternatively, induction of BMI1 by activating E2Fs may be restricted to cells with deregulated E2F as has been shown for other E2F target genes, such as ARF (Aslanian 2004). Indeed, overexpression of BMI1 has been found in various types of cancer (11–15). Bmi1 can co-operate with the Myc oncoprotein in the generation of lymphomas in double transgenic mice (58). The mechanism of this co-operation is the ability of Bmi1 to repress Myc-induced apoptosis (58). The N-Myc protein is known to sensitize neuroblastoma cells to multiple apoptotic stimuli (59,60). Thus, in a manner analogous to its role in lymphomas, Bmi1 may pave the way for MYCN amplification in neuroblastoma cells by blocking N-Myc-induced apoptosis. As both MYCN and BMI1 are direct targets of E2F-1 in neuroblastoma cells, uncontrolled activity of E2F may have fatal consequences by inducing the expression of two co-operating oncogenes. Once activated, two positive feedback loops will keep E2F, Bmi1 and N-Myc active. Firstly, E2F not only induces MYCN, but also Myc in turn can stimulate E2F-activity (61,62). Secondly, Bmi1 represses the INK4A gene thereby promoting phosphorylation of the retinoblastoma protein and activation of E2F (58). Based on the known functions of E2F, Bmi1 and N-Myc this network of oncogenic transcription factors could be instrumental in initiating and maintaining neuroblastomas.
Our cDNA microarray analysis of neuroblastoma cells expressing a conditional form of E2F-1 identified a large number of hitherto unknown E2F-1 target genes beside BMI1. This is surprising given that several comprehensive searches for E2F target genes have already been published, resulting in the identification of hundreds of E2F target genes (40,63–66). These previous studies have been performed in fibroblasts and osteosarcoma cells that are very different from neuroblastoma cells in terms of ontogenetic history and function. We predict that some of the genes in our list are tissue-specific target genes of E2F-1 that adjust the E2F-regulated genetic program to the needs of particular cell types as has been shown previously for MYCN and PPARγ (31,53). In fact, a number of studies in mice and flies have revealed tissue-specific functions for E2F proteins (52,67).
Strikingly, many of the E2F-1 regulated genes with a functional annotation identified in our screen function primarily in transcriptional regulation. This suggests that the primary response of cells to activated E2F-1 is followed by a complex secondary response based on gene expression changes triggered by dozens of E2F-regulated transcription factors. Several of these transcriptional regulators have already been linked to E2F function. For example, Rybp and Trip-Br2 can both function as co-regulators of E2F (42,44). Thus, E2F-1 induces some of the very co-factors it uses for the control of target genes, creating so-called feedforward-loops (68).
In contrast to PRC2, of which several subunits are coordinately induced by E2F-1 (40,46), Bmi1 appears to be the only subunit of the PRC1 complex to be regulated by E2F-1. Neither Mel18 nor Hpc2, which is an essential component of a polycomb complex that interacts with the retinoblastoma protein to induce an HDAC-independent cell cycle arrest (69), nor Ring1a were induced by E2F-1. It has been proposed that the relative amounts of Bmi1 and Hpc2 in the complex determine the biochemical and biological functions of the complex (69). According to this model, the Bmi1-enriched complex would favor proliferation by repressing the INK4A-locus, while the Hpc2-dominated complex would arrest cells by repressing a subset of E2F-regulated genes. If true, the selective induction of BMI1 by E2F-1 would change the composition of the polycomb complex to favor proliferation over cell cycle arrest.
SUPPLEMENTARY DATA
Supplementary Data are available at NAR Online.
Supplementary Material
Acknowledgments
The authors thank Angelika Filmer and Michael Krause for help with cDNA microarray analyses, Sven Gallinat for help with flow cytometry, Adrian Bracken, Kristian Helin, Stefan Gaubatz and Maarten van Lohuizen for discussion, and Martin Eilers for his support. This work was supported by grants from the Deutsche Forschungsgemeinschaft (Forschergruppe 531) and the Stiftung P.E. Kempkes. Funding to pay the Open Access publication charges for this article was provided by the Deutsche Forschungsgemeinschaft.
Conflict of interest statement. None declared.
REFERENCES
- 1.Orlando V. Polycomb, epigenomes, and control of cell identity. Cell. 2003;112:599–606. doi: 10.1016/s0092-8674(03)00157-0. [DOI] [PubMed] [Google Scholar]
- 2.Lund A.H., van Lohuizen M. Polycomb complexes and silencing mechanisms. Curr. Opin. Cell Biol. 2004;16:239–246. doi: 10.1016/j.ceb.2004.03.010. [DOI] [PubMed] [Google Scholar]
- 3.Otte A.P., Kwaks T.H. Gene repression by Polycomb group protein complexes: a distinct complex for every occasion? Curr. Opin. Genet. Dev. 2003;13:448–454. doi: 10.1016/s0959-437x(03)00108-4. [DOI] [PubMed] [Google Scholar]
- 4.Shao Z., Raible F., Mollaaghababa R., Guyon J.R., Wu C.T., Bender W., Kingston R.E. Stabilization of chromatin structure by PRC1, a Polycomb complex. Cell. 1999;98:37–46. doi: 10.1016/S0092-8674(00)80604-2. [DOI] [PubMed] [Google Scholar]
- 5.Francis N.J., Saurin A.J., Shao Z., Kingston R.E. Reconstitution of a functional core polycomb repressive complex. Mol. Cell. 2001;8:545–556. doi: 10.1016/s1097-2765(01)00316-1. [DOI] [PubMed] [Google Scholar]
- 6.Levine S.S., Weiss A., Erdjument-Bromage H., Shao Z., Tempst P., Kingston R.E. The core of the polycomb repressive complex is compositionally and functionally conserved in flies and humans. Mol. Cell. Biol. 2002;22:6070–6078. doi: 10.1128/MCB.22.17.6070-6078.2002. [DOI] [PMC free article] [PubMed] [Google Scholar]
- 7.Lessard J., Schumacher A., Thorsteinsdottir U., van Lohuizen M., Magnuson T., Sauvageau G. Functional antagonism of the Polycomb-Group genes eed and Bmi1 in hemopoietic cell proliferation. Genes Dev. 1999;13:2691–2703. doi: 10.1101/gad.13.20.2691. [DOI] [PMC free article] [PubMed] [Google Scholar]
- 8.Haupt Y., Alexander W.S., Barri G., Klinken S.P., Adams J.M. Novel zinc finger gene implicated as myc collaborator by retrovirally accelerated lymphomagenesis in E mu-myc transgenic mice. Cell. 1991;65:753–763. doi: 10.1016/0092-8674(91)90383-a. [DOI] [PubMed] [Google Scholar]
- 9.van Lohuizen M., Verbeek S., Scheijen B., Wientjens E., van der Gulden H., Berns A. Identification of cooperating oncogenes in E mu-myc transgenic mice by provirus tagging. Cell. 1991;65:737–752. doi: 10.1016/0092-8674(91)90382-9. [DOI] [PubMed] [Google Scholar]
- 10.Jacobs J.J., Kieboom K., Marino S., DePinho R.A., van Lohuizen M. The oncogene and Polycomb-group gene bmi-1 regulates cell proliferation and senescence through the ink4a locus. Nature. 1999;397:164–168. doi: 10.1038/16476. [DOI] [PubMed] [Google Scholar]
- 11.Molofsky A.V., Pardal R., Iwashita T., Park I.K., Clarke M.F., Morrison S.J. Bmi-1 dependence distinguishes neural stem cell self-renewal from progenitor proliferation. Nature. 2003;425:962–967. doi: 10.1038/nature02060. [DOI] [PMC free article] [PubMed] [Google Scholar]
- 12.Kim J.H., Yoon S.Y., Kim C.N., Joo J.H., Moon S.K., Choe I.S., Choe Y.K., Kim J.W. The Bmi-1 oncoprotein is overexpressed in human colorectal cancer and correlates with the reduced p16INK4a/p14ARF proteins. Cancer Lett. 2004;203:217–224. doi: 10.1016/j.canlet.2003.07.009. [DOI] [PubMed] [Google Scholar]
- 13.Bea S., Tort F., Pinyol M., Puig X., Hernandez L., Hernandez S., Fernandez P.L., van Lohuizen M., Colomer D., Campo E. BMI-1 gene amplification and overexpression in hematological malignancies occur mainly in mantle cell lymphomas. Cancer Res. 2001;61:2409–2412. [PubMed] [Google Scholar]
- 14.Vonlanthen S., Heighway J., Altermatt H.J., Gugger M., Kappeler A., Borner M.M., van Lohuizen M., Betticher D.C. The bmi-1 oncoprotein is differentially expressed in non-small cell lung cancer and correlates with INK4A-ARF locus expression. Br. J. Cancer. 2001;84:1372–1376. doi: 10.1054/bjoc.2001.1791. [DOI] [PMC free article] [PubMed] [Google Scholar]
- 15.De Vos J., Thykjaer T., Tarte K., Ensslen M., Raynaud P., Requirand G., Pellet F., Pantesco V., Reme T., Jourdan M., et al. Comparison of gene expression profiling between malignant and normal plasma cells with oligonucleotide arrays. Oncogene. 2002;21:6848–6857. doi: 10.1038/sj.onc.1205868. [DOI] [PubMed] [Google Scholar]
- 16.Smith K.S., Chanda S.K., Lingbeek M., Ross D.T., Botstein D., van Lohuizen M., Cleary M.L. Bmi-1 regulation of INK4A-ARF is a downstream requirement for transformation of hematopoietic progenitors by E2a-Pbx1. Mol. Cell. 2003;12:393–400. doi: 10.1016/s1097-2765(03)00277-6. [DOI] [PubMed] [Google Scholar]
- 17.Glinsky G.V., Berezovska O., Glinskii A.B. Microarray analysis identifies a death-from-cancer signature predicting therapy failure in patients with multiple types of cancer. J. Clin. Invest. 2005;115:1503–1521. doi: 10.1172/JCI23412. [DOI] [PMC free article] [PubMed] [Google Scholar]
- 18.Lessard J., Sauvageau G. Bmi-1 determines the proliferative capacity of normal and leukaemic stem cells. Nature. 2003;423:255–260. doi: 10.1038/nature01572. [DOI] [PubMed] [Google Scholar]
- 19.Park I.K., Qian D., Kiel M., Becker M.W., Pihalja M., Weissman I.L., Morrison S.J., Clarke M.F. Bmi-1 is required for maintenance of adult self-renewing haematopoietic stem cells. Nature. 2003;423:302–305. doi: 10.1038/nature01587. [DOI] [PubMed] [Google Scholar]
- 20.Valk-Lingbeek M.E., Bruggeman S.W., van Lohuizen M. Stem cells and cancer; the polycomb connection. Cell. 2004;118:409–418. doi: 10.1016/j.cell.2004.08.005. [DOI] [PubMed] [Google Scholar]
- 21.Lessard J., Baban S., Sauvageau G. Stage-specific expression of polycomb group genes in human bone marrow cells. Blood. 1998;91:1216–1224. [PubMed] [Google Scholar]
- 22.Leung C., Lingbeek M., Shakhova O., Liu J., Tanger E., Saremaslani P., Van Lohuizen M., Marino S. Bmi1 is essential for cerebellar development and is overexpressed in human medulloblastomas. Nature. 2004;428:337–341. doi: 10.1038/nature02385. [DOI] [PubMed] [Google Scholar]
- 23.Brodeur G.M. Neuroblastoma: biological insights into a clinical enigma. Nature Rev. Cancer. 2003;3:203–216. doi: 10.1038/nrc1014. [DOI] [PubMed] [Google Scholar]
- 24.Ciccarone V., Spengler B.A., Meyers M.B., Biedler J.L., Ross R.A. Phenotypic diversification in human neuroblastoma cells: expression of distinct neural crest lineages. Cancer Res. 1989;49:219–225. [PubMed] [Google Scholar]
- 25.Dimitroulakos J., Squire J., Pawlin G., Yeger H. NUB-7: a stable I-type human neuroblastoma cell line inducible along N- and S-type cell lineages. Cell Growth Differ. 1994;5:373–384. [PubMed] [Google Scholar]
- 26.Ross R.A., Spengler B.A., Domenech C., Porubcin M., Rettig W.J., Biedler J.L. Human neuroblastoma I-type cells are malignant neural crest stem cells. Cell Growth Differ. 1995;6:449–456. [PubMed] [Google Scholar]
- 27.Schwab M. MYCN in neuronal tumours. Cancer Lett. 2004;204:179–187. doi: 10.1016/S0304-3835(03)00454-3. [DOI] [PubMed] [Google Scholar]
- 28.Trimarchi J.M., Lees J.A. Sibling rivalry in the E2F family. Nature Rev. Mol. Cell. Biol. 2002;3:11–20. doi: 10.1038/nrm714. [DOI] [PubMed] [Google Scholar]
- 29.DeGregori J. The genetics of the E2F family of transcription factors: shared functions and unique roles. Biochim. Biophys. Acta. 2002;1602:131–150. doi: 10.1016/s0304-419x(02)00051-3. [DOI] [PubMed] [Google Scholar]
- 30.Bracken A.P., Ciro M., Cocito A., Helin K. E2F target genes: unraveling the biology. Trends Biochem. Sci. 2004;29:409–417. doi: 10.1016/j.tibs.2004.06.006. [DOI] [PubMed] [Google Scholar]
- 31.Strieder V., Lutz W. E2F proteins regulate MYCN expression in neuroblastomas. J. Biol. Chem. 2003;278:2983–2989. doi: 10.1074/jbc.M207596200. [DOI] [PubMed] [Google Scholar]
- 32.Hernando E., Nahle Z., Juan G., Diaz-Rodriguez E., Alaminos M., Hemann M., Michel L., Mittal V., Gerald W., Benezra R., et al. Rb inactivation promotes genomic instability by uncoupling cell cycle progression from mitotic control. Nature. 2004;430:797–802. doi: 10.1038/nature02820. [DOI] [PubMed] [Google Scholar]
- 33.Lutz W., Stohr M., Schurmann J., Wenzel A., Lohr A., Schwab M. Conditional expression of N-myc in human neuroblastoma cells increases expression of alpha-prothymosin and ornithine decarboxylase and accelerates progression into S-phase early after mitogenic stimulation of quiescent cells. Oncogene. 1996;13:803–812. [PubMed] [Google Scholar]
- 34.Kramps C., Strieder V., Sapetschnig A., Suske G., Lutz W. E2F and Sp1/Sp3 Synergize but are not sufficient to activate the MYCN gene in neuroblastomas. J. Biol. Chem. 2004;279:5110–5117. doi: 10.1074/jbc.M304758200. [DOI] [PubMed] [Google Scholar]
- 35.Berwanger B., Hartmann O., Bergmann E., Bernard S., Nielsen D., Krause M., Kartal A., Flynn D., Wiedemeyer R., Schwab M., et al. Loss of a FYN-regulated differentiation and growth arrest pathway in advanced stage neuroblastoma. Cancer Cell. 2002;2:377–386. doi: 10.1016/s1535-6108(02)00179-4. [DOI] [PubMed] [Google Scholar]
- 36.Takahashi Y., Rayman J.B., Dynlacht B.D. Analysis of promoter binding by the E2F and pRB families in vivo: distinct E2F proteins mediate activation and repression. Genes Dev. 2000;14:804–816. [PMC free article] [PubMed] [Google Scholar]
- 37.Kondo Y., Issa J.P. Enrichment for histone H3 lysine 9 methylation at Alu repeats in human cells. J. Biol. Chem. 2003;278:27658–27662. doi: 10.1074/jbc.M304072200. [DOI] [PubMed] [Google Scholar]
- 38.Bergmann E., Wanzel M., Weber A., Shin I., Christiansen H., Eilers M. Expression of P27(KIP1) is prognostic and independent of MYCN amplification in human neuroblastoma. Int. J. Cancer. 2001;95:176–183. doi: 10.1002/1097-0215(20010520)95:3<176::aid-ijc1030>3.0.co;2-z. [DOI] [PubMed] [Google Scholar]
- 39.Mendez J., Stillman B. Chromatin association of human origin recognition complex, cdc6, and minichromosome maintenance proteins during the cell cycle: assembly of prereplication complexes in late mitosis. Mol. Cell. Biol. 2000;20:8602–8612. doi: 10.1128/mcb.20.22.8602-8612.2000. [DOI] [PMC free article] [PubMed] [Google Scholar]
- 40.Muller H., Bracken A.P., Vernell R., Moroni M.C., Christians F., Grassilli E., Prosperini E., Vigo E., Oliner J.D., Helin K. E2Fs regulate the expression of genes involved in differentiation, development, proliferation, and apoptosis. Genes Dev. 2001;15:267–285. doi: 10.1101/gad.864201. [DOI] [PMC free article] [PubMed] [Google Scholar]
- 41.Dennis G., Jr, Sherman B.T., Hosack D.A., Yang J., Gao W., Lane H.C., Lempicki R.A. DAVID: database for annotation, visualization, and integrated discovery. Genome Biol. 2003;4:P3. [PubMed] [Google Scholar]
- 42.Hsu S.I., Yang C.M., Sim K.G., Hentschel D.M., O'Leary E., Bonventre J.V. TRIP-Br: a novel family of PHD zinc finger- and bromodomain-interacting proteins that regulate the transcriptional activity of E2F-1/DP-1. EMBO J. 2001;20:2273–2285. doi: 10.1093/emboj/20.9.2273. [DOI] [PMC free article] [PubMed] [Google Scholar]
- 43.Garcia E., Marcos-Gutierrez C., del Mar Lorente M., Moreno J.C., Vidal M. RYBP, a new repressor protein that interacts with components of the mammalian Polycomb complex, and with the transcription factor YY1. EMBO J. 1999;18:3404–3418. doi: 10.1093/emboj/18.12.3404. [DOI] [PMC free article] [PubMed] [Google Scholar]
- 44.Schlisio S., Halperin T., Vidal M., Nevins J.R. Interaction of YY1 with E2Fs, mediated by RYBP, provides a mechanism for specificity of E2F function. EMBO J. 2002;21:5775–5786. doi: 10.1093/emboj/cdf577. [DOI] [PMC free article] [PubMed] [Google Scholar]
- 45.Trimarchi J.M., Fairchild B., Wen J., Lees J.A. The E2F6 transcription factor is a component of the mammalian Bmi1-containing polycomb complex. Proc. Natl Acad. Sci. USA. 2001;98:1519–1524. doi: 10.1073/pnas.041597698. [DOI] [PMC free article] [PubMed] [Google Scholar]
- 46.Bracken A.P., Pasini D., Capra M., Prosperini E., Colli E., Helin K. EZH2 is downstream of the pRB-E2F pathway, essential for proliferation and amplified in cancer. EMBO J. 2003;22:5323–5335. doi: 10.1093/emboj/cdg542. [DOI] [PMC free article] [PubMed] [Google Scholar]
- 47.Akasaka T., van Lohuizen M., van der Lugt N., Mizutani-Koseki Y., Kanno M., Taniguchi M., Vidal M., Alkema M., Berns A., Koseki H. Mice doubly deficient for the Polycomb Group genes Mel18 and Bmi1 reveal synergy and requirement for maintenance but not initiation of Hox gene expression. Development. 2001;128:1587–1597. doi: 10.1242/dev.128.9.1587. [DOI] [PubMed] [Google Scholar]
- 48.Kajiume T., Ninomiya Y., Ishihara H., Kanno R., Kanno M. Polycomb group gene mel-18 modulates the self-renewal activity and cell cycle status of hematopoietic stem cells. Exp. Hematol. 2004;32:571–578. doi: 10.1016/j.exphem.2004.03.001. [DOI] [PubMed] [Google Scholar]
- 49.Taubert S., Gorrini C., Frank S.R., Parisi T., Fuchs M., Chan H.M., Livingston D.M., Amati B. E2F-dependent histone acetylation and recruitment of the Tip60 acetyltransferase complex to chromatin in late G1. Mol. Cell. Biol. 2004;24:4546–4556. doi: 10.1128/MCB.24.10.4546-4556.2004. [DOI] [PMC free article] [PubMed] [Google Scholar]
- 50.Cam H., Balciunaite E., Blais A., Spektor A., Scarpulla R.C., Young R., Kluger Y., Dynlacht B.D. A common set of gene regulatory networks links metabolism and growth inhibition. Mol. Cell. 2004;16:399–411. doi: 10.1016/j.molcel.2004.09.037. [DOI] [PubMed] [Google Scholar]
- 51.Balciunaite E., Spektor A., Lents N.H., Cam H., Te Riele H., Scime A., Rudnicki M.A., Young R., Dynlacht B.D. Pocket protein complexes are recruited to distinct targets in quiescent and proliferating cells. Mol. Cell. Biol. 2005;25:8166–8178. doi: 10.1128/MCB.25.18.8166-8178.2005. [DOI] [PMC free article] [PubMed] [Google Scholar]
- 52.Dimova D.K., Stevaux O., Frolov M.V., Dyson N.J. Cell cycle-dependent and cell cycle-independent control of transcription by the Drosophila E2F/RB pathway. Genes Dev. 2003;17:2308–2320. doi: 10.1101/gad.1116703. [DOI] [PMC free article] [PubMed] [Google Scholar]
- 53.Fajas L., Landsberg R.L., Huss-Garcia Y., Sardet C., Lees J.A., Auwerx J. E2Fs regulate adipocyte differentiation. Dev. Cell. 2002;3:39–49. doi: 10.1016/s1534-5807(02)00190-9. [DOI] [PubMed] [Google Scholar]
- 54.Suzuki A., Hemmati-Brivanlou A. Xenopus embryonic E2F is required for the formation of ventral and posterior cell fates during early embryogenesis. Mol. Cell. 2000;5:217–229. doi: 10.1016/s1097-2765(00)80418-9. [DOI] [PubMed] [Google Scholar]
- 55.Rhodes D.R., Kalyana-Sundaram S., Mahavisno V., Barrette T.R., Ghosh D., Chinnaiyan A.M. Mining for regulatory programs in the cancer transcriptome. Nature Genet. 2005;37:579–583. doi: 10.1038/ng1578. [DOI] [PubMed] [Google Scholar]
- 56.Aslanian A., Iaquinta P.J., Verona R., Lees J.A. Repression of the Arf tumor suppressor by E2F3 is required for normal cell cycle kinetics. Genes Dev. 2004;18:1413–1422. doi: 10.1101/gad.1196704. [DOI] [PMC free article] [PubMed] [Google Scholar]
- 57.Seum C., Spierer A., Pauli D., Szidonya J., Reuter G., Spierer P. Position-effect variegation in Drosophila depends on dose of the gene encoding the E2F transcriptional activator and cell cycle regulator. Development. 1996;122:1949–1956. doi: 10.1242/dev.122.6.1949. [DOI] [PubMed] [Google Scholar]
- 58.Jacobs J.J., Scheijen B., Voncken J.W., Kieboom K., Berns A., van Lohuizen M. Bmi-1 collaborates with c-Myc in tumorigenesis by inhibiting c-Myc-induced apoptosis via INK4a/ARF. Genes Dev. 1999;13:2678–2690. doi: 10.1101/gad.13.20.2678. [DOI] [PMC free article] [PubMed] [Google Scholar]
- 59.Lutz W., Fulda S., Jeremias I., Debatin K.M., Schwab M. MycN and IFNgamma cooperate in apoptosis of human neuroblastoma cells. Oncogene. 1998;17:339–346. doi: 10.1038/sj.onc.1200201. [DOI] [PubMed] [Google Scholar]
- 60.Fulda S., Lutz W., Schwab M., Debatin K.M. MycN sensitizes neuroblastoma cells for drug-induced apoptosis. Oncogene. 1999;18:1479–1486. doi: 10.1038/sj.onc.1202435. [DOI] [PubMed] [Google Scholar]
- 61.Leone G., Sears R., Huang E., Rempel R., Nuckolls F., Park C.H., Giangrande P., Wu L., Saavedra H.I., Field S.J., et al. Myc requires distinct E2F activities to induce S phase and apoptosis. Mol. Cell. 2001;8:105–113. doi: 10.1016/s1097-2765(01)00275-1. [DOI] [PubMed] [Google Scholar]
- 62.Beier R., Burgin A., Kiermaier A., Fero M., Karsunky H., Saffrich R., Moroy T., Ansorge W., Roberts J., Eilers M. Induction of cyclin E-cdk2 kinase activity, E2F-dependent transcription and cell growth by Myc are genetically separable events. EMBO J. 2000;19:5813–5823. doi: 10.1093/emboj/19.21.5813. [DOI] [PMC free article] [PubMed] [Google Scholar]
- 63.Ishida S., Huang E., Zuzan H., Spang R., Leone G., West M., Nevins J.R. Role for E2F in control of both DNA replication and mitotic functions as revealed from DNA microarray analysis. Mol. Cell. Biol. 2001;21:4684–4699. doi: 10.1128/MCB.21.14.4684-4699.2001. [DOI] [PMC free article] [PubMed] [Google Scholar]
- 64.Weinmann A.S., Bartley S.M., Zhang T., Zhang M.Q., Farnham P.J. Use of chromatin immunoprecipitation to clone novel E2F target promoters. Mol. Cell. Biol. 2001;21:6820–6832. doi: 10.1128/MCB.21.20.6820-6832.2001. [DOI] [PMC free article] [PubMed] [Google Scholar]
- 65.Ren B., Cam H., Takahashi Y., Volkert T., Terragni J., Young R.A., Dynlacht B.D. E2F integrates cell cycle progression with DNA repair, replication, and G(2)/M checkpoints. Genes Dev. 2002;16:245–256. doi: 10.1101/gad.949802. [DOI] [PMC free article] [PubMed] [Google Scholar]
- 66.Stanelle J., Stiewe T., Theseling C.C., Peter M., Putzer B.M. Gene expression changes in response to E2F1 activation. Nucleic Acids Res. 2002;30:1859–1867. doi: 10.1093/nar/30.8.1859. [DOI] [PMC free article] [PubMed] [Google Scholar]
- 67.Cam H., Dynlacht B.D. Emerging roles for E2F: beyond the G1/S transition and DNA replication. Cancer Cell. 2003;3:311–316. doi: 10.1016/s1535-6108(03)00080-1. [DOI] [PubMed] [Google Scholar]
- 68.Lee T.I., Rinaldi N.J., Robert F., Odom D.T., Bar-Joseph Z., Gerber G.K., Hannett N.M., Harbison C.T., Thompson C.M., Simon I., et al. Transcriptional regulatory networks in Saccharomyces cerevisiae. Science. 2002;298:799–804. doi: 10.1126/science.1075090. [DOI] [PubMed] [Google Scholar]
- 69.Dahiya A., Wong S., Gonzalo S., Gavin M., Dean D.C. Linking the Rb and polycomb pathways. Mol. Cell. 2001;8:557–569. doi: 10.1016/s1097-2765(01)00346-x. [DOI] [PubMed] [Google Scholar]
Associated Data
This section collects any data citations, data availability statements, or supplementary materials included in this article.