Abstract
Mg2+-dependent phosphatidate (PA) phosphatase (3-sn-phosphatidate phosphohydrolase, EC 3.1.3.4) catalyzes the dephosphorylation of PA to yield diacylglycerol and Pi. In this work, we identified the Saccharomyces cerevisiae PAH1 (previously known as SMP2) gene that encodes Mg2+-dependent PA phosphatase using amino acid sequence information derived from a purified preparation of the enzyme (Lin, Y.-P., and Carman, G.M. (1989) J. Biol. Chem. 264, 8641–8645). Overexpression of PAH1 in S. cerevisiae directed elevated levels of Mg2+-dependent PA phosphatase activity, whereas the pah1Δ mutation caused reduced levels of enzyme activity. Heterologous expression of PAH1 in Escherichia coli confirmed that Pah1p is a Mg2+-dependent PA phosphatase enzyme, and showed that its enzymological properties were very similar to those of the enzyme purified from S. cerevisiae. The PAH1-encoded enzyme activity was associated with both the membrane and cytosolic fractions of the cell, and the membrane-bound form of the enzyme was salt-extractable. Lipid analysis showed that mutants lacking PAH1 accumulated PA, and had reduced amounts of diacylglycerol and its derivative triacylglycerol. The PAH1-encoded Mg2+-dependent PA phosphatase shows homology to mammalian lipin, a fat-regulating protein whose molecular function is unknown. Heterologous expression of human LPIN1 in E. coli showed that lipin 1 is also a Mg2+-dependent PA phosphatase enzyme.
PA1 phosphatase (3-sn-phosphatidate phosphohydrolase, EC 3.1.3.4) catalyzes the dephosphorylation of PA yielding DAG and Pi (1). In the yeast Saccharomyces cerevisiae, the DAG generated in this reaction is utilized for the synthesis of phosphatidylcholine and phosphatidylethanolamine via the CDP-choline and CDP-ethanolamine branches of the Kennedy pathway, and for the synthesis of TAG (2–6). In higher eukaryotes, PA phosphatase also plays a role in lipid signaling as part of the phospholipase D-PA phosphatase pathway for the generation of DAG from phosphatidylcholine (7–9). The importance of PA phosphatase in lipid signaling is further emphasized by its role in attenuating the bioactive functions of PA (9–11).
Mg2+-dependent and Mg2+-independent forms of PA phosphatase have been identified in S. cerevisiae (12, 13). Nearly all Mg2+-independent PA phosphatase activity is encoded by the DPP1 (14) and LPP1 (15) genes, with DPP1 being the major contributor of this activity (15). The DPP1- and LPP1-encoded enzymes are integral membrane proteins localized to the vacuole (16, 17) and Golgi (18) compartments of the cell, respectively. These enzymes have broad substrate specificity; in addition to PA, they utilize a variety of lipid phosphate substrates including diacylglycerol pyrophosphate, lysoPA, and isoprenoid phosphates (14, 15, 19–21). The DPP1 and LPP1 genes are not essential under standard laboratory conditions (14, 15). Mutants defective in the DPP1 and LPP1 genes do not exhibit any growth defect or morphological abnormalities that shed light on the physiological roles of their gene products (14, 15). The DPP1-encoded phosphatase enzyme regulates the cellular levels of PA and diacylglycerol pyrophosphate in vacuole membranes of zinc-depleted cells, but the physiological significance of this regulation is unclear (17). It is unknown whether the LPP1 gene product controls phospholipid composition in Golgi membranes. Although the DPP1- and LPP1-encoded Mg2+-independent PA phosphatase activities may regulate specific pools of PA in the vacuole and Golgi, respectively, they are not responsible for the de novo synthesis of phospholipids and TAG that presumably occurs in the ER.
The Mg2+-dependent PA phosphatase is postulated to be responsible for the DAG needed for the synthesis of phospholipids and TAG in S. cerevisiae (6, 12). Cytosolic- and membrane-associated forms of the Mg2+-dependent PA phosphatase have been purified and characterized with respect to their enzymological and regulatory properties (12, 22–29). Unlike the Mg2+-independent forms of PA phosphatase, the Mg2+-dependent forms of the enzyme are specific for PA and require Mg2+ ions for catalytic activity (22, 24, 29). However, genes encoding Mg2+-dependent PA phosphatase enzymes have not been identified from S. cerevisiae or from any organism (12). Because mutants defective in these enzymes are not available, it has not been established whether the Mg2+-dependent PA phosphatases previously isolated from S. cerevisiae (22, 24, 29) are in fact responsible for de novo lipid synthesis.
In this paper we report for the first time the identification of the S. cerevisiae PAH1 (previously known as SMP2) gene encoding a Mg2+-dependent PA phosphatase enzyme. Lipid analysis of a pah1Δ mutant showed that the Mg2+-dependent PA phosphatase is indeed a relevant enzyme responsible for de novo lipid synthesis in S. cerevisiae. Moreover, we showed that lipin 1, a mammalian fat-regulating protein that is homologous to Pah1p (30), exhibits Mg2+-dependent PA phosphatase activity.
EXPERIMENTAL PROCEDURES
Materials
All chemicals were reagent grade. Growth medium supplies were purchased from Difco laboratories. Restriction endonucleases, modifying enzymes, and recombinant Vent DNA polymerase were purchased from New England Biolabs. DNA purification kits, and Ni2+-NTA agarose resin were purchased from Qiagen. Oligonucleotides were prepared by Genosys Biotechnologies, Inc. The Yeast Maker yeast transformation kit was purchased from Clontech. Radiochemicals were purchased from PerkinElmer Life Sciences. Nucleotides, phenylmethylsulfonyl fluoride, benzamidine, aprotinin, leupeptin, pepstatin, isopropyl-β-D-thiogalactoside, and Triton X-100 were purchased from Sigma. Lipids were obtained from Avanti Polar Lipids. Silica gel thin layer chromatography plates were from EM Science. Protein assay reagents, electrophoretic reagents, and protein standards were purchased from Bio-Rad. Mouse monoclonal anti-HA antibodies were from Roche Applied Science. Alkaline phosphatase-conjugated goat anti-mouse antibodies were purchased from Pierce. Hybond-P PVDF membrane and the enhanced chemifluorescence Western blotting detection kit were purchased from GE Healthcare. Scintillation counting supplies were purchased from National Diagnostics.
Strains and Growth Conditions
The strains used in this work are listed in TABLE ONE. Yeast cells were grown in YEPD medium (1% yeast extract, 2% peptone, 2% glucose) or in synthetic complete (SC) medium containing 2% glucose at 30 °C as described previously (31, 32). For selection of yeast cells bearing plasmids, appropriate amino acids were omitted from SC medium. The growth medium used for the analysis of lipids and for testing the inositol excretion phenotype lacked inositol (33). Growth of the ino1 mutant was used as an indicator of inositol excretion, and the inositol excreting opi1 mutant (34) was used as a positive control. Plasmid maintenance and amplifications were performed in Escherichia coli strain DH5α, and protein expression was performed in the strain BL21(DE3)pLysS. E. coli cells were grown in LB medium (1% tryptone, 0.5% yeast extract, 1% NaCl, pH 7.4) at 37 °C, and ampicillin (100 μg/ml) was added to select for the bacterial cells carrying plasmids. For growth on solid media, agar plates were prepared with supplementation of either 2% (yeast) or 1.5% (E. coli) agar. Cell numbers in liquid media were determined spectrophotometrically at an absorbance of 600 nm. For heterologous expression of yeast PAH1 and human LPIN1, E. coli BL21(DE3)pLysS cells bearing pGH313 and pGH318, respectively, were grown to A600 = 0.5 at room temperature in 500 ml of LB medium containing ampicillin (100 μg/ml) and chloramphenicol (34 μg/ml). The culture was incubated for 1 h with 1 mM isopropyl-β-D-thiogalactoside to induce the expression of His6-tagged Pah1p and lipin 1.
TABLE ONE.
Strains and plasmids used in this work
| Strain or plasmid | Genotype or relevant characteristics | Source or Ref. |
|---|---|---|
| E. coli | ||
| DH5α | F−, φ80dlacZΔM15, lacZYA -argF)U169, deoR, recA1, endA1, hsdR17(rk− mk+), phoA, supE44, λ thi-1 , gyrA96, relA1 | (32) |
| BL21(DE3)pLys | F− ompT hsdSB (rB−mB−) gal dcm (DE3) pLysS | Novagen |
| S. cerevisiae | ||
| BY4742 | MATα his3Δ1 leu2Δ0 lys2 Δ0 ura3Δ0 | Invitrogen |
| W303-1A | MATa ade2-1 can1-100 his3-11,15 leu2-3,112 trp1-1 ura3-1 | (77) |
| GHY57 | MATa ade2-1 can1-100 his3-11,15 leu2-3,112 trp1-1 ura3-1 pah1Δ::URA3 | This study |
| TBY1 | MATa ade2-1 can1-100 his3-11,15 leu2-3,112 trp1-1 ura3-1 | (15) |
| dpp1Δ::TRP1/Kanr lpp1Δ::HIS3/Kanr | ||
| GHY58 | MATa ade2-1 can1-100 his3-11,15 leu2-3,112 trp1-1 ura3-1 | This study |
| dpp1Δ::TRP1/Kanr lpp1Δ::HIS3/Kanr pah1Δ::URA3 | ||
| MC13 | MATα can1 ino1-13 lys2 | (33) |
| SH1100 | MATa his3-11,15 leu 2-3,112 ura3Δ5 opi1Δ::KanMX | (78) |
| Plasmids | ||
| YEp351 | Multicopy E. coli/yeast shuttle vector with LEU2 | (79) |
| pRS406 | Integrating E. coli/yeast shuttle vector with URA3 | (80) |
| pGH311 | PAH1 gene inserted into YEp351 | This study |
| pGH312 | PAH1HA gene inserted into YEp351 | This study |
| pGH317 | pah1Δ::URA3 inserted into pGH311 | This study |
| pET-15b | E. coli expression vector with N-terminal His6-tag fusion | Novagen |
| pGH313 | PAH1 coding sequence inserted into pET-15b | This study |
| pGH318 | LPIN1 coding sequence inserted into pET-15b | This study |
DNA Manipulations, Amplification of DNA by PCR, and DNA Sequencing
Standard methods were used to isolate plasmid DNA and yeast genomic DNA, and for manipulation of DNA using restriction enzymes, DNA ligase, and modifying enzymes (32). Yeast (35) and E. coli (32) transformations were performed by standard protocols. PCR reactions were optimized as described by Innis and Gelfand (36). DNA sequencing reactions were performed by the dideoxy method using Taq DNA polymerase (32) and analyzed by automated DNA sequencer.
Construction of Plasmids
The plasmids used in this work are listed in TABLE ONE. The S. cerevisiae PAH1 gene (SMP2/ YMR165C) was cloned by PCR. A 3.8-kb DNA fragment that contains the entire coding sequence (2.6 kb) of PAH1, the 5’-untranslated region (0.7 kb), and the 3’-untranslated region (0.5 kb) was amplified from the genomic DNA template of S. cerevisiae strain BY4742. The PAH1 DNA fragments were digested with XbaI/SphI and inserted into plasmid YEp351 at the same restriction enzyme sites. The multicopy plasmid containing PAH1 was named pGH311. The PAH1 gene was used to construct PAH1HA, in which the sequence for an HA epitope tag (YPYDVPDYA) was located after the start codon. The 0.7-kb and 3.1-kb PAH1 DNA fragments that contain the HA tag at the 3’ and 5’ ends, respectively, were amplified by PCR. These DNA fragments were digested with XbaI/AatII and AatII/SphI, respectively, and inserted into YEp351 at the XbaI/SphI sites. The multicopy plasmid containing PAH1HA was named pGH312. For expression of PAH1 in E. coli, the entire coding sequence of PAH1 was amplified by PCR using plasmid pGH311 as a template. The PCR product (~2.6 kb) was digested with HindIII to produce 0.6-kb and 2.0-kb DNA fragments, which were then digested with NdeI and XhoI, respectively. The NdeI-HindIII and HindIII-XhoI DNA fragments were inserted into pET-15b at the NdeI/XhoI sites. The E. coli expression plasmid containing the His6-tagged PAH1 was named pGH313. For expression of human LPIN1 (accession no: NM_145693) in E. coli, the entire coding sequence of the gene was amplified from a full-length LPIN1 cDNA clone (OriGENE Technologies, Inc) by PCR using primers with add-on restriction enzyme sites (MluI before start codon/XhoI after stop codon). The PCR product (2.7 kb) was digested with MluI, filled with Klenow, and digested with XhoI. The LPIN1 DNA fragment was ligated with pET-15b that was digested with NdeI, filled with Klenow, and digested with XhoI. The E. coli expression plasmid containing the His6-tagged LPIN1 was named pGH318.
Construction of the pah1Δ Mutant and the pah1Δ dpp1Δ lpp1Δ Triple Mutant
URA3 DNA (1.4 kb) was amplified from plasmid pRS406 by PCR using primers with add-on restriction enzyme sites. The PCR products were digested with Tth111I and SpeI, and inserted into the plasmid pGH311 that was digested with the same restriction enzymes to remove 80 % of the PAH1 coding sequence. The resulting plasmid, which contains a 3-kb PAH1 deletion cassette (pah1Δ ::URA3), was named pGH317. Deletion of the PAH1 gene in the yeast chromosome was performed by the method of one-step gene replacement (37). The PAH1 deletion cassette was released from plasmid pGH317 by digestion with XbaI and SphI, and used to transform strains W303-1A and TBY1. The resulting transformants were selected on SC-uracil media. Disruption of the PAH1 gene in uracil prototrophs was examined by PCR analysis of genomic DNA using primers that flank the inserted URA3 gene.
Preparation of the Cytosolic and Membrane Fractions from S. cerevisiae
All steps were performed at 4 °C. Yeast cells were suspended in 50 mM Tris-HCl (pH 7.5), 0.3 M sucrose, 10 mM 2-mercaptoethanol, 0.5 mM phenylmethanesulfonyl fluoride, 1 mM benzamidine, 5 μg/ml aprotinin, 5 μg/ml leupeptin, and 5 μg/ml pepstatin. Cells were disrupted with glass beads (0.5 mm diameter) using a Biospec Products Mini-BeadBeater-8 as described previously (38). Unbroken cells and glass beads were removed by centrifugation at 1,500 × g for 10 min. The cell lysate was centrifuged at 100,000 × g for 1 h to separate cytosolic (supernatant) from membrane fractions (pellet). The membranes were suspended in the same buffer used to disrupt cells. Protein concentration was estimated by the method of Bradford (39) using bovine serum albumin as the standard.
Purification of His6-tagged Pah1p and Human Lipin 1
All steps for protein purification were performed at 4 °C. E. coli cells expressing His6-tagged Pah1p and lipin 1 were washed once with 20 mM Tris-HCl (pH 8.0) buffer, and suspended in 20 ml of 20 mM Tris-HCl (pH 8.0) buffer containing 0.5 M NaCl, 5 mM imidazole, and 1 mM phenylmethylsulfonyl fluoride. Cells were disrupted by a freeze-thawing cycle and by two passes through a French press at 20,000 pounds/square inch. Unbroken cells and cell debris were removed by centrifugation at 12,000 × g for 30 min at 4 °C. The supernatant (cell lysate) was gently mixed with 2 ml of 50 % slurry of Ni2+-NTA agarose for 2 h. The Ni2+-NTA agarose/enzyme mixture was packed in a 10-ml Poly-Prep column, and washed with 20 ml of 20 mM Tris-HCl (pH 8.0) buffer containing 0.5 M NaCl, 45 mM imidazole, 10% glycerol, and 7 mM 2-mercaptoethanol. His6-tagged proteins were then eluted from the column in 1-ml fractions with a total of 5 ml of 20 mM Tris-HCl (pH 8.0) buffer containing 0.5 M NaCl, 250 mM imidazole, 10% glycerol, and 7 mM 2-mercaptoethanol. Enzyme preparations were dialyzed against 20 mM Tris-HCl (pH 8.0) buffer containing10 % glycerol, and 7 mM 2-mercaptoethanol and stored at −80 °C.
SDS-PAGE and Immunoblot Analysis
SDS-PAGE (40) and immunoblotting (41) using PVDF membrane were performed as described previously. For detection of the HA-tagged Pah1p, mouse monoclonal anti-HA antibodies were used at a dilution of 1:1,000. Goat anti-mouse IgG-alkaline phosphatase conjugates were used as secondary antibodies at a dilution of 1:5,000. The HA-tagged proteins were detected on immunoblots using the enhanced chemifluorescence Western blotting detection kit as described by the manufacturer. Images were acquired by FluorImaging analysis.
Preparation of Labeled Substrates
[32P]PA was synthesized enzymatically from DAG and [γ-32P]ATP with E. coli DAG kinase as described by Carman and Lin (42). [β-32P]Diacylglycerol pyrophosphate was synthesized enzymatically from PA and [γ-32P]ATP with Catharanthus roseus PA kinase as described by Wu et al. (19).
Enzyme Assays
Mg2+-dependent PA phosphatase activity was measured by following the release of water-soluble 32Pi from chloroform-soluble [32P]PA (10,000 cpm/nmol) as described by Carman and Lin (42). The reaction mixture contained 50 mM Tris-HCl buffer (pH 7.5), 1 mM MgCl2, 0.2 mM PA, 2 mM Triton X-100, and enzyme protein in a total volume of 0.1 ml. Diacylglycerol pyrophosphate phosphatase activity was measured by following the release of water-soluble 32Pi from chloroform-soluble [β-32P]diacylglycerol pyrophosphate (10,000 cpm/nmol) as described by Wu et al. (19). The reaction mixture contained 50 mM citrate buffer (pH 5.0), 0.1 mM diacylglycerol pyrophosphate, 2 mM Triton X-100, and enzyme protein in a total volume of 0.1 ml. All enzyme assays were conducted in triplicate at 30 °C. The average standard deviation of the assays was ± 5%. The reactions were linear with time and protein concentration. A unit of enzymatic activity was defined as the amount of enzyme that catalyzed the formation of 1 nmol of product per minute.
Labeling and Analysis of Lipids
Steady-state labeling of phospholipids and neutral lipids with 32Pi and [2-14C]acetate, respectively, were performed as described previously (43–46). Lipids were extracted from labeled cells by the method of Bligh and Dyer (47). Phospholipids were analyzed by two-dimensional thin-layer chromatography on silica gel plates using chloroform/methanol/ammonium hydroxide/water (45:25:2:3, v/v) as the solvent system for dimension one and chloroform/methanol/glacial acetic acid/water (32:4:5:1, v/v) as the solvent system for dimension two (48). Neutral lipids were analyzed by one-dimensional thin-layer chromatography on silica gel plates using the solvent system hexane/diethyl ether/glacial acetic acid (40:10:1, v/v) (49). The identity of the labeled lipids on thin-layer chromatography plates was confirmed by comparison with standards after exposure to iodine vapor. Radiolabeled lipids were visualized by phosphorimaging analysis. The relative quantities of labeled lipids were analyzed using ImageQuant software.
Data Analysis
Kinetic data were analyzed with the EZ-FIT enzyme kinetic model-fitting program (50), and statistical analyses were performed with SigmaPlot software. p values < 0.05 were taken as a significant difference.
RESULTS
Identification of the S. cerevisiae PAH1Gene Encoding a Mg2+-dependent PA Phosphatase Enzyme
Mg2+-dependent PA phosphatase was partially purified (through the Mono Q chromatography step) from sodium cholate-treated membranes as described by Lin and Carman (22). An SDS-polyacrylamide gel slice containing a protein with a molecular mass of 91 kDa was subjected to trypsin digestion followed by amino acid sequence analysis of peptide fragments by MALDI-TOF/TOF mass spectrometry.2 Unambiguous amino acid sequence information obtained from 23 peptides (Fig. 1) matched perfectly with the deduced amino acid sequence of SMP2 (YMR165C) in the Saccharomyces Genome Database. We renamed this gene PAH1 (phosphatidic acid phosphohydrolase) because its protein product has the molecular function of a PA phosphatase (phosphohydrolase) enzyme. The PAH1 sequence is found on chromosome XIII, does not have any sequence motifs suggesting introns in the gene, and its deduced protein product consists of 862 amino acids. Pah1p contains a conserved haloacid dehalogenase (HAD)-like domain (51, 52) in the middle of the protein sequence (Fig. 1), which contains a DxDxT (residues 398–402) motif that is found in a superfamily of Mg2+-dependent phosphatase enzymes with diverse substrate specificity (51, 52).
FIGURE 1. Peptide sequences derived from purified Mg2+-dependent PA phosphatase (Pah1p).
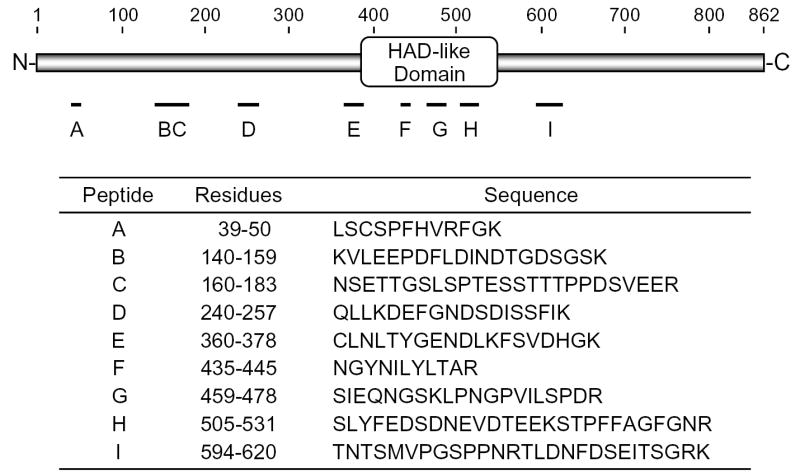
A 91-kDa protein present in a partially purified preparation of Mg2+-dependent PA phosphatase was subjected to trypsin digestion followed by mass spectrometry analysis of 23 peptide fragments. The figure shows the positions and sequences of the non-overlapping peptides derived from the Mg2+-dependent PA phosphatase protein (Pah1p). The position of the HAD-like domain in Pah1p is also indicated in the figure.
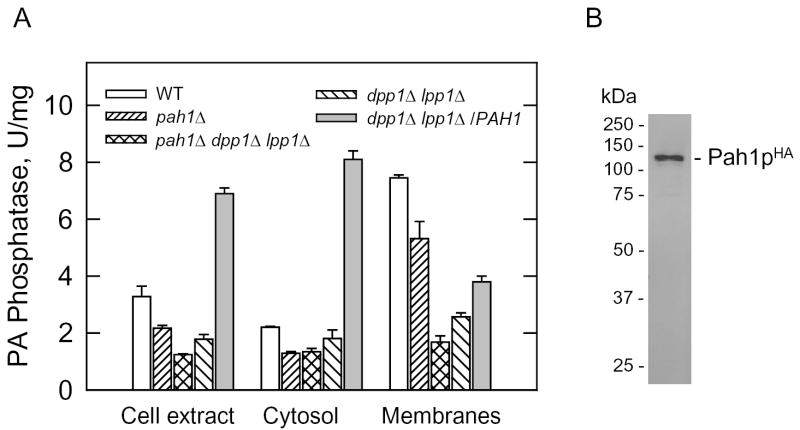
To examine the hypothesis that PAH1 encodes a Mg2+-dependent PA phosphatase, we examined the levels of the enzyme activity from cell extracts derived from exponential phase cells. In the pah1Δ mutant, the Mg2+-dependent PA phosphatase activity was reduced by 34 % when compared with the activity found in the wild-type parent (Fig. 2A). We also examined the effect of the pah1Δ mutation on Mg2+-dependent PA phosphatase activity in the dpp1Δ lpp1Δ mutant to eliminate the contributions of the DPP1-encoded and LPP1-encoded Mg2+-independent PA phosphatase activities that are still active under the assay conditions (e.g., 1 mM MgCl2) used for the Mg2+-dependent activity (22, 24, 29). The Mg2+-dependent PA phosphatase activity in the cell extract of pah1Δ dpp1Δ lpp1Δ triple mutant cells was 30 % lower that the activity in the dpp1Δ lpp1Δ double mutant (Fig. 2A). The remaining Mg2+-dependent PA phosphatase activity in the triple mutant must be attributed to yet another gene that codes for a PA phosphatase enzyme.
FIGURE 2. The effects of the pah1Δmutation and PAH1 gene overexpression on Mg2+-dependent PA phosphatase activity in S. cerevisiae, and immunoblot analysis of Pah1pHA.
A, cytosolic and membrane fractions were prepared from the indicated cells at the exponential phase of growth and assayed for Mg2+-dependent PA phosphatase activity. The data shown were determined from triplicate enzyme determinations + S.D. B, a sample (15 μg) of cell extract derived from dpp1Δ lpp1Δ cells overexpressing the PAH1HA gene were subjected to immunoblot analysis using anti-HA antibodies (1 μg/ml). The positions of Pah1pHA and molecular mass standards are indicated in the figure.
The multicopy plasmid containing the PAH1 gene directed a 4-fold overexpression of PA phosphatase activity when compared with dpp1Δ lpp1Δ cells not bearing the plasmid (Fig. 2A). As would be expected, the PA phosphatase activity directed by the PAH1 gene was dependent on the presence of Mg2+ ions in the assay buffer. A PAH1HA allele was constructed and cloned into a multicopy plasmid for identification of Pah1p by immunoblotting. The HA-tagged version of the enzyme was functional and exhibited the same levels of Mg2+-dependent PA phosphatase activity in the dpp1Δ lpp1Δ mutant as the untagged enzyme. Immunoblot analysis showed that the HA-tagged PA phosphatase (Pah1pHA) migrated as a 124-kDa protein upon SDS-PAGE (Fig. 2B).
The 91-kDa protein that was used to identify the PAH1 gene was isolated from the membrane fraction of yeast (22). Yet, Pah1p does not contain any transmembrane-spanning regions. Localization studies with a Pah1p fused with green fluorescent protein indicated that the Pah1p is present throughout the cytoplasm (18). Given this information, the association of Mg2+-dependent PA phosphatase activity with the cytosolic and membrane fractions of the cell was examined. As described previously (14, 15), most (66 %) of the membrane-associated PA phosphatase activity in wild type cells was attributed to the DPP1 and LPP1 gene products (Fig. 2A). Analysis of Mg2+-dependent PA phosphatase activity in the pah1Δ and pah1Δ dpp1Δ lpp1Δ mutants, and in the dpp1Δ lpp1Δ mutant overexpressing the PAH1 gene showed that the PAH1-encoded enzyme was found in both the cytosolic and membrane fractions (Fig. 2A). About 70 % of the PAH1-encoded Mg2+-dependent PA phosphatase present in the membrane fraction was extracted with 0.5 M NaCl (Fig. 3). This result indicated that the PAH1-encoded enzyme could associate with membranes as a peripheral membrane protein (53). The membrane-associated Mg2+-dependent PA phosphatase activity present in the pah1Δ dpp1Δ lpp1Δ triple mutant was also salt-extractable (Fig. 3).
FIGURE 3. Effect of NaCl on the membrane association of Mg2+-dependent PA phosphatase activity.
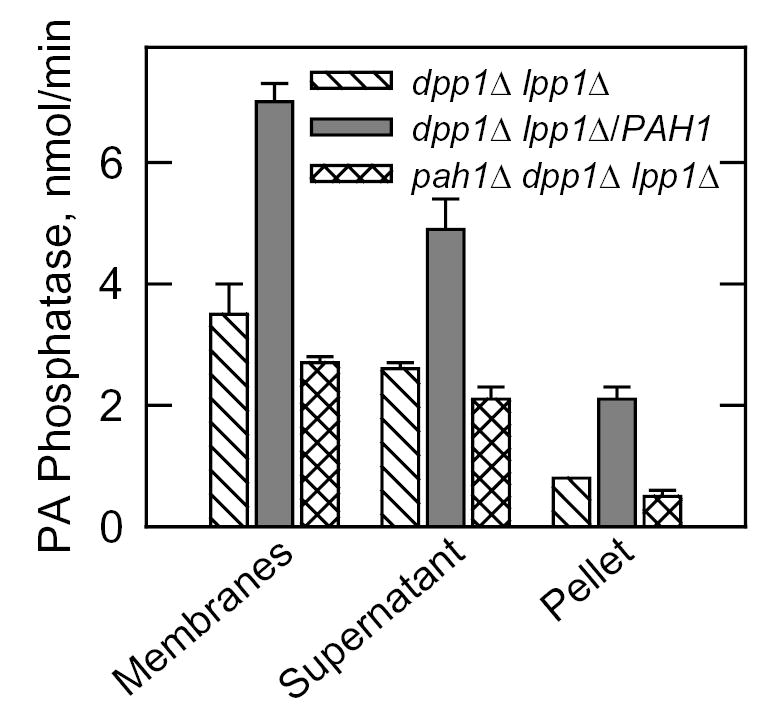
Membranes from the indicated cells were suspended in buffer containing 0.5 M NaCl at a final protein concentration of 1 mg/ml. After incubation with shaking for 5 min at 4 °C, the suspensions were centrifuged at 100,000 x g for 1 h at 4 °C. The pellet fraction from each sample was suspended in the same volume of buffer as the supernatant fraction. Equal volumes (10 μl) of the fractions were assayed for Mg2+-dependent PA phosphatase activity. The data shown were determined from triplicate enzyme determinations + S.D.
Mg2+-dependent and Mg2+-independent forms of PA phosphatase have been characterized as being sensitive or insensitive to the thioreactive agent NEM (12, 20). We examined the effect of NEM on the Mg2+-dependent PA phosphatase activity in the cytosolic fraction of wild type, dpp1Δ lpp1Δ, and pah1Δ dpp1Δ lpp1Δ cells. NEM inhibited the PA phosphatase activity in wild type cells and in dpp1Δ lpp1Δ mutant cells by 26 % and 27 %, respectively (Fig. 4). In the pah1Δ dpp1Δ lpp1Δ triplet mutant, 90 % of the PA phosphatase was inhibited by NEM (Fig. 4). These results indicated that the PAH1-encoded PA phosphatase was an NEM-insensitive enzyme whereas the remaining PA phosphatase activity in the triplet mutant was an NEM-sensitive enzyme.
FIGURE 4. Effect of NEM on the Mg2+-dependent PA phosphatase activity in S. cerevisiae wild type, dpp1Δ lpp1Δ, and pah1Δ dpp1Δ lpp1Δ cells.
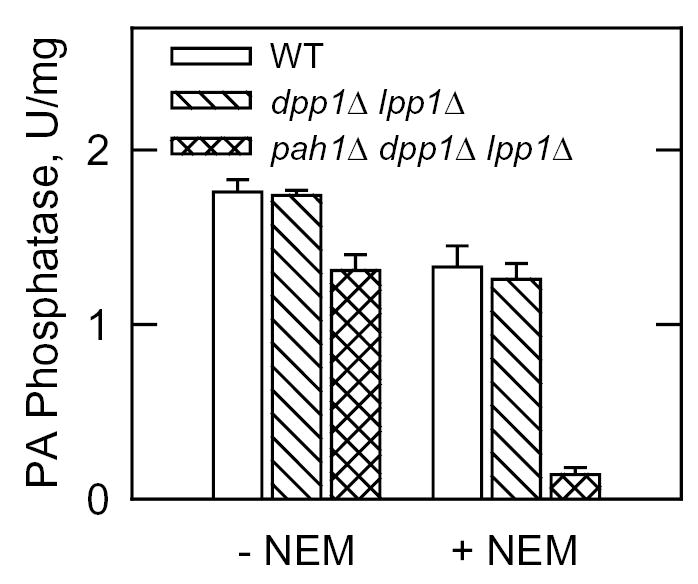
The cytosolic fraction from the indicated cells was assayed for Mg2+-dependent PA phosphatase activity in the absence and presence of 20 mM NEM. The data shown were determined from triplicate enzyme determinations + S.D.
Heterologous Expression of the PAH1-encoded Mg2+-dependent PA Phosphatase in E. coli
The overexpression of Mg2+-dependent PA phosphatase activity in dpp1Δ lpp1Δ cells bearing the PAH1 gene on a multicopy plasmid indicated that PAH1 encoded a Mg2+-dependent PA phosphatase enzyme. However, this result did not rule out the possibility that the PAH1 gene was a regulatory gene whose product controlled the expression or activities of PA phosphatase enzymes. We used heterologous expression of the yeast PAH1 gene in E. coli to test the hypothesis that the PAH1 gene was the structural gene encoding a Mg2+-dependent PA phosphatase enzyme. The purified His6-tagged Pah1p migrated as 114-kDa protein upon SDS-PAGE (Fig. 5A). This protein catalyzed the dephosphorylation of PA in a protein concentration-dependent manner (Fig. 5B). The specific activity of the recombinant PA phosphatase enzyme was 3,000 nmol/min/mg. If we assume that the specific activity of the PAH1-encoded Mg2+-dependent PA phosphatase in the cell extract of yeast is 0.5 nmol/min/mg (based on the data in Figs. 2 and 4), then the specific activity of the purified recombinant enzyme represents a 6,000-fold enrichment of the enzyme.
FIGURE 5. SDS-PAGE of the PAH1 gene product purified from E. coli and protein concentration dependence of its Mg2+-dependent PA phosphatase activity.
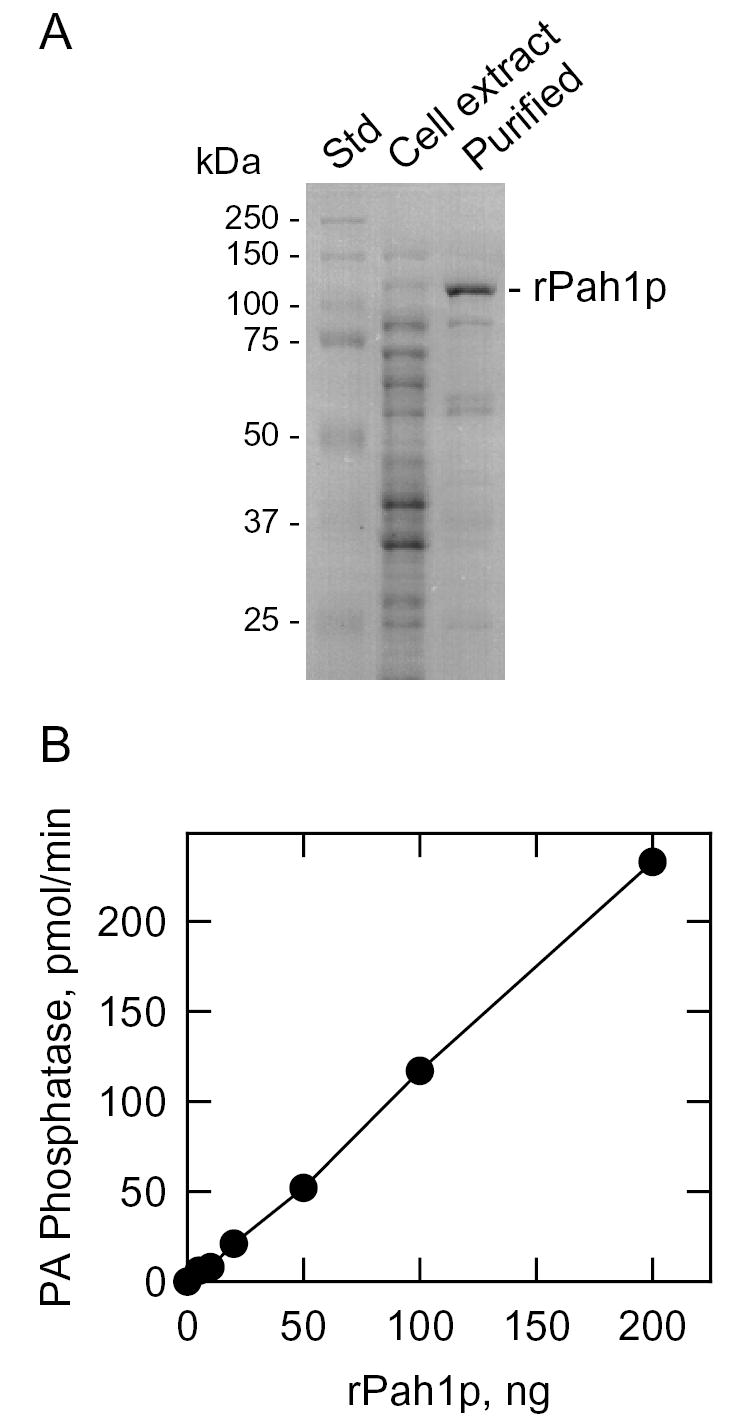
A, samples of molecular mass standards (Std), an E. coli cell extract, and the purified His-tagged PAH1-encoded protein were subjected to SDS-PAGE and stained with Coomassie Blue. The position of the recombinant PAH1-encoded protein (rPah1p) is indicated. B, the Mg2+-dependent PA phosphatase activity of the purified recombinant PAH1-encoded enzyme was measured with the indicated protein content.
We examined the basic enzymological properties of the purified recombinant Mg2+-dependent PA phosphatase enzyme. Optimum enzyme activity was found at pH 7.5 (Fig. 6A). No enzyme activity was observed when MgCl2 was omitted from the standard reaction mixture (Fig. 6B). PA phosphatase activity exhibited a dose-dependent requirement for MgCl2 with maximum activity at a final concentration of 1 mM (Fig. 6B). NEM (1–20 mM) did not affect the activity of the enzyme. The effect of Triton X-100 on Mg2+-dependent PA phosphatase activity is shown in Fig. 6C. The addition of Triton X-100 to the assay mixture resulted in the apparent inhibition of activity characteristic of surface dilution kinetics (54). The function of Triton X-100 in the assay for Mg2+-dependent PA phosphatase (22, 23) as well as many other lipid-dependent enzymes is to form a mixed micelle with the lipid substrate providing a surface for catalysis (54). Since the PAH1-encoded Mg2+-dependent PA phosphatase exhibited surface dilution kinetics, the kinetic analysis of the enzyme was performed using Triton X-100/PA-mixed micelles. Accordingly, the concentration of PA in the mixed micelles was expressed as a surface concentration in mol % as opposed to a molar concentration (54). In this experiment, the enzyme was measured such that Mg2+-dependent PA phosphatase activity was only dependent on the surface concentration of PA (i.e., at a molar PA concentration of 0.2 mM) and independent of the molar concentration of PA (54). As described for the Mg2+-dependent PA phosphatase purified from yeast (25), the enzyme exhibited positive cooperative kinetics with respect to the surface concentration of PA (Fig. 6D). Analysis of the kinetic data according to the Hill equation yielded a Hill number of 3 and a Km value for PA of 3 mol %. A major distinction between the Mg2+-dependent and Mg2+-independent PA phosphatase enzymes is the ability of the Mg2+-independent enzymes to utilize a variety of lipid phosphate substrates such as diacylglycerol pyrophosphate (12, 14, 15, 20). As described previously for the Mg2+-dependent PA phosphatase purified from yeast (19), the PAH1-encoded enzyme did not utilize diacylglycerol pyrophosphate as a substrate.
FIGURE 6. Effect of pH, MgCl2, Triton X-100, and PA surface concentration on PAH1-encoded Mg2+-dependent PA phosphatase activity.
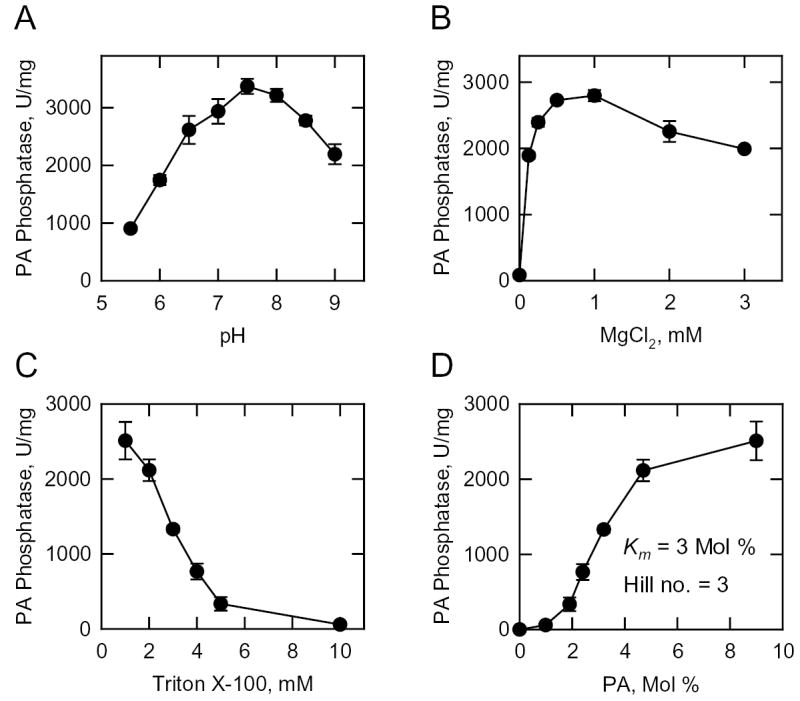
Purified recombinant PAH1-encoded enzyme was assayed for Mg2+-dependent PA phosphatase activity at the indicated pH values with 50 mM Tris-maleate-glycine buffer (A); the indicated concentrations of Triton X-100 (B); the indicated concentrations of MgCl2 (C); and the indicated surface concentrations (mol %) of PA (D). The molar concentration of PA was held constant at 0.2 mM. The data shown were determined from triplicate enzyme determinations + S.D.
Phenotypic Properties of the pah1Δ Mutant
A mutation in PAH1 (SMP2) was first identified in a screen for mutants that exhibit increased stability of heterologous plasmids (55). More recently, Santos-Rosa et al. (56) have shown that pah1Δ (smp2Δ) mutants have enlarged, irregularly shaped nuclei with projections that associate with the peripheral ER. This phenotype has been attributed to increased membrane phospholipid synthesis because the INO1, INO2, and OPI3 phospholipid synthesis genes are derepressed in the pah1Δ (smp2Δ) mutant background (56). The derepression of INO1 in the pah1Δ (smp2Δ) mutant prompted us to examine the mutant for the inositol excretion phenotype (34). Inositol excretion is due to the overexpression of INO1-encoded inositol-3-phosphate synthase activity and massive production of inositol (57–59). However, the pah1Δ mutant did not exhibit the inositol excretion phenotype. As described previously (56), the pah1Δ mutant grew more slowly than wild type cells at 30 °C and exhibited a temperature-sensitive phenotype at 37 °C (Fig. 7). Interestingly, the dpp1Δ lpp1Δ double mutant, which is defective in nearly all of the Mg2+-independent PA phosphatase activity in yeast (15), grew equally as well as wild type cells at both 30 and 37 °C (Fig. 7). The dpp1Δ lpp1Δ mutations, however, slightly exacerbated the temperature-sensitive phenotype of the pah1Δ mutation (Fig. 7).
FIGURE 7. Effect of temperature on the growth of S. cerevisiae wild type, pah1Δ, pah1Δ dpp1Δ lpp1Δ, and dpp1Δ lpp1Δ cells.
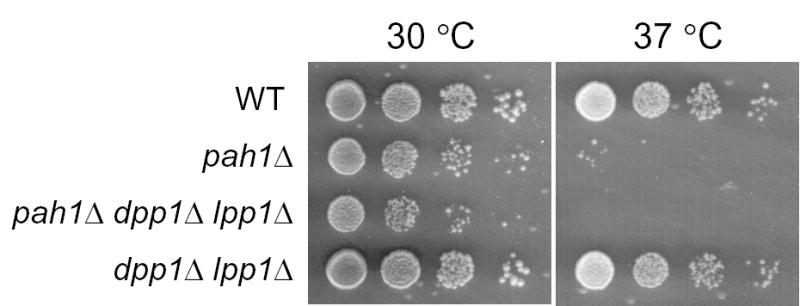
The indicated cells were grown to saturation in YEPD medium and diluted to a density of 2 x 10⁷ cells per ml at 30 °C. Serial dilutions (1:10) of the cells were spotted (5 μl) onto YEPD plates, and growth was scored after 2 days of incubation at 30 and 37 °C.
We questioned whether the pah1Δ mutation would affect the cellular levels of PA. In these experiments, cells were grown to the exponential and stationary phases of growth in medium lacking inositol. Both growth phases were examined because Mg2+-dependent PA phosphatase activity is elevated in stationary phase cells (46, 60). Inositol was omitted from the growth medium to preclude the regulatory effects that this phospholipid precursor has on phospholipid synthesis (5, 61). Phospholipids were extracted from wild type and pah1Δ mutant cells that were labeled to steady state with 32Pi, and analyzed by two-dimensional thin-layer chromatography. In exponential and stationary phase cells, the pah1Δ mutation caused increases in the cellular levels of PA of 122 and 160 %, respectively (Fig. 8). Introduction of the dpp1Δ lpp1Δ mutations into the pah1Δ mutant background resulted in yet a further accumulation of PA in exponential and stationary phase cells (Fig. 8). The PA levels in the pah1Δ dpp1Δ lpp1Δ triple mutant increased by 233 and 480 % in the exponential and stationary phases, respectively, when compared with the wild type control (Fig. 8). The pah1Δ mutation also affected the composition of major phospholipids in the exponential phase; the mutation caused a decrease in phosphatidylcholine (43 %) and increases in phosphatidylethanolamine (50 %) and phosphatidylinositol (80 %) (Fig. 8A). Similar effects on phospholipid composition were observed in the pah1Δ dpp1Δ lpp1Δ triple mutant (Fig. 8A). The decreased content of phosphatidylcholine might be attributed to the decrease in DAG needed for phosphatidylcholine synthesis via the CDP-choline pathway whereas the increased phosphatidylinositol content might be attributed to the INO1-mediated increase in the phosphatidylinositol precursor inositol (5). The effect of the pah1Δ mutation on phospholipid composition in stationary phase cells was not as great as that in exponential phase (Fig. 8B).
FIGURE 8. Phospholipid composition of the S. cerevisiae wild type, pah1Δ, pah1Δ dpp1Δ lpp1Δ, and dpp1Δ lpp1Δ cells in the exponential and stationary phases of growth.
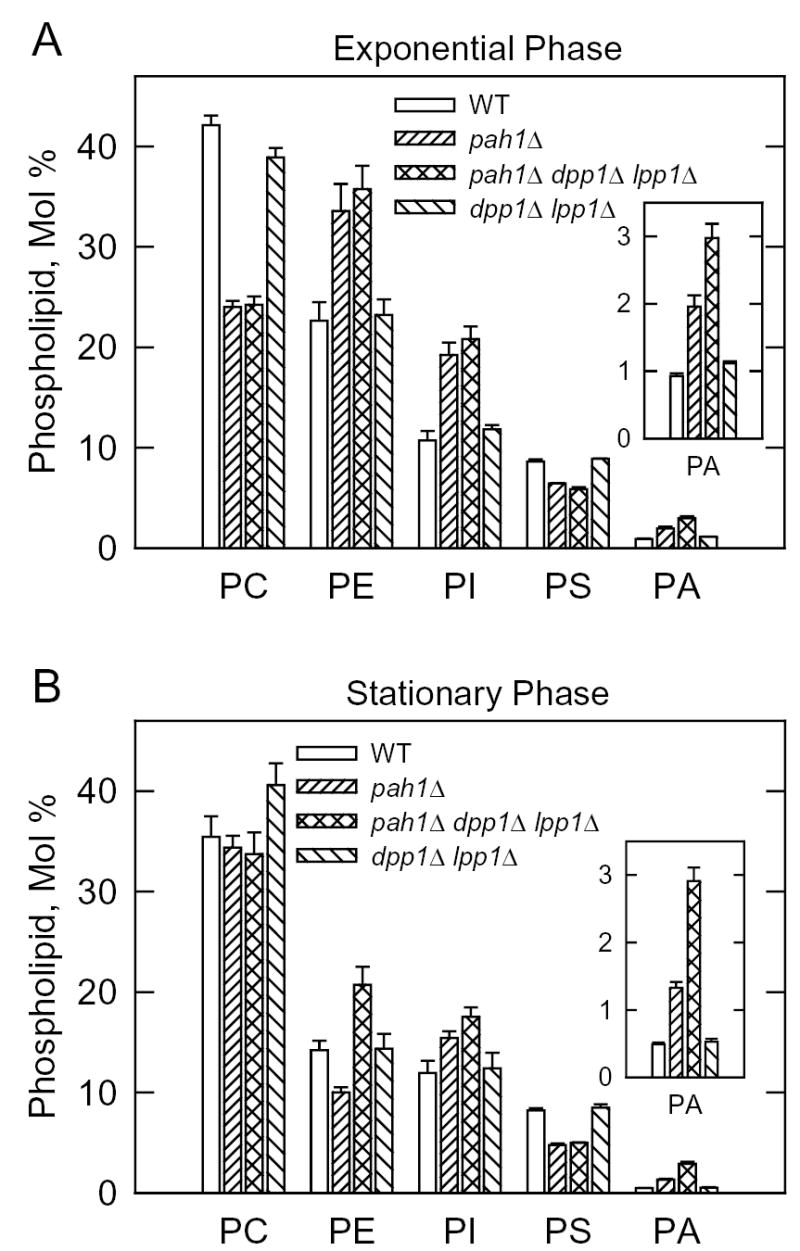
The indicated cells were grown to the exponential (A) and stationary (B) phases of growth in the presence of 32Pi (10 μCi/ml). Phospholipids were extracted, separated by two-dimensional thin-layer chromatography, and the images were subjected to ImageQuant analysis. The percentages shown for the individual phospholipids were normalized to the total 32P-labeled chloroform-soluble fraction that included sphingolipids and unidentified phospholipids. Each data point represents the average of three experiments ± S.D. Abbreviations: PC, phosphatidylcholine; PE, phosphatidylethanolamine; PI, phosphatidylinositol; PS, phosphatidylserine; PA, phosphatidate.
DAG is used by DAG acyltransferase enzymes to produce TAG (6, 62, 63). If the PAH1-encoded Mg2+-dependent PA phosphatase contributes to the production of this pool of DAG, then the pah1Δ mutation might be expected to affect TAG composition. This question was addressed by labeling cells with [2-14C]acetate followed by the extraction and analysis of neutral lipids by thin-layer chromatography. We analyzed TAG in both the exponential and stationary phases of growth because the level of TAG is elevated in stationary phase cells (60, 64). In exponential phase cells, the TAG content of the pah1Δ mutant was 62 % lower than that of the wild type parent (Fig. 9A). The effect of the pah1Δ mutation on TAG content was even more dramatic in stationary phase cells; TAG levels dropped by 92 % when compared with the control (Fig. 9B). That the defect in PA phosphatase activity in the pah1Δ mutant was responsible for the reduction in TAG content was supported by the decreased levels of DAG in both the exponential (40 %) and stationary (52 %) phases of growth (Fig. 9).
FIGURE 9. Neutral lipid composition of the S. cerevisiae wild type, pah1Δ, pah1Δ dpp1Δ lpp1Δ, and dpp1Δ lpp1Δ cells in the exponential and stationary phases of growth.
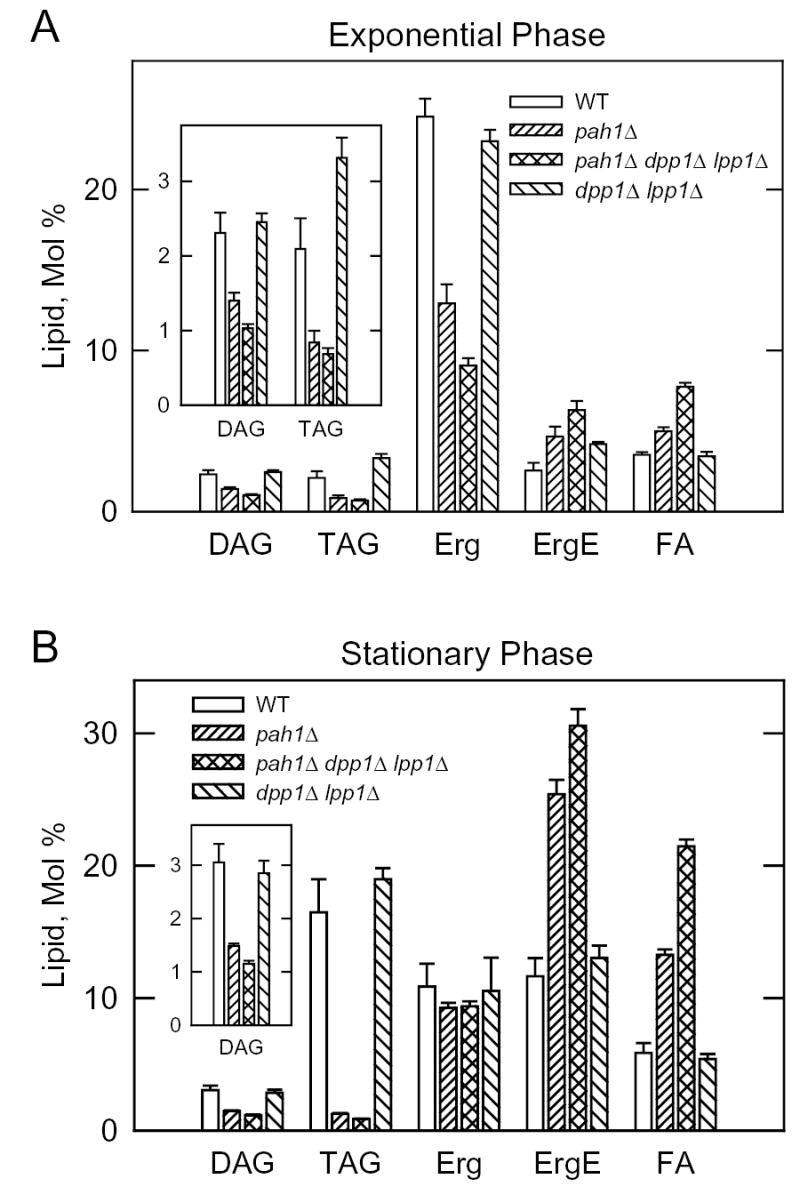
The indicated cells were grown to the exponential (A) and stationary (B) phases of growth in the presence of [2-14C]acetate (1 μCi/ml). Lipids were extracted, separated by one-dimensional thin-layer chromatography, and the images were subjected to ImageQuant analysis. The percentages shown for the individual lipids were normalized to the total 14C-labeled chloroform-soluble fraction, which also contained phospholipids and unidentified neutral lipids. Each data point represents the average of three experiments ± S.D. Abbreviations: DAG, diacylglycerol; TAG, triacylglycerol; Erg, ergosterol; ErgE, ergosterol ester; FA, fatty acid.
Sterols and free fatty acids were also affected by the pah1Δ mutation in exponential and stationary phase cells. The ergosterol ester content in the pah1Δ mutant increased by 88 % and 117 % in exponential and stationary phase cells, respectively, when compared with the wild type control (Fig. 9). The level of ergosterol decreased in the exponential phase of the pah1Δ mutant by 47 %, whereas in the stationary phase, the level of ergosterol was not significantly affected by the mutation (Fig. 9). The fatty acid content of the pah1Δ mutant in exponential and stationary phase cells increased by 43 % and 125 %, respectively, when compared with the control (Fig. 9). The increased levels of ergosterol ester and fatty acids were presumably due to the decreased ability of pah1Δ mutant cells to utilize fatty acids for TAG synthesis. The introduction of the dpp1Δ lpp1Δ mutations in the pah1Δ mutant background did not have a major effect on the changes in TAG and DAG that were brought about by the pah1Δ mutation itself. However, some of the effects of the pah1Δ mutation on sterols and fatty acids were enhanced by the dpp1Δ lpp1Δ mutations (Fig. 9). The dpp1Δ lpp1Δ mutations by themselves did not have a major effect on neutral lipid composition in either the exponential or stationary phases of growth (Fig. 9).
Heterologous Expression of the Human LPIN1 cDNA in E. coli and Identification of Lipin 1 as a Mg2+-dependent PA Phosphatase Enzyme
The protein product of the human LPIN1 gene (i.e., lipin 1) shares sequence homology with yeast Pah1p (30, 56). Although the molecular function of lipin 1 is unknown, it is known that this protein in mice plays a major role in fat homeostasis (30, 65–69). Accordingly, we questioned the possibility that lipin 1 might be a Mg2+-dependent PA phosphatase enzyme. To test this hypothesis, we expressed human LPIN1 cDNA in E. coli. Purified His6-tagged human lipin 1 was assayed for Mg2+-dependent PA phosphatase activity. The results of this assay showed that human lipin 1 was in fact a Mg2+-dependent PA phosphatase enzyme. The specific PA phosphatase activity of the purified protein was 1,600 nmol/min/mg. This level of activity was comparable to that of the purified recombinant PAH1-encoded Mg2+-dependent PA phosphatase enzyme. The enzymological characterization of the LPIN1-encoded Mg2+-dependent PA phosphatase will be the subject of separate report.
DISCUSSION
The Mg2+-dependent form of PA phosphatase is postulated to be the enzyme involved in the de novo synthesis of TAG and phospholipids (via the Kennedy pathway) in S. cerevisiae (6, 12). However, this notion has not been established because a gene encoding this enzyme is unknown. In this work using a reverse genetic approach, we identified PAH1 as the gene encoding a Mg2+-dependent PA phosphatase enzyme. Overexpression of the PAH1 gene in S. cerevisiae resulted in elevated levels of Mg2+-dependent PA phosphatase activity whereas the deletion of the gene resulted in the reduction of this enzyme activity. Moreover, cells containing the pah1Δ mutation accumulated PA, and had reduced amounts of DAG and its acylated derivative TAG. The effects of the pah1Δ mutation on TAG content were most evident in the stationary phase of growth where the synthesis of TAG predominates over the synthesis of phospholipids (60, 64). Likewise, the pah1Δ mutation showed the most striking effects on phospholipid composition in the exponential phase of growth where the synthesis of phospholipids dominates over TAG synthesis (60, 64). The heterologous expression of the S. cerevisiae PAH1 gene in E. coli confirmed that Pah1p possessed Mg2+-dependent PA phosphatase activity. Moreover, the enzymological properties of the recombinant Mg2+-dependent PA phosphatase were very similar to those of the 91-kDa enzyme previously purified from S. cerevisiae (22, 23, 25). Collectively, these data provided conclusive evidence that the S. cerevisiae PAH1 gene is a bona fide structural gene encoding a Mg2+-dependent PA phosphatase in S. cerevisiae, and that this enzyme does in fact generate DAG for lipid synthesis.
The 91-kDa form of Mg2+-dependent PA phosphatase used to identify the PAH1 gene was a proteolytic product of a larger sized enzyme (24). In fact, the sequence information derived from the 91-kDa enzyme lacked sequences at the C-terminal end of the protein (Fig. 1). The predicted size of Pah1p is 95-kDa. However, Pah1p expressed in S. cerevisiae migrated as a 124-kDa protein upon SDS-PAGE, whereas the protein expressed in E. coli migrated as a 114-kDa protein. The reason for the slow migration of E. coli-expressed Pah1p upon SDS-PAGE is unclear, but the differences between the sizes of Pah1p expressed in S. cerevisiae and E. coli might be explained by posttranslational modifications of the protein. This notion is supported by the observation that phosphorylation of Pah1p in S. cerevisiae results in a mobility shift to a position of higher molecular mass in SDS-polyacrylamide gels (56).
The PAH1-encoded Mg2+-dependent PA phosphatase contains an HAD-like domain with a catalytic DxDxT motif found in a superfamily of Mg2+-dependent phosphatase enzymes (51, 52). In contrast, the DPP1- and LPP1-encoded Mg2+-independent PA phosphatases contain a catalytic motif consisting of the consensus sequences KxxxxxxRP (domain 1)—PSGH (domain 2)—SRxxxxxHxxxD (domain 3), which is shared by a superfamily of lipid phosphatases that do not require Mg2+ ions for activity (70–72). Distinctive phosphatase motifs found in the different types of PA phosphatase provide an explanation as to why attempts to identify a Mg2+-dependent PA phosphatase gene by sequence homology to a Mg2+-independent PA phosphatase have been unsuccessful. Thus, while both forms of PA phosphatase catalyze the same overall reaction, it is expected that their catalytic mechanisms would be different. Another major difference between the two types of PA phosphatase enzymes is the nature in which they associate with membranes. The DPP1- and LPP1-encoded Mg2+-independent PA phosphatases are integral membranes proteins with six transmembrane-spanning regions (14, 15). On the other hand, the PAH1-encoded Mg2+-dependent PA phosphatase does not have any transmembrane-spanning regions. This enzyme was associated with both the membrane and cytosolic fractions of the cell, and the membrane-bound enzyme was a peripheral membrane protein.
Mg2+-dependent and Mg2+-independent PA phosphatase enzymes have been classified as being NEM-sensitive and NEM-insensitive, respectively (10, 12, 73, 74). However, sensitivity to NEM is not an appropriate criterion to classify the two types of PA phosphatase enzymes because each type contains both NEM-sensitive and NEM-insensitive enzymes. For example, the DPP1-encoded phosphatase is NEM-insensitive (19) whereas the LPP1-encoded phosphatase is NEM-sensitive (20). Likewise, the PAH1-encoded Mg2+-dependent PA phosphatase activity was insensitive to NEM whereas most of the Mg2+-dependent PA phosphatase activity remaining in the pah1Δ dpp1Δ lpp1Δ triple mutant was sensitive to NEM.
Pah1p (Smp2p) has been recently identified as a factor that coordinates phospholipid synthesis with nuclear/ER membrane growth (56). This conclusion is based on the correlation between massive nuclear/ER membrane expansion and the derepression of the phospholipid synthesis genes INO1 (involved in phosphatidylinositol synthesis), OPI3 (involved in phosphatidylcholine synthesis), and INO2 (a positive phospholipid synthesis transcription factor) in pah1Δ (smp2Δ) mutant cells (56). Chromatin immunoprecipitation analysis indicates that Pah1p (Smp2p) interacts with the promoters of the INO1, OPI3, and INO2 genes, suggesting its role as a transcription factor in the regulation of phospholipid synthesis (56). Previous studies have shown that the expression of these genes, which contain a UASINO element, is controlled by the positive transcription factors Ino2p and Ino4p, and by the negative transcription factor Opi1p (4, 5, 61). Maximum expression of these genes is driven by the interaction of an Ino2p-Ino4p complex with the UASINO element in their promoters, whereas expression of these genes is attenuated by interaction of Opi1p with DNA-bound Ino2p (75). The repressive effect of Opi1p is most dramatic when cells are supplemented with inositol (4, 5, 61). The molecular function (i.e., Mg2+-dependent PA phosphatase activity) of Pah1p identified in this work suggests that it might control the expression of phospholipid synthesis genes by controlling the levels of PA.
Loewen et al. (76) have shown that reduced PA concentration, brought about by inositol supplementation, promotes the translocation of Opi1p from the nuclear/ER into the nucleus where it interacts with Ino2p to repress INO1 expression (76). By analogy, the same mechanism should apply to the regulation of other UASINO-containing genes including OPI3 and INO2. The reduction in PA concentration in response to inositol supplementation has been attributed to increased PI synthesis (76), which draws upon the PA pool in the biosynthetic pathway (5). The PA-mediated regulation of Opi1p function might also be explained by involvement of the PAH1-encoded Mg2+-dependent PA phosphatase. Previous studies have shown that Mg2+-dependent PA phosphatase activity is elevated in inositol-supplemented cells (46), and as shown here, the PAH1 gene product played a role in controlling the cellular levels of PA. In addition, Pah1p (Smp2p) exists in S. cerevisiae as a phosphorylated protein, and it is dephosphorylated by an Nem1p-Spo7p protein phosphatase complex (56). Analysis of mutants defective in the protein phosphatase complex indicates that dephosphorylation of Pah1p (Smp2p) is required for normal expression of INO1, OPI3, and INO2, and nuclear/ER membrane growth (56). Based on these observations, the phosphorylation state of Pah1p might control its Mg2+-dependent PA phosphatase activity and/or the cellular location of the enzyme (e.g., membrane versus cytosolic), and thus the PA-mediated regulation of Opi1p and UASINO-containing genes. Additional studies are required to address these hypotheses.
Lipin 1 has been identified as a factor that controls fat metabolism in mammalian cells (30, 65–69). In a mouse model, lipin 1 deficiency prevents normal adipose tissue development that results in lipodystrophy and insulin resistance, whereas excess lipin 1 promotes obesity and insulin sensitivity (30, 65). Despite the importance of lipin 1, the mechanism by which it affects lipodystrophy and obesity has been an enigma due to the lack of information on the molecular function of the protein. In this work, we found that human lipin 1 is a Mg2+-dependent PA phosphatase, the penultimate enzyme in the pathway to synthesize TAG. This finding provides a mechanistic basis for how lipin 1 regulates lipid metabolism in mammalian cells. Moreover, this work indicated that Mg2+-dependent PA phosphatase activity might be an important pharmacological target to control lipid metabolism in humans.
Footnotes
*This work was supported in part by United States Public Health Service, National Institutes of Health Grant GM-28140.
The abbreviations used are: PA, phosphatidate; DAG, diacylglycerol; TAG, triacylglycerol; HA, hemagglutinin; PVDF, polyvinylidene difluoride; NEM, N-ethylmaleimide; ER, endoplasmic reticulum.
The amino acid sequence analysis was performed at the Center for Advanced Proteomics Research at the University of Medicine and Dentistry of New Jersey in Newark.
References
- 1.Smith SW, Weiss SB, Kennedy EP. J Biol Chem. 1957;228:915–922. [PubMed] [Google Scholar]
- 2.Carman GM, Henry SA. Annu Rev Biochem. 1989;58:635–669. doi: 10.1146/annurev.bi.58.070189.003223. [DOI] [PubMed] [Google Scholar]
- 3.Carman GM, Zeimetz GM. J Biol Chem. 1996;271:13293–13296. doi: 10.1074/jbc.271.23.13293. [DOI] [PubMed] [Google Scholar]
- 4.Henry SA, Patton-Vogt JL. Prog Nucleic Acid Res. 1998;61:133–179. doi: 10.1016/s0079-6603(08)60826-0. [DOI] [PubMed] [Google Scholar]
- 5.Carman GM, Henry SA. Prog Lipid Res. 1999;38:361–399. doi: 10.1016/s0163-7827(99)00010-7. [DOI] [PubMed] [Google Scholar]
- 6.Sorger D, Daum G. Appl Microbiol Biotechnol. 2003;61:289–299. doi: 10.1007/s00253-002-1212-4. [DOI] [PubMed] [Google Scholar]
- 7.Exton JH. J Biol Chem. 1990;265:1–4. [PubMed] [Google Scholar]
- 8.Exton JH. Biochim Biophys Acta. 1994;1212:26–42. doi: 10.1016/0005-2760(94)90186-4. [DOI] [PubMed] [Google Scholar]
- 9.Testerink C, Munnik T. Trends Plant Sci. 2005;10:368–375. doi: 10.1016/j.tplants.2005.06.002. [DOI] [PubMed] [Google Scholar]
- 10.Waggoner DW, Xu J, Singh I, Jasinska R, Zhang QX, Brindley DN. Biochim Biophys Acta. 1999;1439:299–316. doi: 10.1016/s1388-1981(99)00102-x. [DOI] [PubMed] [Google Scholar]
- 11.Sciorra VA, Morris AJ. Biochim Biophys Acta. 2002;1582:45–51. doi: 10.1016/s1388-1981(02)00136-1. [DOI] [PubMed] [Google Scholar]
- 12.Carman GM. Biochim Biophys Acta. 1997;1348:45–55. doi: 10.1016/s0005-2760(97)00095-7. [DOI] [PubMed] [Google Scholar]
- 13.Oshiro J, Han GS, Carman GM. Biochim Biophys Acta. 2003;1635:1–9. doi: 10.1016/j.bbalip.2003.10.002. [DOI] [PubMed] [Google Scholar]
- 14.Toke DA, Bennett WL, Dillon DA, Chen X, Oshiro J, Ostrander DB, Wu WI, Cremesti A, Voelker DR, Fischl AS, Carman GM. J Biol Chem. 1998;273:3278–3284. doi: 10.1074/jbc.273.6.3278. [DOI] [PubMed] [Google Scholar]
- 15.Toke DA, Bennett WL, Oshiro J, Wu WI, Voelker DR, Carman GM. J Biol Chem. 1999;273:14331–14338. doi: 10.1074/jbc.273.23.14331. [DOI] [PubMed] [Google Scholar]
- 16.Han GS, Johnston CN, Chen X, Athenstaedt K, Daum G, Carman GM. J Biol Chem. 2001;276:10126–10133. doi: 10.1074/jbc.M011421200. [DOI] [PubMed] [Google Scholar]
- 17.Han GS, Johnston CN, Carman GM. J Biol Chem. 2004;279:5338–5345. doi: 10.1074/jbc.M311779200. [DOI] [PubMed] [Google Scholar]
- 18.Huh WK, Falvo JV, Gerke LC, Carroll AS, Howson RW, Weissman JS, O'Shea EK. Nature. 2003;425:686–691. doi: 10.1038/nature02026. [DOI] [PubMed] [Google Scholar]
- 19.Wu WI, Liu Y, Riedel B, Wissing JB, Fischl AS, Carman GM. J Biol Chem. 1996;271:1868–1876. doi: 10.1074/jbc.271.4.1868. [DOI] [PubMed] [Google Scholar]
- 20.Furneisen JM, Carman GM. Biochim Biophys Acta. 2000;1484:71–82. doi: 10.1016/s1388-1981(99)00202-4. [DOI] [PubMed] [Google Scholar]
- 21.Faulkner AJ, Chen X, Rush J, Horazdovsky B, Waechter CJ, Carman GM, Sternweis PC. J Biol Chem. 1999;274:14831–14837. doi: 10.1074/jbc.274.21.14831. [DOI] [PubMed] [Google Scholar]
- 22.Lin YP, Carman GM. J Biol Chem. 1989;264:8641–8645. [PubMed] [Google Scholar]
- 23.Lin YP, Carman GM. J Biol Chem. 1990;265:166–170. [PubMed] [Google Scholar]
- 24.Morlock KR, McLaughlin JJ, Lin YP, Carman GM. J Biol Chem. 1991;266:3586–3593. [PubMed] [Google Scholar]
- 25.Wu WI, Lin YP, Wang E, Merrill AH, Jr, Carman GM. J Biol Chem. 1993;268:13830–13837. [PubMed] [Google Scholar]
- 26.Wu WI, Carman GM. J Biol Chem. 1994;269:29495–29501. [PubMed] [Google Scholar]
- 27.Wu WI, Carman GM. Biochemistry. 1996;35:3790–3796. doi: 10.1021/bi952808f. [DOI] [PubMed] [Google Scholar]
- 28.Quinlan JJ, Nickels JT, Jr, Wu WI, Lin YP, Broach JR, Carman GM. J Biol Chem. 1992;267:18013–18020. [PubMed] [Google Scholar]
- 29.Hosaka K, Yamashita S. Biochim Biophys Acta. 1984;796:102–109. [PubMed] [Google Scholar]
- 30.Peterfy M, Phan J, Xu P, Reue K. Nat Genet. 2001;27 :121–124. doi: 10.1038/83685. [DOI] [PubMed] [Google Scholar]
- 31.Rose, M. D., Winston, F., and Heiter, P. (1990) Methods in Yeast Genetics: A Laboratory Course Manual, Cold Spring Harbor Laboratory Press, Cold Spring Harbor, N.Y.
- 32.Sambrook, J., Fritsch, E. F., and Maniatis, T. (1989) Molecular Cloning, A Laboratory Manual, 2nd Ed., Cold Spring Harbor Laboratory, Cold Spring Harbor, N.Y.
- 33.Culbertson MR, Henry SA. Genetics. 1975;80:23–40. doi: 10.1093/genetics/80.1.23. [DOI] [PMC free article] [PubMed] [Google Scholar]
- 34.Greenberg M, Reiner B, Henry SA. Genetics. 1982;100:19–33. doi: 10.1093/genetics/100.1.19. [DOI] [PMC free article] [PubMed] [Google Scholar]
- 35.Ito H, Yasuki F, Murata K, Kimura A. J Bacteriol. 1983;153:163–168. doi: 10.1128/jb.153.1.163-168.1983. [DOI] [PMC free article] [PubMed] [Google Scholar]
- 36.Innis, M. A. and Gelfand, D. H. (1990) in PCR Protocols. A Guide to Methods and Applications (Innis, M. A., Gelfand, D. H., Sninsky, J. J., and White, T. J., eds) pp. 3–12, Academic Press, Inc., San Diego
- 37.Rothstein R. Methods Enzymol. 1991;194:281–301. doi: 10.1016/0076-6879(91)94022-5. [DOI] [PubMed] [Google Scholar]
- 38.Klig LS, Homann MJ, Carman GM, Henry SA. J Bacteriol. 1985;162:1135–1141. doi: 10.1128/jb.162.3.1135-1141.1985. [DOI] [PMC free article] [PubMed] [Google Scholar]
- 39.Bradford MM. Anal Biochem. 1976;72:248–254. doi: 10.1016/0003-2697(76)90527-3. [DOI] [PubMed] [Google Scholar]
- 40.Laemmli UK. Nature. Vol. 227. London: 1970. pp. 680–685. [DOI] [PubMed] [Google Scholar]
- 41.Haid A, Suissa M. Methods Enzymol. 1983;96:192–205. doi: 10.1016/s0076-6879(83)96017-2. [DOI] [PubMed] [Google Scholar]
- 42.Carman GM, Lin YP. Methods Enzymol. 1991;197:548–553. doi: 10.1016/0076-6879(91)97182-x. [DOI] [PubMed] [Google Scholar]
- 43.Atkinson K, Fogel S, Henry SA. J Biol Chem. 1980;255:6653–6661. [PubMed] [Google Scholar]
- 44.Atkinson KD, Jensen B, Kolat AI, Storm EM, Henry SA, Fogel S. J Bacteriol. 1980;141:558–564. doi: 10.1128/jb.141.2.558-564.1980. [DOI] [PMC free article] [PubMed] [Google Scholar]
- 45.Homann MJ, Poole MA, Gaynor PM, Ho CT, Carman GM. J Bacteriol. 1987;169:533–539. doi: 10.1128/jb.169.2.533-539.1987. [DOI] [PMC free article] [PubMed] [Google Scholar]
- 46.Morlock KR, Lin YP, Carman GM. J Bacteriol. 1988;170:3561–3566. doi: 10.1128/jb.170.8.3561-3566.1988. [DOI] [PMC free article] [PubMed] [Google Scholar]
- 47.Bligh EG, Dyer WJ. Can J Biochem Physiol. 1959;37:911–917. doi: 10.1139/o59-099. [DOI] [PubMed] [Google Scholar]
- 48.Esko JD, Raetz CRH. J Biol Chem. 1980;255:4474–4480. [PubMed] [Google Scholar]
- 49.Henderson, R. J. and Tocher, D. R. (1992) in Lipid Analysis (Hamilton, R. J. and Hamilton, S., eds) pp. 65–111, IRL Press, New York
- 50.Perrella F. Anal Biochem. 1988;174:437–447. doi: 10.1016/0003-2697(88)90042-5. [DOI] [PubMed] [Google Scholar]
- 51.Koonin EV, Tatusov RL. J Mol Biol. 1994;244:125–132. doi: 10.1006/jmbi.1994.1711. [DOI] [PubMed] [Google Scholar]
- 52.Madera M, Vogel C, Kummerfeld SK, Chothia C, Gough J. Nucleic Acids Res. 2004;32:D235–D239. doi: 10.1093/nar/gkh117. [DOI] [PMC free article] [PubMed] [Google Scholar]
- 53.Singer SJ, Nicolson GL. Science. 1972;175:720–721. doi: 10.1126/science.175.4023.720. [DOI] [PubMed] [Google Scholar]
- 54.Carman GM, Deems RA, Dennis EA. J Biol Chem. 1995;270:18711–18714. doi: 10.1074/jbc.270.32.18711. [DOI] [PubMed] [Google Scholar]
- 55.Irie K, Takase M, Araki H, Oshima Y. Mol Gen Genet. 1993;236:283–288. doi: 10.1007/BF00277124. [DOI] [PubMed] [Google Scholar]
- 56.Santos-Rosa H, Leung J, Grimsey N, Peak-Chew S, Siniossoglou S. EMBO J. 2005;24:1931–1941. doi: 10.1038/sj.emboj.7600672. [DOI] [PMC free article] [PubMed] [Google Scholar]
- 57.Beggs, J. D. (1981) in Genetic Engineering (Williamson, R., eds) pp. 175–203, Academic Press, New York
- 58.Donahue TF, Henry SA. Genetics. 1981;98:491–503. doi: 10.1093/genetics/98.3.491. [DOI] [PMC free article] [PubMed] [Google Scholar]
- 59.Donahue TF, Henry SA. J Biol Chem. 1981;256:7077–7085. [PubMed] [Google Scholar]
- 60.Hosaka K, Yamashita S. Biochim Biophys Acta. 1984;796:110–117. [PubMed] [Google Scholar]
- 61.Greenberg ML, Lopes JM. Microbiol Rev. 1996;60:1–20. doi: 10.1128/mr.60.1.1-20.1996. [DOI] [PMC free article] [PubMed] [Google Scholar]
- 62.Oelkers P, Tinkelenberg A, Erdeniz N, Cromley D, Billheimer JT, Sturley SL. J Biol Chem. 2000;275:15609–15612. doi: 10.1074/jbc.C000144200. [DOI] [PubMed] [Google Scholar]
- 63.Oelkers P, Cromley D, Padamsee M, Billheimer JT, Sturley SL. J Biol Chem. 2002;277:8877–8881. doi: 10.1074/jbc.M111646200. [DOI] [PubMed] [Google Scholar]
- 64.Taylor FR, Parks LW. Biochim Biophys Acta. 1979;575:204–214. doi: 10.1016/0005-2760(79)90022-5. [DOI] [PubMed] [Google Scholar]
- 65.Phan J, Reue K. Cell Metab. 2005;1:73–83. doi: 10.1016/j.cmet.2004.12.002. [DOI] [PubMed] [Google Scholar]
- 66.Phan J, Reue K. Obstet Gynecol Surv. 2005;60:652–653. [Google Scholar]
- 67.Peterfy M, Phan J, Reue K. J Biol Chem. 2005;280:32883–32889. doi: 10.1074/jbc.M503885200. [DOI] [PubMed] [Google Scholar]
- 68.Phan J, Peterfy M, Reue K. Drug News Perspect. 2005;18:5–11. doi: 10.1358/dnp.2005.18.1.877165. [DOI] [PubMed] [Google Scholar]
- 69.Phan J, Peterfy M, Reue K. J Biol Chem. 2004;279:29558–29564. doi: 10.1074/jbc.M403506200. [DOI] [PubMed] [Google Scholar]
- 70.Stukey J, Carman GM. Protein Science. 1997;6:469–472. doi: 10.1002/pro.5560060226. [DOI] [PMC free article] [PubMed] [Google Scholar]
- 71.Hemrika W, Renirie R, Dekker HL, Barnett P, Wever R. Proc Nat Acad Sci USA. 1997;94:2145–2149. doi: 10.1073/pnas.94.6.2145. [DOI] [PMC free article] [PubMed] [Google Scholar]
- 72.Neuwald AF. Protein Science. 1997;6:1764–1767. doi: 10.1002/pro.5560060817. [DOI] [PMC free article] [PubMed] [Google Scholar]
- 73.Brindley DN. Prog Lipid Res. 1984;23:115–133. doi: 10.1016/0163-7827(84)90001-8. [DOI] [PubMed] [Google Scholar]
- 74.Bell RM, Burns DJ. J Biol Chem. 1991;266:4661–4664. [PubMed] [Google Scholar]
- 75.Wagner C, Dietz M, Wittmann J, Albrecht A, Schuller HJ. Mol Microbiol. 2001;41:155–166. doi: 10.1046/j.1365-2958.2001.02495.x. [DOI] [PubMed] [Google Scholar]
- 76.Loewen CJR, Gaspar ML, Jesch SA, Delon C, Ktistakis NT, Henry SA, Levine TP. Science. 2004;304:1644–1647. doi: 10.1126/science.1096083. [DOI] [PubMed] [Google Scholar]
- 77.Thomas B, Rothstein R. Cell. 1989;56:619–630. doi: 10.1016/0092-8674(89)90584-9. [DOI] [PubMed] [Google Scholar]
- 78.Sreenivas A, Villa-Garcia MJ, Henry SA, Carman GM. J Biol Chem. 2001;276:29915–29923. doi: 10.1074/jbc.M105147200. [DOI] [PubMed] [Google Scholar]
- 79.Hill JE, Myers AM, Koerner TJ, Tzagoloff A. Yeast. 1986;2:163–167. doi: 10.1002/yea.320020304. [DOI] [PubMed] [Google Scholar]
- 80.Sikorski RS, Hieter P. Genetics. 1989;122:19–27. doi: 10.1093/genetics/122.1.19. [DOI] [PMC free article] [PubMed] [Google Scholar]


