

Abstract
The availability of high-intensity synchrotron facilities, technological advances in data-collection techniques and improved data-reduction and crystallographic software have ushered in a new era in high-throughput macromolecular crystallography. Here, the de novo automated crystal structure determination at 1.28 Å resolution of an NAD(P)H-dependent FMN reductase flavoprotein from Pseudomonas aeruginosa PA01-derived protein Q9I4D4 using the anomalous signal from an unusually small number of S atoms is reported. Although this protein lacks the flavodoxin key fingerprint motif [(T/S)XTGXT], it has been confirmed to bind flavin mononucleotide and the binding site was identified via X-ray crystallography. This protein contains a novel flavin mononucleotide-binding site GSLRSGSYN, which has not been previously reported. Detailed statistics pertaining to sulfur phasing and other factors contributing to structure determination are discussed. Structural comparisons of the apoenzyme and the protein complexed with flavin mononucleotide show conformational changes on cofactor binding. NADPH-dependent activity has been confirmed with biochemical assays.
1. Introduction
A major concern in high-throughput macromolecular structure determination is the high cost of sample preparation. Efficient techniques such as multiple-wavelength anomalous dispersion (MAD) methods utilize selenomethionine proteins. Preparation of selenomethionine (SeMet) proteins is frequently straightforward, typical anomalous signals are acceptably high and readily measurable and the Se absorption edge can be accessed at most synchrotron-radiation sources (0.98 Å, 12.65 keV). If, however, native protein crystals could be used directly for structure determination, it will cut the cost of SeMet protein production/crystallization and obviate the need to record diffraction data at multiple X-ray wavelengths. As most proteins contain either methionines or cysteines or both, the sulfur anomalous signal could be used to phase the X-ray data. Although the X-ray absorption edge of sulfur lies at a prohibitively long wavelength (5.02 Å), its anomalous scattering contribution (f″) at accessible X-ray wavelength (Cu Kα, 0.56 electrons; λ = 1.74 Å, 0.70 electrons) can be measured and may be useful for phasing diffraction data.
Since the structure of crambin (six Cys/45 residues) was determined (Hendrickson & Teeter, 1981), technological advancements in data-collection software and hardware and the availability of high-energy synchrotron sources have rekindled interest in using the sulfur anomalous signal for macromolecular structure determination (Dauter et al., 1999). In some cases, the sulfur anomalous signal has aided in tracing the polypeptide chain (Greenwald et al., 1999). Redetermination of previously known structures using sulfur anomalous signals and de novo structure determinations of relatively small proteins or those crystallizing in high-symmetry space groups have been reported (Ramagopal et al., 2003; Olsen et al., 2004). Both high-intensity synchrotron radiation and Cu Kα radiation from in-house facilities have been used successfully (Debreczeni, Bunkoczi, Girmann et al., 2003; Debreczeni, Bunkoczi, Ma et al., 2003; Debreczeni, Girmann et al., 2003; Rose et al., 2001). However, in all these cases at least one disulfide bond is present. Here, we report for the first time sulfur anomalous scattering structure determination for a protein entirely lacking Cys residues.
The NADH-dependent reductases are widely distributed flavin-containing proteins (Ernster & Navazio, 1957) that catalyze nicotinamide nucleotide-dependent reductions of quinones, quinoneimines, azo dyes and nitro groups. The most frequently used cofactors in such enzymatic redox reactions are pyridines (NAD, NADPH) and flavins (FMN/FAD) (Liger et al., 2004). Flavin coenzymes can exist in three different redox states, characterized by different colors (oxidized form, yellow; reduced form, colorless; semiquinone form, blue). Flavin molecules can support both one- and two-electron transfer reactions. The flavodoxins are commonly small monomeric proteins that bind noncovalently to a single FMN cofactor that forms the active center (Simondsen & Tollin, 1980). The enzyme effects electron transfer by providing a micro-environment that stabilizes the FMN molecule by sandwiching it between two hydrophobic side chains, promoting the highly negative redox potential required for activity. Flavodoxins are widely involved in the electron-transfer reactions required for the metabolism of pyruvate, nitrogen and pyridine nucleotides (Liger et al., 2004). Induction of quinone reductases protects against the toxic and neoplastic effects of quinines (Benson et al., 1980).
The Pseudomonas aeruginosa PA01-derived Q9I4D4 open reading frame codes for a 20 kDa protein with unknown function and is annotated as a hypothetical protein (T1501; http://www.nysgrc.org). This protein was chosen as a target of the New York Structural Genomics Research Consortium (NYSGXRC) because no structural information was available at the time of target selection. Here, we report structure determination of T1501 using sulfur anomalous signal. To the best of our knowledge, this is the first time sulfur SAD has been successfully used to determine the structure of a 193-amino-acid protein containing no cysteine, with signals from only four S atoms (including a sulfate ion). The effects of parameters such as data redundancy, signal-to-noise ratio, X-ray beam stability and diffraction limit on the success of structure determination are discussed. We have also compared the phase information obtained from SOLVE versus that from SHELX. In addition to the native structure, we report the structure of T1501 bound to FMN, confirming that T1501 is almost certainly an NADPH-dependent FMN reductase.
2. Materials and methods
2.1. Cloning, expression and purification
The target gene for T1501 was amplified via PCR from P. aeruginosa genomic DNA with the appropriate forward (AGCGACGACATCAAGGTATTG) and reverse (CGCGCACCCATAGCTGCAG) primers and Taq DNA polymerase (Qiagen) using standard methods. Following gel purification, the PCR product was inserted into a pET vector modified for topoisomerase-directed cloning (Invitrogen) designed to express the protein of interest followed by a C-terminal hexahistidine tag and was transformed into TOP10 cells. The clone was confirmed for correct sequence. The expression and solubility of the protein were checked by standard procedures.
A medium-scale cell culture was grown by adding 500 ml LB medium, 25 ml 10% glucose solution, 500 μl 30 mg ml−1 kanamycin solution and a small amount of transformed cell glycerol stock scraping to a 2 l baffled flask and shaking overnight at 250 rev min−1 and 303 K. 10 ml of this mixture was added to each of six flasks containing the same culture medium (except for the glycerol stock) for large-scale expression and held at 250 rev min−1 and 310 K until the OD at 595 nm reached ∼0.8. The cultures were then induced with 200 μl 1 M IPTG.
After shaking overnight at 250 rev min−1 and 294 K, the contents of the flasks were poured into 1 l spin bottles and spun at 6500 rev min−1 for 10 min. After removal of the supernatant, the pellets were collected in 50 ml conical tubes (total mass 26.0 g) and frozen at 193 K.
The pellet was resuspended in lysis buffer (35 ml per 10 g) containing 50 μl protease-inhibitor cocktail (Sigma) and 5 μl benzonase (Novagen) and subjected to repeated sonication with intervals of cooling. The lysate was then clarified by centrifugation at 38 900g for 30 min. The protein was then immobilized on Ni–NTA resin (Qiagen), placed on a drip column, washed with 25 ml buffer A (50 mM Tris–HCl pH 7.8, 500 mM NaCl, 10 mM imidazole, 10 mM methionine and 10% glycerol) and eluted into an Amicon concentrator (Millipore) with 15 ml buffer A containing 500 mM imidazole. The solution was concentrated to 6 ml, loaded onto a S200 gel-filtration column and was run off with buffer containing 10 mM HEPES pH 7.5, 150 mM NaCl, 10 mM methionine, 10% glycerol and 5 mM DTT. The protein yield was 71.9 mg.
2.2. Crystallization and diffraction data collection
Crystallization screening was carried out by the sitting-drop vapor-diffusion method using the TECAN Gemini crystallization robot system with Crystal Screen High Throughput (CSHT) and Index Screen High Throughput (IHT) from Hampton Research in 96-well plates. 1 μl protein solution at 10 mg ml−1 was mixed with 1 μl precipitant and equilibrated against 100 μl of the same precipitant at room temperature. Crystals appeared in many conditions within 1 d. Best crystals (yellow in color) were obtained in 0.2 M calcium acetate hydrate, 0.1 M sodium cacodylate pH 6.5, 18%(w/v) polyethylene glycol 8000 after 7–10 d. Following cryoprotection using a mother liquor containing 15% glycerol and flash-freezing in liquid nitrogen, diffraction data were collected under standard cryogenic conditions at the X12C beamline of the National Synchrotron Light Source (Brookhaven National Laboratory, Upton, NY, USA). Crystals diffracted to better than 1.3 Å and belong to space group I222, with unit-cell parameters a = 63.06, b = 67.20, c = 81.54 Å (Matthews coefficient VM = 2.45 Å3 Da−1, assuming one molecule per asymmetric unit). A native data set extending to 1.28 Å resolution was obtained at λ = 1.1 Å. Since the diffraction quality was excellent, it was decided to collect sulfur SAD data at λ = 1.7 Å. In order to obtain higher redundancy, two data sets (Set1 and Set2) were collected at this wavelength for a total 720° rotation in φ. Data were reduced and scaled with HKL2000 (Otwinowski & Minor, 1997). The data-collection and refinement statistics are given in Table 1.
Table 1.
Crystal data and refinement statistics. Values for the highest resolution shell are given in parentheses.
| Apoenzyme | FMN complex | ||
|---|---|---|---|
| Space group | I222 | P212121 | |
| Unit-cell parameters (Å) | a = 66.07, b = 70.39, c = 85.38 | a = 61.47, b = 65.70, c = 117.80 | |
| Method | — | SAD | MR |
| Wavelength (Å) | 1.1 | 1.7 | 1.1 |
| Anomalous scatterer | — | Sulfur | — |
| Resolution (Å) | 50–1.28 (1.33–1.28) | 50–1.76 (1.83–1.76) | 50–2.69 (2.79–2.69) |
| Completeness (%) | 85.3 (40.6) | 84.0 (25.0) | 99.9 (91.5) |
| No. of molecules per ASU | 1 | 1 | 2 |
| No. of reflections | 44841 | 16798 | 13038 |
| I/σ(I) | 21.2 (2.2) | 36.8 (6.8) | 12.2 (3.1) |
| Redundancy | 6.9 | 12.1 | 4.3 |
| Rmerge | 0.036 (0.23) | 0.036 (0.12) | 0.070 (0.31) |
| Refinement statistics | |||
| Resolution range (Å) | 50–1.28 | 50–2.69 | |
| No. of reflections | 44069 | 12497 | |
| R factor | 0.21 | 0.21 | |
| Rfree | 0.22 | 0.28 | |
| No. of protein atoms | 1330 | 2660 | |
| No. of heterogen atoms | 5 | 62 | |
| No. of water molecules | 164 | 160 | |
| R.m.s.d. bonds (Å) | 0.044 | 0.066 | |
| R.m.s.d. angles (°) | 1.35 | 1.33 | |
| Ramachandran plot | |||
| Most favored region (%) | 89.8 | 90.5 | |
| Additionally allowed (%) | 8.8 | 8.2 | |
| PDB code | 1rtt | 1×77 | |
| Phasing statistics for S-SAD data Set2 | |||
| Phasing power | 0.721 | ||
| FOM, acentric | 0.235 | ||
| FOM after solvent flattening | 0.947 | ||
2.3. Structure determination of apoenzyme by sulfur-SAD
SOLVE was used to determine the ‘heavy-atom’ sulfur position (Terwilliger & Berendzen, 1999). The two data sets, Set1 and Set2, were examined both separately and together (Set1-2). A resolution cutoff of 2.5 Å was used for evaluation of all three data sets. Although only three methionine residues were present in the polypeptide chain, SOLVE yielded four sulfur positions. (The fourth sulfur site proved to be a sulfate ion that was not present in the solution used for crystallization.) Phase refinement, extension and automatic model building with RESOLVE were not successful. Accordingly, phase refinement was carried out with the sulfur positions using SHARP (de La Fortelle & Bricogne, 1997). Phases were further improved by density modification using SOLOMON (Collaborative Computational Project, Number 4, 1994) and then used in ARP/wARP for automatic model building (Perrakis et al., 1999). 91% of the polypeptide chain was built automatically and the remainder was fitted manually using O (Jones et al., 1991). Refinement was carried out with data extending to 1.28 Å resolution using CNS (Brünger et al., 1998).
The final model contains 174 amino acids (residues 7–180; Fig. 1), one sulfate ion and 164 water molecules. The electron density is well defined throughout the length of the polypeptide chain (Fig. 2) and all φ–ψ values fall within the allowed regions of the Ramachandran diagram (Table 1; Laskowski et al., 1993).
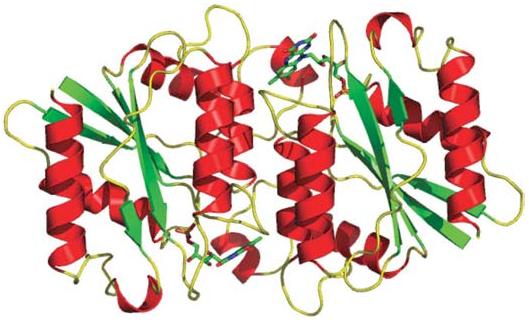
Figure 1.

Ribbon representation of T1501 apoenzyme with sulfate bound at the active site. βSheets have been labeled β1–β5 and α-helices α1–α5.
Figure 2.
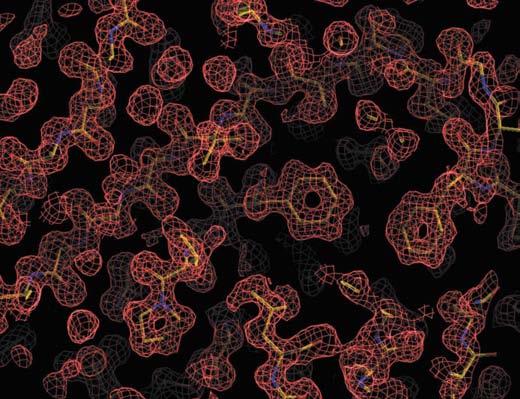
Composite omit electron-density map. A representative region of the apoenzyme calculated with 1.28 Å resolution data and contoured at the 1σ level.
2.4. Structure determination of T1501 complexed with FMN
In order to confirm the presence and the type of cofactor, the protein crystals were soaked in mother liquor containing a 1 mM final concentration of FMN for 1 min. Diffraction data were collected at an X-ray wavelength of λ = 1.1 Å and the crystal diffracted to better than 2.7 Å resolution (Table 1). The crystal form used for this soaking experiment proved to be orthorhombic (P212121; two molecules per asymmetric unit). Since the protein crystallizes in different forms with similar morphology under the same conditions, it was not possible to determine which crystal form was selected for the FMN soaking experiment prior to data collection. The structure was determined via molecular replacement with apoenzyme as the search model using AMoRe (Navaza & Saludjian, 1997). The model was further refined with CNS. A difference electron-density map (|Fo| – |Fc|) showed residual density corresponding to FMN at the active site. The residual density was also seen in the corresponding composite omit map. Accordingly, FMN was built into the electron-density feature and the atomic model refined to convergence. The final atomic model is a dimer related by an NCS twofold (Fig. 3; residues 7–180, one FMN cofactor per protomer and 160 water molecules). Both FMN cofactors have well defined electron density, as shown in Fig. 4, and all φ–ψ values fall within the allowed regions of the Ramachandran diagram (Table 1).
Figure 3.
Ribbon representation of the biological dimer of T1501 with bound FMN (shown as a stick model).
Figure 4.

|Fobs| − |Fcalc| difference electron-density map (contoured at 2.5σ) with the final refined atomic model of FMN.
2.5. Enzyme assays
The protein was assayed for the NADPH-dependent FMN reductase activity in a 100 μl reaction volume containing 100 μM FMN and varying concentrations (5, 7.5 and 10 μM) of enzyme in 20 mM HEPES pH 7.5. The reaction was initiated by addition of 150 μM NADPH. Oxidation of NADPH was measured by the decrease in absorption at 340 nm. A control experiment was performed without the enzyme.
3. Results and discussion
3.1. Sulfur phasing
The crystal structure of this conserved hypothetical protein from P. aeruginosa PA01 was determined by single-wavelength anomalous dispersion sulfur phasing using native crystals (S-SAD). Since the anomalous signal is small in general and especially so for sulfur (f″ = 0.68 at λ = 1.7 Å), it has to be measured accurately by increasing the signal-to-noise ratio. This can be achieved by one of several methods: using high-intensity synchrotron radiation, increasing the redundancy, using narrow oscillation ranges etc. (Rose et al., 2001). However, increasing redundancy and radiation damage may oppose each other (especially with high-intensity radiation) and a careful compromise has to be made during data collection and processing (Garman & Owen, 2006; González, 2003). In addition, high-resolution data (>2 Å) are required for obtaining measurable signals above the noise level to obtain interpretable electron-density maps.
The most important factor to be considered before launching a phasing experiment is to calculate the Bijvoet ratio (ΔFano/F) owing to sulfur. Bijvoet ratios of 0.68% may be useful in phasing diffraction data with the aid of iterative solvent-flattening methods to resolve phase ambiguity (Wang, 1985). We chose to collect data at λ = 1.7 Å for two reasons. This energy range was easily attainable with the X12C beamline and represents the optimum for collecting sulfur diffraction data without significant adverse effects arising from absorption (Kwiatkowski et al., 2000; Weiss, Sicker, Djinovic Carugo et al., 2001; Weiss, Sicker & Hilgenfeld, 2001). With three methionines present in the 193-residue target protein (including the His tag), the calculated Bijvoet ratio is 0.68% (which would be 0.78% with the sulfate ion identified after structure refinement). Although the sulfur anomalous signal from methionine is typically weaker from that of super-sulfur (sulfurs of the disulfide of cystine), we proceeded with the experiment because the diffraction quality of the crystal was extremely good.
As described above, we recorded two diffraction data sets from the same crystal and used them both individually (Set1 and Set2) and merged in combination (Set1-2). All of the expected sulfur positions were obtained with each version of the diffraction data using SOLVE. However, the statistics from Set2 were superior to both Set1 and Set1-2, with those from Set1 being the worst (Table 2). ARP/wARP after SHARP and SOLOMON yielded atomic models for 160, 165 and 164 residues with Set1, Set2 and Set1-2, respectively. The best experimental phases came from Set2. Δφ and electron-density map correlations with respect to the final refined model are given in Table 3.
Table 2.
Statistics of various data sets. Values for the highest resolution shell are given in parentheses.
| Set1 | Set2 | Set 1-2 | |
|---|---|---|---|
| I/σ(I) | 36.8 | 32.7 | 34.8 |
| Redundancy | 12.1 (2.8) | 12.1 (2.8) | 24.1 (5.2) |
| No. of reflections | 16798 | 16787 | 16848 |
| Resolution (Å) | 1.76 | 1.76 | 1.76 |
| Completeness (%) | 83.9 (22.4) | 83.9 (22.4) | 84.1 (23.4) |
Table 3.
SOLVE versus SHELX results for sulfur anomalous phasing.
| Set1 | Set2 | Set1-2 | |
|---|---|---|---|
| Trials with SOLVE | |||
| Resolution cutoff (Å) | 2.5 | 2.5 | 2.5 |
| FOM/Z score | 0.25/11.0 | 0.30/18.3 | 0.23/12.1 |
| Sulfur positions obtained | 4 | 4 | 4 |
| Δφ with final model (°) | 91.6 | 67.2 | 92.0 |
| Trials with SHELX (hkl2map) | |||
| Resolution cutoff (Å) | 2.5 | 2.5 | 2.5 |
| Sulfur positions obtained | 4 | 4 | 4 |
| Pseudo-free CC (%) | 51.3 | 63 | 68.5 |
| Weight | 0.526 | 0.602 | 0.674 |
| Map correlation | 0.759 | 0.814 | 0.878 |
| Connectivity | 0.886 | 0.902 | 0.914 |
| Contrast | 0.391 | 0.501 | 0.531 |
| Δφ with final model (°) | 61.4 | 51.5 | 46.2 |
It is remarkable that Set2 gave better results than Set1, which was recorded first. We had anticipated that radiation damage would affect the accuracy of Set2. While data redundancy improved data quality, merging of Set1 with Set2 to give Set1-2 degraded and compromised the anomalous phasing signal present in Set2. In retrospect, we believe that beam instability contributed to the poor quality of Set1, which was obtained immediately after the beam came up following a beam dump. Indeed, we detected fluctuations in scale factor in the range of 6–8% for oscillation frames recorded during the first 30 min of data collection.
Table 4 presents the results of SOLVE calculations repeated with Set2 using various resolution cutoffs. SOLVE correctly located all four S atoms irrespective of the resolution cutoff, with similar overall figures of merit (0.28–0.30). However, automatic model building with ARP/wARP was not successful for resolution cutoffs worse than 2.20 Å, which may be explained by the observation-to-parameter ratio. We carried out similar calculations with all three data sets with SHELX using the same resolution cutoffs (Schneider & Sheldrick, 2002; Sheldrick, 2002). All SHELXD calculations yielded the requisite four sulfur positions, giving phasing statistics that were best for Set1-2, followed by Set2 and Set1 (Table 3). The increased data redundancy appears beneficial for Set1-2.
Table 4.
The calculations were repeated for various resolution cutoffs on Set2 data. Positions of S atoms were determined using SOLVE; phase refinement took place using SHARP and model building with ARP/wARP.
| Resolution limit (Å) | No. of S atoms from SOLVE | No. of reflections | FOM before/after DM | No. of residues built | Observation/parameter ratio | Connectivity |
|---|---|---|---|---|---|---|
| 1.76 | 4 | 16648 | 0.235/0.947 | 165 | 2.48 | 0.95 |
| 2.00 | 4 | 13484 | 0.308/0.929 | 167 | 2.04 | 0.95 |
| 2.20 | 4 | 10266 | 0.328/0.919 | 167 | 1.60 | 0.94 |
| 2.40 | 4 | 7971 | 0.344/0.917 | 56 | 1.16 | 0.71 |
| 2.50 | 4 | 7081 | 0.342/0.897 | 35 | 1.04 | 0.71 |
| 3.00 | 4 | 4163 | 0.335/0.903 | 33 | 0.61 | 0.62 |
3.2. Automation of model building
Automated model building was attempted using ARP/wARP with phases obtained from SHARP and SHELXE. In both cases we used default parameters. ARP/wARP was successful with SHARP phases after density modification. The phasing statistics were very good for all three data sets with SHELXE. However, the pseudo-free CC was on the borderline. An ideal value for traceability is suggested to be 70%. None of the SHELXE-derived phase sets permitted automated model building of the polypeptide chain with ARP/wARP, although the resulting map was excellent. The electron density was well defined but fragmented. This could be the reason that the automatic tracing of the polypeptide failed. Interestingly, the average phase difference between SHELXE and SHARP (after DM) was 49° for data to 1.76 Å resolution. The quality of the map suggests that the polypeptide chain could be traced in the conventional manner. RESOLVE failed to yield a substantive model of the polypeptide chain with Set1, Set2 or Set1-2. At best, 20–30% of the molecule was produced. With Set2, first we used 2.5 Å resolution data in SOLVE and then extended the phases to 1.76 Å in RESOLVE. The model building was not successful. Representative sections of electron-density maps computed with phases from SHARP, SOLVE, RESOLVE and SHELXE have been deposited as supplementary material1. The quality of the maps suggests that manual model building would have succeeded in case of SOLVE and SHELXE.
3.3. Structure description and comparisons
T1501 has a globular α/β structure with the central five-stranded parallel β-sheet (strands numbered sequentially β2, β1, β3, β4 and β5) flanked by helices α1 and α5 on one side, and α2, α3 and α4 on the other (Fig. 1). This target protein belongs to the flavoprotein superfamily, as it resembles flavodoxin with a three-layer α/β/α structure with a five-stranded parallel β-sheet. A DALI search yielded several hits among the oxidoreductases. The highest match obtained was a Bacillus subtilis hypothetical protein Yhda (azobenzene reductase, azored; PDB code 1nni) with a Z score of 18, followed by yeast YLR011wp (1t0i), rubredoxin:oxygen oxidoreductase (1e5d), quinone reductase (1d4a) and flavodoxin bound to FMN (1rcf). Sequence alignment of 1nni, 1t0i and 1rtt (T1501, apoenzyme) was performed using ClustalW (Thompson et al., 1994) as shown in Fig. 5. Structural alignment of 1nni, 1t0i and 1×77 (T1501, FMN complex) monomers is shown in Fig. 6. The root-mean-square deviation (r.m.s.d.) between 1×77 and 1nni is 1.21 Å for 131 Cα-atom pairs and that between 1×77 and 1t0i is 1.6 Å for 117 Cα-atom pairs. All three protomers share the flavodoxin fold, with the only significant differences arising from the presence of two extended loops in 1t0i owing to insertions of ten and nine residues (Fig. 5). This difference in loop lengths may reflect differences in substrate specificity/binding. 1t0i is a ferric ion reductase (Liger et al., 2004).
Figure 5.
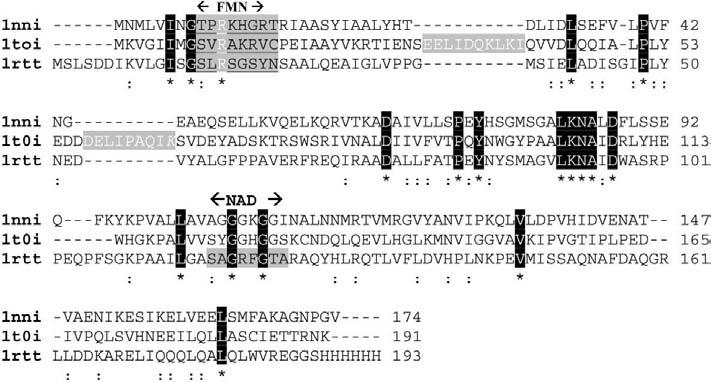
Sequence alignment of P. aeruginosa Q9I4D4 (PDB code 1rtt) with its structural neighbors B. subtilis Yhda (1nni) and yeast YLR011wp (1t0i). Strictly conserved residues are designated with white text on black background and an asterisk; the FMN-binding site is shown with underlined black letters on a grey background and labeled ‘FMN’. Partially conserved residues are indicated with ‘:’. The two insertions in structure 1t0i are shown as white letters on a gray background. The probable NAD(P)H-binding site in 1×77 is shown on a gray background and indicated as ‘NAD’.
Figure 6.

Structural alignment of monomers of 1×77, 1nni and 1t0i shown in red, blue and green, respectively. The FMN molecule in all three is shown only once in yellow. MOLSCRIPT and RASTER3D were used to produce this figure (Kraulis, 1991).
3.4. The FMN-binding site
Sequence analyses of the target protein suggested similarity to NADPH-dependent reductases and NADPH:quinone oxidoreductases. Within the active site of the apoenzyme we found a bound sulfate ion which occupied a phosphate-binding site, as shown for ribityl phosphate in Fig. 7. The electron-density map for the yellow target protein (suggesting the presence of an oxidized flavin ring) failed to show any evidence of the expected FMN cofactor, which may reflect loss during crystal growth at room temperature in the absence of added ligand. Structural analysis of the apoenzyme documented the presence of a large pocket which could accommodate either an FMN or an FAD. An apoenzyme crystal-soaking experiment revealed the presence of FMN in the pocket, with sulfate ion replaced by the ribityl phosphate ion. The cofactor binds to the C-terminal end of the central β-sheet within a positively charged pocket (data not shown). A molecular surface drawing of the dimer with bound FMNs is shown in Fig. 7. The phosphoribityl group of the FMN is deeply buried, although the isoalloxazine ring is partially exposed to the solvent. FMN makes interactions with both protomers.
Figure 7.
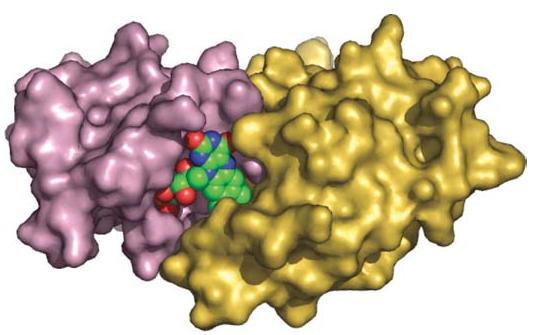
A surface drawing of the target T1501 dimer with FMN, shown as a hard-sphere representation. The isoalloxazine ring of FMN interacting with both monomers is exposed to solvent, where it can interact with NAD(P)H and substrate. Figs. 1, 3 and 7 were prepared using PyMOL (DeLano, 2002).
It is remarkable that this target protein does not bear the commonly found flavodoxin key fingerprint motif (T/SXTGXT), yet still binds the FMN phosphate (via the GSLRSGSYN loop; amino acids 14–22). A BLAST search shows that Ser15, Arg17 and Ser20 are conserved in this family of proteins, suggesting they will make similar interactions with FMN. The sulfate group in the apoenzyme and the FMN phosphate participate in hydrogen bonds with the side chains of Ser15, Arg17, Ser20 and Asn22 (Fig. 8). The isoalloxaxine ring O4 interacts with the backbone amino groups of Asn84 and Tyr85 and O2 interacts with a water molecule, which in turn interacts with the backbone amino groups of Arg120 and Phe121. N5 of the isoalloxazine ring interacts with Asn84 N. The ribityl O2* of FMN interacts with a water molecule, which is stabilized by Glu82 N and Ala116 O. The major stabilization of the FMN molecule occurs via the ribityl phosphate and the isoalloxazine ring. N5 and N2 of FMN are the groups which are the probable sites for accepting electrons from NADPH.
Figure 8.

FMN interaction at the active site of T1501. FMN is shown in magenta and protein residues in yellow; dashed lines represent hydrogen bonds (this figure was prepared with MOLSCRIPT and RASTER3D; Kraulis, 1991).
3.5. Structural changes in the enzyme owing to cofactor binding
The r.m.s.d. between 1rtt and a 1×77 monomer is ∼0.64 Å; the r.m.s.d. between the two monomers of 1×77 is ∼0.60 Å. In our apoenzyme structure, the phosphate-binding site is well formed and occupied by a sulfate anion, as seen for apo flavodoxin from Anabaena (Genzor et al., 1996). However, in the apoenzyme the isoalloxine ring and ribityl chain-binding sites were constricted and are partially occupied by the side chains of Tyr85, Arg125 and Tyr21. The side chains of Tyr21, Arg125 and Tyr128 reorient upon FMN binding. Movement of Cα atoms was observed for resides 119–122 (the Cα-position shifts for of 119, 121 and 122 are 2.67, 1.69 and 3.12 Å, respectively).
3.6. T1501 forms a dimer in both structures
Crystals of both the apoenzyme (I222 form) and holoenzyme in complex with FMN (P212121 form) revealed pairs of molecules forming the same kind of dimer, related by twofold symmetry. While the twofold symmetry is crystallographic symmetry parallel to the c axis in the I222 form, it is via an NCS twofold in the P212121 form. Each dimer has two equivalent catalytic sites, which are formed by parts of both monomers, present at the dimer interface (Fig. 3). The solvent-accessible surface area buried on dimer formation is ∼2560 Å2 (>14%), suggesting that the crystallographically observed dimer may be biologically relevant. This observation is analogous to that for the recently reported structure of NADPH-dependent FMN reductase from yeast YLR011wp (PDB code 1t0i). Such dimers are thought to be uncommon in most flavodoxin-related proteins (Liger et al., 2004). However, some of the flavodoxins, such as Saccharomyces cerevisiae Ycp4 (Toda et al., 1992) and Desulfovibrio gigas rubredoxin-oxygen reductase (Frazao et al., 2000) exist as dimers.
3.7. Catalysis: T1501 is an NADPH-dependent FMN reductase
Our target crystal structure of the holoenzyme confirms that the protein is an FMN-containing enzyme belonging to the flavodoxin family. Biochemical assays have documented the T1501-dependent oxidation of NADPH and NADPH dependence (Fig. 9).
Figure 9.
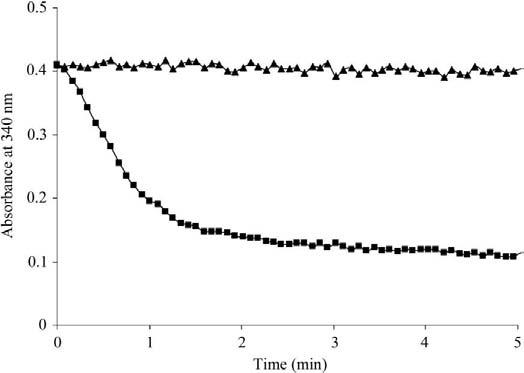
NAD(P)H-FMN reductase activity of T1501. 150 μM NADPH was added in a mixture of 10 μm enzyme containing 100 μM FMN at room temperature and oxidization of NAD(P)H was followed and recorded at 340 nm for 5 min. With 5 and 7.5 mM enzyme concentrations, the absorbance decreased to 0.3 and 0.25, respectively (data not shown). Triangles and squares represent the control and the actual experiment, respectively.
FMN reductases catalyze a two-step reaction.
- E-FMN + NADPH↔E-FMN-NADPH
- E-FMN-NADPH + H+↔E-FMNH2 + NAD(P)+
- E-FMNH2 + substrate↔E-FMNH2-substrate
- E-FMNH2-substrate↔E-FMN + product.
The catalytic site of the protein can be divided into three functional regions: one for FMN binding, a second for interaction with the adenine ribose portion of NADPH and the third for binding either the nicotinamide ring of NADPH or the substrate. Overlap of hydride donor and acceptor sites is a common feature of oxidoreductases with a ping-pong kinetic mechanism. The structure of rat liver quinone reductase-bound NADP+ provides some useful insights into NADPH binding and electron transfer (PDB code 1qrd; Li et al., 1995). In this case, the nicotinamide of NADP+ and ring C of the isoalloxazine make a π–π stacking interaction, with an average interplanar distance of about 3.4 Å.
Large Cα displacements of about 2.7 Å in the loop responsible for binding NAD(P)H have been observed in some oxidoreductases (Faig et al., 2000). This finding probably explains our inability to prepare cocrystals of our target protein with NADPH via simple crystal soaking, as the crystals crack owing to the large movement of this loop region. As the protein is NADPH-dependent, it has to bind to the enzyme first to donate electrons to the N2/N5 (of isoalloxazine) through parallel stacking of nicotinamide on the isoalloxazine ring, probably similar to the case in 1qrd. However, the binding of the remaining adenosine part of the NAD may be different from that of 1qrd since the NADPH adenosine part has been found to bind in various conformations to specific proteins. The sequence TTGGSGS has been suggested to be the part of the NADPH-binding site (Liu et al., 1989; Ma et al., 1992; Prochaska, 1988). A similar though not identical sequence motif has been identified in this family and the putative binding site is shown in Fig. 5 as the NAD site (probable NADPH-binding site). This site is in close proximity to the isoalloxazine ring of FMN in the structure of 1×77 and probably plays a role in interacting with the nicotinamide ring. The variation of residues present at the interface of the probable nicotinamide ring with the isoalloxazine ring-binding domain in various oxidoreductases possibly serves as the basis of substrate selectivity.
Thus far, we have not attempted to identify biological substrate(s) for T1501. However, its close structural similarity to 1nni, a probable azobezene reductase, suggests that T1501 acts on compound(s) resembling azobenzene.
4. Conclusion
In summary, we have successfully employed a less common strategy for structure determination using long-wavelength radiation for X-ray diffraction measurements of anomalous signals from S atoms, with the attendant needs for a high signal-to-noise ratio and high data redundancy. The homodimeric target protein T1501 proved to be a member of the flavodoxin family that uses an unusual GSLRSGSYN sequence for FMN binding instead of the canonical flavodoxin key fingerprint motif (T/S)XTGXT. Initial functional characterization has documented that the protein is an NADPH-dependent reductase which utilizes FMN as a cofactor. Scientists interested in obtaining reagents with which to perform additional functional and mechanistic studies can request them from the senior author at swami@bnl.gov.
Supplementary Material
Footnotes
PDB References: T1501, 1rtt, r1rttsf; complex with FMN, 1×77, r1×77sf.
Supplementary material has been deposited in the IUCr electronic archive (Reference DZ5059). Services for accessing this material are described at the back of the journal.
Research was supported by NIH grant GM62529 under DOE Prime Contract No. DEAC02-98CH10886 with the Brookhaven National Laboratory.
References
- Benson AM, Hunkeler MJ, Talalay P. Proc. Natl Acad. Sci. USA. 1980;77:5216–5220. doi: 10.1073/pnas.77.9.5216. [DOI] [PMC free article] [PubMed] [Google Scholar]
- Brünger AT, Adams PD, Clore GM, DeLano WL, Gros P, Grosse-Kunstleve RW, Jiang J-S, Kuszwewski J, Nilges M, Pannu NS, Read RJ, Rice LM, Simonson T, Warren GL. Acta Cryst. 1998;D54:905–921. doi: 10.1107/s0907444998003254. [DOI] [PubMed] [Google Scholar]
- Collaborative Computational Project Acta Cryst. 1994;D50:760–763. Number 4. [Google Scholar]
- Dauter Z, Dauter M, de La Fortelle E, Bricogne G, Sheldrick GM. J. Mol. Biol. 1999;289:83–92. doi: 10.1006/jmbi.1999.2743. [DOI] [PubMed] [Google Scholar]
- Debreczeni JÉ, Bunkoczi G, Girmann B, Sheldrick GM. Acta Cryst. 2003;D59:393–395. doi: 10.1107/s0907444902020917. [DOI] [PubMed] [Google Scholar]
- Debreczeni JÉ, Bunkoczi G, Ma Q, Blaser H, Sheldrick GM. Acta Cryst. 2003;D59:688–696. doi: 10.1107/s0907444903002646. [DOI] [PubMed] [Google Scholar]
- Debreczeni JÉ, Girmann B, Zeeck A, Kratzner R, Sheldrick GM. Acta Cryst. 2003;D59:2125–2132. doi: 10.1107/s0907444903018973. [DOI] [PubMed] [Google Scholar]
- DeLano WL. The PyMOL User's Manual. DeLano Scientific; San Carlos, CA, USA: 2002. [Google Scholar]
- Ernster L, Navazio F. Biochim. Biophys. Acta. 1957;26:408–415. doi: 10.1016/0006-3002(57)90023-9. [DOI] [PubMed] [Google Scholar]
- Faig M, Bianchet MA, Talalay P, Chen S, Winski S, Ross D, Amzel LM. Proc. Natl Acad. Sci. USA. 2000;97:3177–3182. doi: 10.1073/pnas.050585797. [DOI] [PMC free article] [PubMed] [Google Scholar]
- Frazao C, Silva G, Gomes CM, Matias P, Coelho R, Sieker L, Macedo S, Liu MY, Oliveira S, Teixeira M, Xavier AV, Rodrigues-Pousada C, Carrondo MA, Le Gall J. Nature Struct. Biol. 2000;7:1041–1045. doi: 10.1038/80961. [DOI] [PubMed] [Google Scholar]
- Garman EF, Owen RL. Acta Cryst. 2006;D62:32–47. doi: 10.1107/S0907444905034207. [DOI] [PubMed] [Google Scholar]
- Genzor CG, Perales-Alcon A, Sancho J, Romero A. Nature Struct. Biol. 1996;3:329–332. doi: 10.1038/nsb0496-329. [DOI] [PubMed] [Google Scholar]
- González A. Acta Cryst. 2003;D59:1935–1942. [Google Scholar]
- Greenwald J, Fischer WH, Vale WW, Choe S. Nature Struct. Biol. 1999;6:18–22. doi: 10.1038/4887. [DOI] [PubMed] [Google Scholar]
- Hendrickson WA, Teeter MM. Nature (London) 1981;290:107–113. doi: 10.1038/290107a0. [DOI] [PMC free article] [PubMed] [Google Scholar]
- Jones TA, Zou J, Cowtan SW, Kjeldgaard M. Acta Cryst. 1991;A47:110–119. doi: 10.1107/s0108767390010224. [DOI] [PubMed] [Google Scholar]
- Kraulis PJ. J. Appl. Cryst. 1991;24:946–950. [Google Scholar]
- Kwiatkowski W, Noel JP, Choe S. J. Appl. Cryst. 2000;33:876–881. [Google Scholar]
- La Fortelle E. de, Bricogne G. Methods Enzymol. 1997;276:472–493. doi: 10.1016/S0076-6879(97)76073-7. [DOI] [PubMed] [Google Scholar]
- Laskowski RA, MacArthur MW, Moss DS, Thornton JM. J. Appl. Cryst. 1993;26:283–291. [Google Scholar]
- Li R, Bianchet MA, Talalay P, Amzel LM. Proc. Natl Acad. Sci. USA. 1995;92:8846–8850. doi: 10.1073/pnas.92.19.8846. [DOI] [PMC free article] [PubMed] [Google Scholar]
- Liger D, Graille M, Zhou CZ, Leulliot N, Quevillon-Cheruel S, Blondeau K, Janin J, van Tilbeurgh H. J. Biol. Chem. 2004;279:34890–34897. doi: 10.1074/jbc.M405404200. [DOI] [PubMed] [Google Scholar]
- Liu XF, Yuan H, Haniu M, Iyanagi T, Shively JE, Chen SA. Mol. Pharmacol. 1989;35:818–822. [PubMed] [Google Scholar]
- Ma Q, Cui K, Xiao F, Lu AY, Yang CS. J. Biol. Chem. 1992;279:34890–34897. [PubMed] [Google Scholar]
- Navaza J, Saludjian P. Methods Enzymol. 1997;276:581–594. doi: 10.1016/S0076-6879(97)76079-8. [DOI] [PubMed] [Google Scholar]
- Olsen JG, Flensburg C, Olsen O, Bricogne G, Henriksen A. Acta Cryst. 2004;D60:250–255. doi: 10.1107/S0907444903025927. [DOI] [PubMed] [Google Scholar]
- Otwinowski Z, Minor W. Methods Enzymol. 1997;276:307–326. doi: 10.1016/S0076-6879(97)76066-X. [DOI] [PubMed] [Google Scholar]
- Perrakis A, Morris R, Lamzin VS. Nature Struct. Biol. 1999;6:458–463. doi: 10.1038/8263. [DOI] [PubMed] [Google Scholar]
- Prochaska HJ. Arch. Biochem. Biophys. 1988;267:529–538. doi: 10.1016/0003-9861(88)90060-4. [DOI] [PubMed] [Google Scholar]
- Ramagopal UA, Dauter M, Dauter Z. Acta Cryst. 2003;D59:1020–1027. doi: 10.1107/s0907444903007467. [DOI] [PubMed] [Google Scholar]
- Rose JP, Wu C-K, Liu Z-J, Newton G, Wang B-C. Rigaku J. 2001;18:4–12. [Google Scholar]
- Schneider TR, Sheldrick GM. Acta Cryst. 2002;D58:1772–1779. doi: 10.1107/s0907444902011678. [DOI] [PubMed] [Google Scholar]
- Sheldrick GM. Z. Kristallogr. 2002;217:644–650. [Google Scholar]
- Simondsen RP, Tollin G. Mol. Cell. Biochem. 1980;33:13–24. doi: 10.1007/BF00224568. [DOI] [PubMed] [Google Scholar]
- Terwilliger TC, Berendzen J. Acta Cryst. 1999;D55:849–861. doi: 10.1107/S0907444999000839. [DOI] [PMC free article] [PubMed] [Google Scholar]
- Thompson JD, Higgins DG, Gibson TJ. Nucleic Acids Res. 1994;22:4673–4680. doi: 10.1093/nar/22.22.4673. [DOI] [PMC free article] [PubMed] [Google Scholar]
- Toda T, Shimanuki M, Saka Y, Yamano H, Adachi Y, Shirakawa M, Kyogoku Y, Yanagida M. Mol. Cell. Biol. 1992;12:5474–5484. doi: 10.1128/mcb.12.12.5474. [DOI] [PMC free article] [PubMed] [Google Scholar]
- Wang B-C. Methods Enzymol. 1985;115:90–106. doi: 10.1016/0076-6879(85)15009-3. [DOI] [PubMed] [Google Scholar]
- Weiss MS, Sicker T, Djinovic Carugo K, Hilgenfeld R. Acta Cryst. 2001;D57:689–695. doi: 10.1107/s0907444901003572. [DOI] [PubMed] [Google Scholar]
- Weiss MS, Sicker T, Hilgenfeld R. Structure. 2001;9:771–777. doi: 10.1016/s0969-2126(01)00647-5. [DOI] [PubMed] [Google Scholar]
Associated Data
This section collects any data citations, data availability statements, or supplementary materials included in this article.