Abstract
The bacterial population of a graywater treatment system was monitored over the course of 100 days, along with several wastewater biochemical parameters. The graywater treatment system employed an 1,800-liter membrane bioreactor (MBR) to process the waste, with essentially 100% recycling of the biomass. Graywater feed consisting of 10% galley water and 90% laundry water, selected to approximate the graywater composition on board U.S. Navy ships, was collected offsite. Five-day biological oxygen demand (BOD5), oils and greases (O/G), nitrogen, and phosphorus were monitored in the feed and were found to vary greatly day to day. Changes in the bacterial population were monitored by PCR amplification of region 332 to 518 (Escherichia coli numbering) of the 16S rRNA gene and denaturing gradient gel electrophoresis (DGGE) analysis of the resultant PCR products. DGGE analysis indicated a diverse and unstable bacterial population throughout the 100-day period, with spikes in feed strength causing significant changes in community structure. Long-term similarity between the communities was 0 to 25%, depending on the method of analysis. In spite of the unstable bacterial population, the MBR system was able to meet effluent quality parameters approximately 90% of the time.
With increasing regulation of coastal and other sensitive aquatic environments, dealing with shipboard wastewater will become more problematic. In order to address the likelihood of regulations restricting wastewater discharge, the U.S. Navy is developing membrane bioreactors (MBRs) for graywater treatment for eventual shipboard installation. Graywater is the waste from showers, sinks, laundry, the kitchen, and deck washing. It contains soaps and detergents, food waste, oils and greases (O/G), and other organic and inorganic materials dissolved or suspended in water and makes up approximately 90% of the non-oily (nonbilge) wastewater on U.S. Navy ships. The much lower volume of blackwater (sewage) is typically plumbed and dealt with separately from graywater on Navy vessels.
With an MBR, in contrast with a more typical bioreactor or activated sludge process, essentially 100% of the biomass is retained, with only the treated effluent being discharged. A much higher biomass loading is possible with this design, such that less space is required for a given treatment volume (11). This is clearly advantageous in small areas, as on board ships. The higher biomass loading also increases shock tolerance, which is particularly important where feed is highly variable (24). MBRs have a longer suspended solids retention time. This increases endogenous (autolytic) metabolism of the biomass (13) and allows development of predatory and grazing communities, with the accompanying trophic-level energy losses (1, 9). These factors result in lower overall sludge production and higher mineralization efficiency than those of a conventional activated sludge process.
In addition, MBRs for wastewater treatment effectively eliminate suspended solids (24) and fecal coliforms and fecal streptococci (20, 21) and reduce (102- to 106-fold) viral concentrations (21) in the effluent. Overall, MBRs have significant advantages over conventional wastewater treatment under those conditions in which space considerations, variable feed characteristics, minimization of sludge production, and/or low biohazard potential of the treated effluent are important. All of these factors are important on board U.S. Navy ships.
In the graywater bioreactors, the influent parameters affecting bioreactor community are the five-day biochemical oxygen demand (BOD5), solids, O/G, pH, nutrient ratios (C/N/P), and availability of terminal electron acceptors. Organic materials (food waste, detergents, etc.) are degraded by bacterial biomass, reducing the BOD5 from >1,000 mg · liter−1 to ≤50 mg · liter−1, when properly operating. A unique problem with MBRs is the potential for membranes (the critical component) to be fouled with O/G, biofouling bacteria, and biological polymers (e.g., exopolysaccharides). A graywater bacterial community is desired that can degrade O/G and other organic matter, thus reducing BOD, while causing minimal biofouling. In this way, the bacterial community affects effluent quality and processing throughput, the main operational parameters for a graywater MBR (GMBR).
The goal of this research was to gain an understanding of the changes in bacterial population structure over time in GMBRs, especially considering the highly variable feed composition. Included in this goal was determining whether bioreactor performance could be credited to particular populations of bacteria, or whether populations of differing composition could provide equivalent performance. Population changes were monitored by denaturing gradient gel electrophoresis (DGGE) of PCR-amplified 16S rRNA gene (rDNA) fragments. This technique has been successful for monitoring such changes in complex communities (3-5, 14, 17, 18, 22).
MATERIALS AND METHODS
MBR.
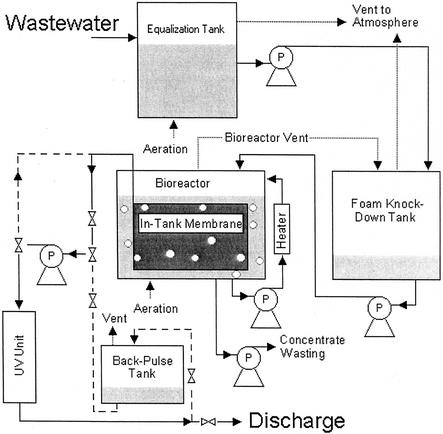
The GMBR employed in this study was part of a larger design process for development of non-oily wastewater treatment systems for U.S. Navy ships. The schematic for the GMBR is shown in Fig. 1. Very briefly, the system consisted of an 1,800-liter (working volume) tank, a 0.4-μm-pore-diameter membrane, pumps for feed and aeration, a UV disinfection unit for effluent treatment, sensors, and computer controls. This system provides for essentially 100% biomass/solids retention, producing a clear effluent. Graywater was fed at a rate of 380 liters · day−1 and consisted of 10% (vol/vol) galley water and 90% (vol/vol) laundry water, trucked in and mixed on-site. This GMBR was sampled from 13 May 2000 to 21 August 2000.
FIG. 1.
Schematic of the GMBR employed in this study. Items marked “P” are pumps, and hourglass-shaped items are valves. Dotted lines represent aeration or venting, while dashed lines represent intermittent or alternate pathways.
Sampling.
The GMBR was sampled periodically throughout a 100-day (14-week) period, with more frequent sampling during the first 2 weeks. Samples for PCR-DGGE were centrifuged and resuspended in 100 mM phosphate buffer (93 mM Na2HPO4, 7 mM NaH2PO4) containing 5% sodium dodecyl sulfate (SDS) (lysis buffer), and stored at −20°C until processed. Samples for BOD5, O/G, total Kjeldahl nitrogen (TKN), total phosphorus (TP), and volatile suspended solids (VSS) were taken more frequently (3 to 5 times · week−1) and sent out for analysis by Martel Industries (Baltimore, Md.). VSS, a measure of biomass, was only determined for the GMBR contents. TKN and TP were determined only for the feed and the effluent. O/G was measured in the feed and GMBR contents, and BOD5 was measured for the feed, contents, and effluent.
PCR amplification of community DNAs.
Genomic DNA from the biomass was extracted and purified from the GMBR samples by bead beating the lysis buffer-stored samples, and solid-phase extraction using a FastDNA SPIN kit (for soil) (Bio 101, Carlsbad, Calif.). The V-3 region (positions 332 to 518 according to the Escherichia coli numbering) of bacterial 16S rDNA was amplified by PCR. In order to determine the repeatability of the methodology, replicate (four times) community genomic DNA samples were extracted and amplified by PCR in parallel. Approximately 200 ng of template DNA, determined by agarose gel electrophoresis (as described below), was added for each PCR (50 μl). Several pure cultures were isolated from the MBR by streaking on filter-sterilized graywater solidified with 1.2% agar. DNA from these pure cultures was purified and PCR amplified, but less template DNA (∼50 ng) was provided for the PCR. The PCR products from several of these pure cultures were empirically chosen to provide convenient placement or spacing markers for DGGE, as described below. Identification of these cultures was beyond the scope of this investigation. The size, purity, and amount of PCR products were verified by agarose (1% [wt/vol]) gel electrophoresis with a 1-kb DNA ladder as size standards (Sigma, St. Louis, Mo.).
The PCR contained 0.3 U of either Taq polymerase (Promega, Madison, Wis.) or JumpStart Taq polymerase (Sigma-Aldrich, St. Louis, Mo.), the appropriate 1× PCR buffer (Promega or Sigma-Aldrich), 3.5 mM MgCl2, 0.1% bovine serum albumin, 0.2 mM deoxynucleoside triphosphates (dNTPs), and 8 μM each forward and reverse primers. The forward primer sequence, not including the 40-nucleotide GC clamp (16) on the 5′ end, was 5′-CCTACGGGAGGCAGCAG-3′. The reverse primer was 5′-ATTACCGCGGCTGG-3′ (15). Both primers were obtained from Integrated DNA Technologies (Coralville, Iowa). Cycling was provided by a GeneAmp 9700 (PE Applied Biosystems, Foster City, Calif.) thermal cycler with a temperature program of 5 min at 94°C for initial DNA denaturing; 30 cycles of 30 s each at 92°C (DNA denaturation), 55°C (primer annealing), and 74°C (primer elongation); and 7 min at 72°C for final elongation.
DGGE analyses.
The PCR-amplified DNA fragments were separated on polyacrylamide gels (8%, 38:1 acrylamide-bisacrylamide) with a 30 to 55% linear gradient of denaturant (100% denaturant = 40% [vol/vol] formamide plus 42% [wt/vol] urea). Gels were run for 15 min at 25 V and 6 h at 200 V in 1× TAE buffer maintained at 60°C. Denaturing gradient gels were poured and run by using the DCode Universal Mutation Detection System (Bio-Rad, Hercules, Calif.).
Gels were stained for 10 min with SYBR green (5 μl in 25 ml of 1× TAE; Sigma) and visualized by UV illumination (254 nm), and the gel images were acquired by using the ChemDoc (Bio-Rad) gel documentation system. Quantity One 4.1.0 software (Bio-Rad) was used for band pattern analysis. Lanes and bands were applied to the image of the gel by the software, with additional manual fine-tuning of the band designations, using the banding pattern from several pure culture isolates as migration standards. Dendrograms relating band pattern similarities were automatically calculated with the Dice coefficient, without band weighting (consideration of band density) by both the complete linkage and unweighted pair group method with arithmetic mean (UPGMA) algorithms in the Quantity One software.
Relative band densities were calculated by the software; the densities were necessary for determining the Shannon diversity index (SDI). Raw, manually adjusted peak areas were used, because Gaussian peak modeling by Quantity One missed some of the smaller peaks. As described by Eichner et al. (5), the SDI (H′, equation 1) was calculated with each band corresponding to a single species, and that band density was equivalent to species abundance; where pi is the proportion of the community that is made up of species i (brightness of band i/total brightness of all bands in the lane). The equitability index (EI), an indication of the evenness of species distribution, was also determined. The EI (equation 2) is the SDI (H′) divided by the maximum potential diversity, where ni is the total number of species in the sample. The EI, unlike the SDI, has a maximum value of 1.0, which would indicate completely even species distribution (e.g., 10 species, each at 10% abundance):
 |
(1) |
 |
(2) |
RESULTS AND DISCUSSION
Physical and chemical analyses.
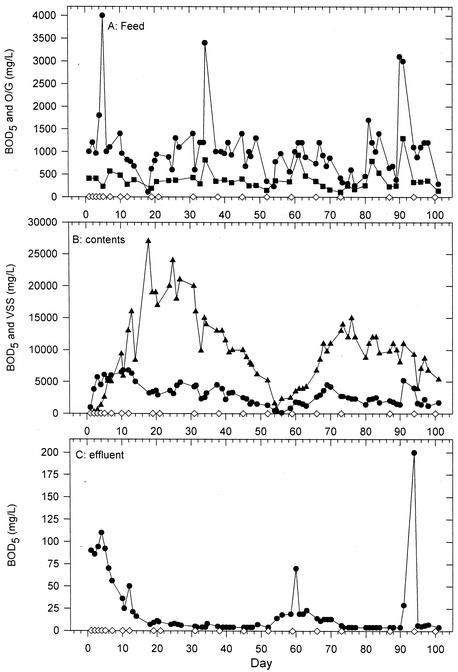
Figure 2 shows the data for the GMBR feed (Fig. 2A), contents (Fig. 2B), and effluent (Fig. 2C). TKN and TP were typically within the same order of magnitude of each other, ranging from 5 to 50 mg · liter−1 in the feed and 1 to 10 mg · liter−1 in the effluent (data not shown). O/G in the GMBR contents varied widely from 2 to 1,500 mg · liter−1, with no correlation with the O/G concentration in the feed (data not shown). The target goal for total solids, most of which is VSS/biomass, was 2%. This goal was not maintained from days 30 to 54, because of a miscalculated biomass-wasting rate, amounting to a nearly complete loss of biomass and a system restart by day 54.
FIG. 2.
Select parameters measured in the GMBR feed (A), contents (B), and effluent (C) over the 100-day time course. The BOD5 (•), O/G (▪; feed only), and VSS (▴; contents only) parameters are shown. DGGE sample points (⋄) are also shown.
Based on a histogram analysis (not shown), the BOD in the feed fluctuated from 700 to 1,200 mg · liter−1 for the majority of the run of this bioreactor, and those values >2,000 mg · liter−1 did not fit the normal distribution of the remainder of the BOD5 data. Leaving out the outlier values, the BOD of the feed averaged 902 ± 354 mg · liter−1, with a median of 950 mg · liter−1. The spikes in feed BOD5 of ≥2,000 mg · liter−1 were associated with changes in the bacterial community of the bioreactor, as determined by DGGE analysis.
DGGE analyses.
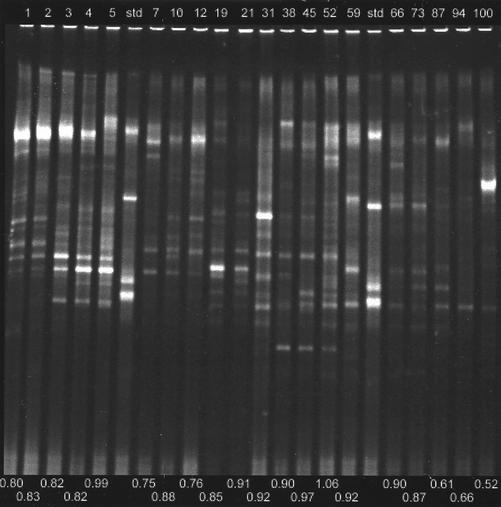
Figure 3 shows the DGGE banding patterns of the graywater community over a 100-day time course. Analyses of these patterns were based on unweighted bands. When band weighting was applied in the analyses, the resolution especially between lower-similarity clusters was lost, with additional clusters branching at 0% similarity. Largely for this empirical reason, but also because of the limitations of PCR amplification of unknown populations (2, 6, 15, 19), band weighting was not used for the similarity analyses. Since at any given time point there would be different populations of target DNAs, the relative amplification efficiency of each target could change. This means that equal proportions of a given target in different samples might be amplified to a different degree and that final proportions of PCR-amplified fragments would not correspond to the initial proportions of the PCR target. In fact, DNA clone frequency and DGGE band intensity have been found not to be in agreement (12).
FIG. 3.
DGGE of PCR-amplified region 338 to 518 of 16S rDNA from the GMBR bacterial community. Lane labels along the top show sampling time (days) from startup of the bioreactor and migration standards (std). Values along the bottom indicate the SDI.
Some difficulties were encountered in analyzing the DGGE banding patterns, particularly involving assigning bands to matched sets, even though migration standards near each end of the gel provided guidelines for band matching. Because of the complexity of the samples (37 assigned sets of bands across all samples [see Fig. 6]), the decision to allocate certain bands to a particular set was not always clear-cut. In spite of some ambiguity, slightly different band pattern matches generally resulted in dendrogram pattern changes that were smaller than the differences between similarity algorithms (data not shown). Control experiments designed to establish the repeatability of the DNA extraction and PCR amplification found a 90 to 95% similarity in replicate (four times) samples, as determined by analysis of the DGGE patterns (data not shown).
FIG. 6.
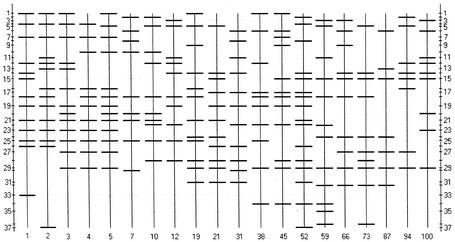
Schematic of overall DGGE banding patterns showing band number (side bars) at each sample time point (bottom).
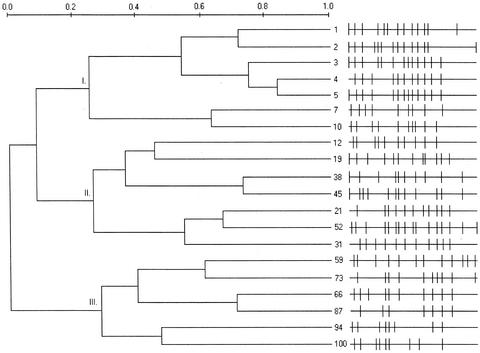
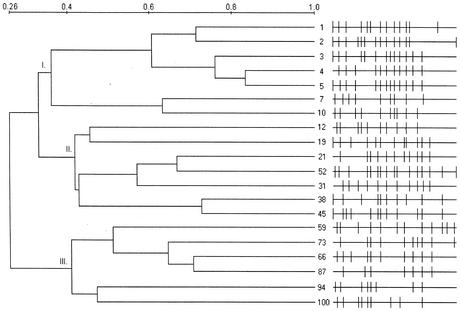
Banding pattern similarity was analyzed by applying either the complete linkage (Fig. 4) or UPGMA (Fig. 5) algorithms. The complete linkage algorithm is good for identifying outlier clusters and showed three groups with intragroup similarity at approximately 25 to 30% and intergroup similarity at 0 to 10%. The UPGMA analysis found higher intergroup (26%) and intragroup (35 to 43%) similarities. UPGMA analysis is affected the least by outlier samples, thus contrasting with complete linkage. Both algorithms showed a closer clustering of groups I and II and had similar overall clustering patterns. Generally, the clustering followed the time course, with no “jumping” of a sample out of any of the three major groups. Small differences in the patterns existed between the UPGMA and complete linkage analyses, however, especially between the group II clusters. The group II clustering more closely follows the time course in the UPGMA analysis (Fig. 5) than it does in the complete linkage analysis (Fig. 4). In both analyses, group I was associated with startup conditions, group II with stable bioreactor functioning, and group III with the system restart on day 54.
FIG. 4.
Complete linkage analysis dendrogram of graywater bacterial community DGGE fingerprints, showing schematics of banding patterns. Numbers show the sample time (days), and Roman numerals indicate major clusters.
FIG. 5.
UPGMA analysis dendrograms of graywater bacterial community DGGE banding patterns, showing schematics of banding patterns. Arabic numerals show the sample time (days), and Roman numerals indicate major clusters.
Population shifts and physical parameters.
Population shifts seen in the DGGE similarity analysis were associated with changes in the feed. Most evident were changes apparently brought about by BOD5 changes. Since the community changes of main interest were short term and the majority of the 100-day period was covered by samples taken at 7-day intervals, this 7-day similarity is the main basis of comparison. Using only those 7-day similarity values not associated with special conditions (i.e., BOD5 spike), the average similarity for samples taken 7 days from each other was 57.8% ± 10.4% (days 12 to 19, 38 to 45, 45 to 52, 59 to 66, 66 to 73, and 94 to 100 [6 days]) (Table 1). Those changes associated with a BOD5 spike or the wasting/restart (described below) averaged 36.7% ± 2.1% similarity (days 3 to 10, 5 to 12, 31 to 38, 52 to 59, and 87 to 94) (Table 1). A t test found the samples associated with a BOD5 spike to be significantly different (P > 0.975) from the remainder of the samples taken 7 days apart. In contrast with the effect of high BOD5 values, low BOD5 values (<500 mg · liter−1) were not correlated with large changes in community structure.
TABLE 1.
Similarity and dissimilarity matricesa for the 100-day time course
| % Dissimilarity | % Similarity (Dice coefficient)
|
|||||||||||||||||||
|---|---|---|---|---|---|---|---|---|---|---|---|---|---|---|---|---|---|---|---|---|
| 1 | 2 | 3 | 4 | 5 | 7 | 10 | 12 | 19 | 21 | 31 | 38 | 45 | 52 | 59 | 66 | 73 | 87 | 94 | 100 | |
| 1 | 74.1 | 61.5 | 58.3 | 53.8 | 27.3 | 34.8 | 43.5 | 40.0 | 41.7 | 25.0 | 43.5 | 40.0 | 48.3 | 16.0 | 26.1 | 26.1 | 10.0 | 28.6 | 36.4 | |
| 2 | 25.9 | 74.1 | 64.0 | 59.3 | 26.1 | 33.3 | 41.7 | 38.5 | 24.0 | 24.0 | 41.7 | 30.8 | 40.0 | 15.4 | 8.3 | 8.3 | 9.5 | 18.2 | 26.1 | |
| 3 | 38.5 | 25.9 | 75.0 | 76.9 | 27.3 | 34.8 | 26.1 | 40.0 | 25.0 | 8.3 | 43.5 | 32.0 | 27.6 | 8.0 | 17.4 | 17.4 | 30.0 | 38.1 | 36.4 | |
| 4 | 41.7 | 36.0 | 25.0 | 83.3 | 40.0 | 38.1 | 28.6 | 43.5 | 27.3 | 9.1 | 38.1 | 34.8 | 37.0 | 17.4 | 28.6 | 28.6 | 22.2 | 31.6 | 20.0 | |
| 5 | 46.2 | 40.7 | 23.1 | 16.7 | 45.5 | 52.2 | 34.8 | 56.0 | 33.3 | 8.3 | 43.5 | 40.0 | 27.6 | 24.0 | 26.1 | 34.8 | 20.0 | 38.1 | 27.3 | |
| 7 | 72.7 | 73.9 | 72.7 | 60.0 | 54.5 | 63.2 | 21.1 | 28.6 | 10.0 | 30.0 | 31.6 | 19.0 | 32.0 | 9.5 | 21.1 | 10.5 | 12.5 | 11.8 | 22.2 | |
| 10 | 65.2 | 66.7 | 65.2 | 61.9 | 47.8 | 36.8 | 60.0 | 45.5 | 28.6 | 19.0 | 40.0 | 27.3 | 38.5 | 27.3 | 10.0 | 30.0 | 0.0 | 33.3 | 21.1 | |
| 12 | 56.5 | 58.3 | 73.9 | 71.4 | 65.2 | 78.9 | 40.0 | 45.5 | 38.1 | 47.6 | 50.0 | 36.4 | 38.5 | 45.5 | 30.0 | 40.0 | 0.0 | 33.3 | 42.1 | |
| 19 | 60.0 | 61.5 | 60.0 | 56.5 | 44.0 | 71.4 | 54.5 | 54.5 | 60.9 | 26.1 | 36.4 | 41.7 | 42.9 | 33.3 | 45.5 | 54.5 | 21.1 | 40.0 | 19.0 | |
| 21 | 58.3 | 76.0 | 75.0 | 72.7 | 66.7 | 90.0 | 71.4 | 61.9 | 39.1 | 54.5 | 28.6 | 43.5 | 66.7 | 34.8 | 38.1 | 57.1 | 33.3 | 42.1 | 30.0 | |
| 31 | 75.0 | 76.0 | 91.7 | 90.9 | 91.7 | 70.0 | 81.0 | 52.4 | 73.9 | 45.5 | 38.1 | 43.5 | 59.3 | 17.4 | 19.0 | 19.0 | 11.1 | 10.5 | 30.0 | |
| 38 | 56.5 | 58.3 | 56.5 | 61.9 | 56.5 | 68.4 | 60.0 | 50.0 | 63.6 | 71.4 | 61.9 | 72.7 | 46.2 | 36.4 | 30.0 | 20.0 | 23.5 | 22.2 | 31.6 | |
| 45 | 60.0 | 69.2 | 68.0 | 65.2 | 60.0 | 81.0 | 72.7 | 63.6 | 58.3 | 56.5 | 56.5 | 27.3 | 57.1 | 41.7 | 45.5 | 36.4 | 31.6 | 20.0 | 28.6 | |
| 52 | 51.7 | 60.0 | 72.4 | 63.0 | 72.4 | 68.0 | 61.5 | 61.5 | 57.1 | 33.3 | 40.7 | 53.8 | 42.9 | 35.7 | 30.8 | 38.5 | 17.4 | 33.3 | 24.0 | |
| 59 | 84.0 | 84.6 | 92.0 | 82.6 | 76.0 | 90.5 | 72.7 | 54.5 | 66.7 | 65.2 | 82.6 | 63.6 | 58.3 | 64.3 | 54.5 | 63.6 | 42.1 | 30.0 | 38.1 | |
| 66 | 73.9 | 91.7 | 82.6 | 71.4 | 73.9 | 78.9 | 90.0 | 70.0 | 54.5 | 61.9 | 81.0 | 70.0 | 54.5 | 69.2 | 45.5 | 70.0 | 70.6 | 44.4 | 52.6 | |
| 73 | 73.9 | 91.7 | 82.6 | 71.4 | 65.2 | 89.5 | 70.0 | 60.0 | 45.5 | 42.9 | 81.0 | 80.0 | 63.6 | 61.5 | 36.4 | 30.0 | 58.8 | 55.6 | 31.6 | |
| 87 | 90.0 | 90.5 | 70.0 | 77.8 | 80.0 | 87.5 | 100 | 100 | 78.9 | 66.7 | 88.9 | 76.5 | 68.4 | 82.6 | 57.9 | 29.4 | 41.2 | 40.0 | 37.5 | |
| 94 | 71.4 | 81.8 | 61.9 | 68.4 | 61.9 | 88.2 | 66.7 | 66.7 | 60.0 | 57.9 | 89.5 | 77.8 | 80.0 | 66.7 | 70.0 | 55.6 | 44.4 | 60.0 | 47.1 | |
| 100 | 63.6 | 73.9 | 63.6 | 80.0 | 72.7 | 77.8 | 78.9 | 57.9 | 81.0 | 70.0 | 70.0 | 68.4 | 71.4 | 76.0 | 61.9 | 47.4 | 68.4 | 62.5 | 52.9 | |
% Disimilarity = 100 − similarity.
BOD5 spikes can have a combination of two effects on the biomass. This first effect is that of feed strength, with copiotrophic organisms having a selective advantage over oligotrophs. The second effect is that of toxicity, since much of the graywater BOD5 consists of detergents, which would select against or kill detergent-sensitive organisms. The graywater feed could also contain other toxic compounds, such as bleach or other cleansers. Thus, higher toxicity and/or higher food abundance associated with high BOD5 should combine to affect the biomass. Unfortunately, we do not have data that allow us to fully differentiate the feed strength from the toxicity of high BOD5. However, since the MBR design retains all biomass with essentially no washout of slow-growing organisms, we speculate that toxicity of the feed is more important than feed strength in affecting the GMBR community structure. This is consistent with low BOD5 not being associated with significant community changes.
The first BOD5 spike occurred on day 5, with samples from days 1 to 5 clustering at 55 to 60% similarity and clustering at a much lower similarity (25 to 35%) with the samples taken on days 7 and 10, well below the 57.8% ± 10.4% 7-day average similarity. The second BOD5 spike occurred on day 34, and the samples taken before and after this spike (days 31 and 38) cluster at 25 to 42% similarity. The raw similarity between these samples is 38.1% (Table 1). The third BOD5 spike occurred on days 90 to 91. This spike was accompanied by a high concentration of O/G (1,300 mg · liter−1), and a clear shift in populations was evident, with 40% similarity between days 87 and 94 (cluster III, Fig. 4 and 5). A temporary shutdown (1 day) of the bioreactor on day 92 may have also contributed to this change. The combination of high BOD5, high O/G, and a temporary shutdown in a short time period apparently stressed the biomass, leading to a bleed through of BOD5 in the effluent on day 93 (Fig. 2C). In contrast, the high effluent BOD5 during the first 10 to 12 days of operation can be attributed to establishment of the biomass.
An additional observation is that the (accidental) biomass wasting from days 25 to 54 (Fig. 2B) amounted to a restart of the system on day 54, when wasting was halted. The broad increase in effluent BOD5 over days 55 to 70 and transiently high BOD5 in the effluent on day 60 (Fig. 2C) were due to the low level of VSS (biomass) at this time. Consistent with the notion of a system restart, samples subsequent to day 54 cluster separately, in both analyses, from the prior samples (cluster III, Fig. 4 and 5). The identity of cluster III may have also been affected by persistent foaming (noted in the operational logs) of the GMBR contents over days 70 to 100.
In contrast with the several appealing connections between bioreactor operations and community changes, the apparent clustering change between the samples taken on days 10 and 12 is not linked with any obvious physical parameter. However, an examination of the raw similarity data (Table 1) finds that samples from days 10 and 12 are actually 60% similar. This is equivalent to the similarity between days 1 and 3 (61.5%) and days 2 and 4 (64%). This clustering is split at this point, because day 12 is more similar to the following samples than it is to samples before day 10.
Throughout the banding patterns, there was no particular band or set of bands that could be found at every sampling point. This agrees with the low overall similarity (0 to 26%, depending on method of analysis) between all the samples. However, if data from days 1 to 12 were ignored, certain bands were found in more than 50% of the samples (Fig. 6). Leaving samples from days 1 to 12 out of the analysis is valid, considering bioreactor startup and population stabilization. Bands 14, 18, and 29 were found in 8, 7, and 11 of 12 samples, respectively (days 19 to 100). Several other bands (bands 5, 6, 17, 19, 22, 24, and 28) were present in 5 or 6 of 12 samples (Fig. 6). This suggests that certain subpopulations may have been responsible for operational success of the GMBR and/or were able to persist, in spite of the large fluctuations in population similarity shown in Fig. 4 and 5. This general bacterial population instability coupled with generally acceptable bioreactor performance is analogous to results obtained from a methanogenic bioreactor intermittently fed with glucose (7).
Although these species were not necessarily detectable by bulk community PCR in the startup community, their presence and relative persistence in the established biomass indicates they are adapted to the fluctuating environmental conditions experienced during normal operations. Likewise, changing conditions do sometimes affect even the relatively persistent species, such that they are depleted or even temporarily not detectable. The effects of feed perturbation on community structure, as shown here, have been noted previously with molecular and morphological techniques (8).
The individual persistent species responsible for these bands would be likely candidates for incorporation into a seed culture that could be used to “jump-start” or improve bioreactor performance, particularly during startup. The determination and isolation of these persistent species are the focus of a separate investigation and include matching of pure culture isolates back to the community band patterns. Isolates confirmed as significant and persistent members of the original community will also be screened for metabolic versatility, in order to provide a greater functional stability and perhaps a greater parallel processing capability (10) in such a seed culture.
Community diversity.
For community diversity analysis, it was assumed that each band corresponded to a unique species, with band density corresponding to species abundance. These assumptions, while necessary, are not quite true, because of the quantitative limitations of DNA extraction and PCR amplification of unknown populations (2, 6, 15, 19) and the possibility of chimeric PCR products from mixed cultures (23). Likewise, it is conceivable that any given band could represent different DNA sequences that comigrate. Nonetheless, band abundance and density do remain some measure of the diversity of the original bacterial community, although not exactly in the classical meaning for the SDI. As a classic example, each and every tree in a forest can be assigned to a species and counted, and an SDI can be determined for this forest. For microbial community analyses, instead of measuring the diversity based on the total number of individuals and species in a community, this measurement is also influenced by the unknown factors of 16S gene extraction and amplification efficiency for particular populations, thus contributing to the calculated diversity of the population. In addition, detection of less-abundant species is not possible by this methodology. Thus, strictly speaking, using the SDI in this manner is only a measurement of band pattern diversity, rather than a measurement of bacterial community diversity. Nonetheless, the DGGE banding patterns do provide a means to measure an apparent diversity of the community. Equivalent use of the SDI has been reported previously for analysis of biphenyl-degrading enrichments (22).
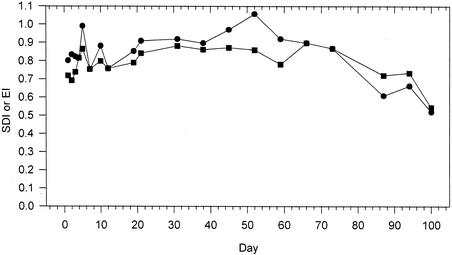
The SDI for each sample point is shown in Fig. 3 and 7. SDI is influenced both by species numbers and species abundance. Populations with more species and even distribution of individuals have higher diversity than other populations with either fewer species or disproportionate populations of each species, as embodied in the SDI. For example, the low SDI for sample 100 was largely due to the large proportion of a single band, and in samples 87 and 94, the low SDI was due mostly to fewer bands (Fig. 3). The evenness of species distribution, seen somewhat intuitively in Fig. 3, is expressed by the EI (Fig. 7).
FIG. 7.
SDI (•) and EI (▪) over the course of the run.
There was no trend to these diversity data that could be linked to feed parameters, though the later samples (samples 87, 94, and 100) did have a lower SDI and EI than earlier samples. Although not reflected in the community similarity analyses, persistent foaming and foam wasting (loss) over the 70- to 100-day period may have had an impact on community diversity. This foaming, which removes biomass, was largely responsible for the VSS (biomass) not reaching its target of 2%. Additionally, foaming may have disproportionately removed certain organisms from the community, reducing both the SDI and EI.
Conclusions.
PCR-DGGE was a useful tool for comparing bacterial populations over time in a GMBR. More importantly, large changes in population structure were, in almost every instance, attributable to operational changes in bioreactor operation, particularly changes in feed strength. In spite of these relationships evident in the similarity analyses, the diversity indices (SDI and EI) derived from the DGGE banding patterns did not correlate with changes in bioreactor operations. As a matter of practicality, the finding that several species are generally able to persist in spite of the bioreactor operating conditions suggests that PCR-DGGE should be useful as a tool or screen for targeting particular species as potential seed cultures.
Acknowledgments
This work was supported by the Naval Surface Warfare Center, Carderock Division, In-House Laboratory Independent Research (ILIR) Program, which was sponsored by the Office of Naval Research.
Technical assistance was provided by Alicia Petros.
REFERENCES
- 1.Amann, R., H. Lemmer, and M. Wagner. 1998. Monitoring the community structure of wastewater treatment plants: a comparison of old and new techniques. FEMS Microb. Ecol. 25:205-215. [Google Scholar]
- 2.Becker, S., P. Böger, R. Oehlmann, and A. Ernst. 2000. PCR bias in ecological analysis: a case study for quantitative Taq nuclease assays in analyses of microbial communities. Appl. Environ. Microbiol. 66:4945-4953. [DOI] [PMC free article] [PubMed] [Google Scholar]
- 3.ben Omar, N., and F. Ampe. 2000. Microbial community dynamics during production of the Mexican fermented maize dough pozol. Appl. Environ. Microbiol. 66:3664-3673. [DOI] [PMC free article] [PubMed] [Google Scholar]
- 4.Duineveld, B. M., G. A. Kowalchuk, A. Keijzer, J. D. van Elsas, and J. A. van Veen. 2001. Analysis of bacterial communities in the rhizosphere of chrysanthemum via denaturing gradient gel electrophoresis of PCR-amplified 16S rRNA as well as DNA fragments coding for 16S rRNA. Appl. Environ. Microbiol. 67:172-178. [DOI] [PMC free article] [PubMed] [Google Scholar]
- 5.Eichner, C. A., R. W. Erb, K. N. Timmis, and I. Wagner-Döbler. 1999. Thermal gradient gel electrophoresis analysis of bioprotection from pollutant shocks in the activated sludge microbial community. Appl. Environ. Microbiol. 65:102-109. [DOI] [PMC free article] [PubMed] [Google Scholar]
- 6.Farrelly, V., F. A. Rainey, and E. Stackebrandt. 1995. Effect of genome size and rrn copy number on PCR amplification of 16S rRNA genes from a mixture of bacterial species. Appl. Environ. Microbiol. 61:2798-2801. [DOI] [PMC free article] [PubMed] [Google Scholar]
- 7.Fernández, A., S. Huang, S. Seston, J. Xing, R. Hickey, C. Criddle, and J. Tiedje. 1999. How stable is stable? Function versus community composition. Appl. Environ. Microbiol. 65:3697-3704. [DOI] [PMC free article] [PubMed] [Google Scholar]
- 8.Fernández, A. S., S. A. Hashsham, S. L. Dollhopf, L. Raskin, O. Glagoleva, F. B. Dazzo, R. F. Hickey, C. S. Criddle, and J. M. Tiedje. 2000. Flexible community structure correlates with stable community function in methanogenic bioreactor communities perturbed by glucose. Appl. Environ. Microbiol. 66:4058-4067. [DOI] [PMC free article] [PubMed] [Google Scholar]
- 9.Ghyoot, W., and W. Verstraete. 1999. Reduced sludge production in a two-stage membrane-assisted bioreactor. Water Res. 34:205-215. [Google Scholar]
- 10.Hashsham, S. A., A. S. Fernandez, S. L. Dollhopf, S. L. F. B. Dazzo, R. F. Hickey, J. M. Tiedje, and C. S. Criddle. 2000. Parallel processing of substrate correlates with greater functional stability in methanogenic bioreactor communities perturbed by glucose. Appl. Environ. Microbiol. 66:4050-4057. [DOI] [PMC free article] [PubMed] [Google Scholar]
- 11.Konopka, A., T. Zakharova, L. Oliver, D. Camp, and R. F. Turco. 1996. Biodegradation of organic wastes containing surfactants in a biomass recycle reactor. Appl. Environ. Microbiol. 62:3292-3297. [DOI] [PMC free article] [PubMed] [Google Scholar]
- 12.LaPara, T. M., C. H. Nakatsu, L. Pantea, and J. E. Alleman. 2000. Phylogenetic analysis of bacterial communities in mesophilic and thermophilic bioreactors treating pharmaceutical wastewater. Appl. Environ. Microbiol. 66:3951-3959. [DOI] [PMC free article] [PubMed] [Google Scholar]
- 13.Liu, Y., and J.-H. Tay. 2001. Strategy for minimization of excess sludge production from the activated sludge process. Biotechnol. Adv. 19:97-107. [DOI] [PubMed] [Google Scholar]
- 14.Muyzer, G., E. C. De Waal, and A. G. Uitterlinden. 1993. Profiling of complex microbial populations by denaturing gradient gel electrophoresis analysis of polymerase chain reaction-amplified genes coding for 16S rRNA. Appl. Environ. Microbiol. 59:695-700. [DOI] [PMC free article] [PubMed] [Google Scholar]
- 15.Polz, M. F., and C. M. Cavanaugh. 1998. Bias in template-to-product ratios in multitemplate PCR. Appl. Environ. Microbiol. 64:3724-3730. [DOI] [PMC free article] [PubMed] [Google Scholar]
- 16.Sheffield, V. C., D. R. Cox, L. Lerman, and R. M. Myers. 1989. Attachment of a 40-base pair G+C rich sequence (GC-clamp) to genomic DNA fragments by the polymerase chain reaction results in improved detection of single-base changes. Proc. Natl. Acad. Sci. USA 86:232-236. [DOI] [PMC free article] [PubMed] [Google Scholar]
- 17.Smalla, K., G. Wieland, A. Buchner, A. Zock, J. Parzy, S. Kaiser, N. Roskot, H. Heuer, and G. Berg. 2001. Bulk and rhizosphere soil bacterial communities studied by denaturing gradient gel electrophoresis: plant-dependent enrichment and seasonal shifts revealed. Appl. Environ. Microbiol. 67:4742-4751. [DOI] [PMC free article] [PubMed] [Google Scholar]
- 18.Smit, E., P. Leeflang, S. Gommans, J. van den Broek, S. van Mil, and K. Wernars. 2001. Diversity and seasonal fluctuations of the dominant members of the bacterial soil community in a wheat field as determined by cultivation and molecular methods. Appl. Environ. Microbiol. 67:2284-2291. [DOI] [PMC free article] [PubMed] [Google Scholar]
- 19.Suzuki, M. T., and S. J. Giovannoni. 1996. Bias caused by template annealing in the amplification of mixtures of 16S rRNA genes by PCR. Appl. Environ. Microbiol. 62:625-630. [DOI] [PMC free article] [PubMed] [Google Scholar]
- 20.Ueda, T., and K. Hata. 1999. Domestic wastewater treatment by a submerged membrane bioreactor with gravitational filtration. Water Res. 33:2888-2892. [Google Scholar]
- 21.Ueda, T., and N. J. Horan. 2000. Fate of indigenous bacteriophage in a membrane bioreactor. Water Res. 34:2151-2159. [Google Scholar]
- 22.Wagner-Döbler, I., A. Bennasar, M. Vancanneyt, C. Strömpl, I. Brümmer, C. Eichner, I. Grammel, and E. R. B. Moore. 1998. Microcosm enrichment of biphenyl-degrading microbial communities from soils and sediments. Appl. Environ. Microbiol. 64:3014-3022. [DOI] [PMC free article] [PubMed] [Google Scholar]
- 23.Wang, G. C.-Y., and Y. Wang. 1997. Frequency of formation of chimeric molecules as a consequence of PCR coamplification of 16S rRNA genes from mixed bacterial genomes. Appl. Environ. Microbiol. 63:4645-4650. [DOI] [PMC free article] [PubMed] [Google Scholar]
- 24.Xing, C.-H., E. Tardieu, Y. Qian, and X.-H. Wen. 2000. Ultrafiltration membrane bioreactor for urban wastewater reclamation. J. Membr. Sci. 177:73-82. [Google Scholar]


