

Abstract
We show that NF-κB and transcriptional targets are activated in liver by obesity and high-fat diet (HFD). We have matched this state of chronic, subacute ‘inflammation’ by low-level activation of NF-κB in the liver of transgenic mice, designated LIKK, by selectively expressing constitutively active IKK-β in hepatocytes. These mice exhibit a type 2 diabetes phenotype, characterized by hyperglycemia, profound hepatic insulin resistance, and moderate systemic insulin resistance, including effects in muscle. The hepatic production of proinflammatory cytokines, including IL-6, IL-1β and TNF-α, was increased in LIKK mice to a similar extent as induced by HFD in in wild-type mice. Parallel increases were observed in cytokine signaling in liver and mucscle of LIKK mice. Insulin resistance was improved by systemic neutralization of IL-6 or salicylate inhibition of IKK-β. Hepatic expression of the IκBα superrepressor (LISR) reversed the phenotype of both LIKK mice and wild-type mice fed an HFD. These findings indicate that lipid accumulation in the liver leads to subacute hepatic ‘inflammation’ through NF-κB activation and downstream cytokine production. This causes insulin resistance both locally in liver and systemically.
Obesity is increasingly prevalent and strongly associated with the development of insulin resistance1, an underlying feature of both type 2 diabetes (T2D) and the metabolic syndrome2. Although epidemiological correlations are established, the cellular and molecular mechanisms that link obesity and insulin resistance are unknown. Increased adiposity is associated with lipid accumulation in other tissues, including muscle (intramyocellular lipid) and liver (hepatic steatosis), which has made it that much more difficult to pinpoint the primary sites responsible for initiating insulin resistance3. Fat accumulation in the visceral depot and liver are strongly correlated, and both are highly correlated with the development and severity of insulin resistance4-6.
Growing evidence links a chronic, subacute inflammatory state to the development of obesity and the coexisting conditions of insulin resistance, T2D and the metabolic syndrome. Epidemiologists have consistently found elevations in markers and potential mediators of inflammation and the acute-phase response7,8, suggesting that low-grade inflammation precedes and predicts the development of T2D9. Proinflammatory cytokines can cause insulin resistance10,11 and anti-inflammatory medications may reverse it12,13, suggesting that inflammation may be directly involved in its pathogenesis.
Markers and mediators of inflammation that are biosynthesized in liver include CRP, PAI-1, fibrinogen and IL-6, suggesting that ‘subacute inflammation’ in liver, secondary to steatosis, might be involved in the development of insulin resistance, T2D and the metabolic syndrome. Because visceral adiposity and hepatic steatosis are etiologically and functionally intertwined, and both might be associated with subacute inflammation, we took a transgenic approach to ask whether involvement of a single tissue was sufficient to induce insulin resistance and diabetes. We accomplished this by selectively producing a subacute inflammatory state in liver parenchyma through transgenic expression of the IκB kinase IKK-β. Low-level expression of IKK-β ratchets up NF-κB activity, in the absence of either adiposity or steatosis, to levels seen in HFD and obesity. NF-κB is a proinflammatory master switch that controls the production of a host of inflammatory markers and mediators, including CRP, PAI-1, IL-6, TNF-α and IL-1β. Our previous studies suggested that systemic inhibition of IKK-β improved insulin resistance in rodents12 and improved glycemia, insulin sensitivity and hyperlipidemia in patients with T2D13. Current studies ask whether liver is a primary site of action and determine both tissue-specific and systemic consequences of subacute activation of NF-κB in liver.
RESULTS
Obesity increases NF-κB signaling in liver
HFD increased insulin resistance in C57Bl/6 mice by ∼2.5-fold, quantified by homeostasis model assessment–insulin resistance (HOMA-IR), an established measure of insulin sensitivity (Table 1)14. HFD was accompanied by 1.9- and 1.4-fold increases in hepatic triglyceride (TG) content and serum free fatty acid (FFA) concentrations, respectively (Table 1), and a twofold increase in hepatic NF-κB activity (Fig. 1a). NF-κB and IKK-β activities were similarly elevated in the livers of Zucker fatty rats (fa/fa) compared to lean controls (Fig. 1b), indicating that the NF-κB pathway in liver is activated by both genetic (hyperphagic) and diet-induced obesity.
Table 1.
Expression profiles of proinflammatory and signaling genes in liver and additional metabolic parameters in wild-type, LIKK and LISR mice.
| Encoded protein | HFD/chow (WT) | LIKK/WT (chow) | +/− NaSal (LIKK) | LISR/WT (HFD) |
|---|---|---|---|---|
| Cytokines & chemokines | ||||
| IL-1β | 3.53 ± 0.92↑* | 3.68 ± 0.95↑* | 0.49 ± 0.11↓* | 1.02 ± 0.24 |
| IL-4 | - | 1.42 ± 1.03 | - | - |
| IL-6 | 6.12 ± 0.85↑* | 8.76 ± 1.71↑** | 0.45 ± 0.10↓** | 0.36 ± 0.16↓** |
| IL-10 | 1.43 ± 0.29 | 1.81 ± 1.07 | 0.87 ± 0.23 | 1.71 ± 0.46 |
| IL-11 | 0.79 ± 0.41 | 0.40 ± 0.12↓* | 1.17 ± 0.31 | 0.82 ± 0.13 |
| IL-13 | 2.58 ± 0.67 | 0.83 ± 0.13 | - | 0.64 ± 0.10 |
| IL-15 | 2.59 ± 0.92 | 0.96 ± 0.13 | - | 1.02 ± 0.15 |
| TNF-α | 2.58 ± 0.50↑* | 0.60 ± 0.09 | 0.75 ± 0.15 | 1.63 ± 0.50 |
| IFN-γ | - | 1.39 ± 0.41 | - | - |
| Cx3CL | 0.93 ± 0.27 | 1.05 ± 0.27 | - | 1.71 ± 0.69 |
| Receptors | ||||
| CxCL-10 | - | 1.72 ± 1.02 | - | - |
| IL-1R1 | 1.80 ± 0.23 | 2.55 ± 0.62↑* | 0.55 ± 0.12 | 0.96 ± 0.15 |
| IL-1R2 | 2.08 ± 0.65 | 1.21 ± 0.22 | 0.93 ± 0.27 | 1.13 ± 0.44 |
| IL-6Rα | 0.55 ± 0.09 | 0.84 ± 0.09 | - | - |
| IL-6ST/gp130 | 0.75 ± 0.08 | 1.43 ± 0.13↑* | 0.69 ± 0.20 | 0.83 ± 0.13 |
| IL-8R | 2.61 ± 0.57↑* | 2.67 ± 0.55↑* | 0.66 ± 0.19↓* | 0.38 ± 0.09↓* |
| TNFR1a | 1.92 ± 0.27↑* | 0.88 ± 0.18 | 0.77 ± 0.13 | 0.61 ± 0.09↓* |
| IFN-γR | - | 1.55 ± 0.27 | - | - |
| TLR-2 | 3.56 ± 0.85↑* | 5.32 ± 1.14↑* | 0.58 ± 0.14↓* | 0.55 ± 0.05↓* |
| Signaling | ||||
| TLR-4 | 2.01 ± 0.27↑* | 1.22 ± 0.16 | - | 0.49 ± 0.11↓* |
| SOCS-1 | 2.21 ± 0.37↑* | 4.50 ± 1.32↑* | 0.49 ± 0.16↓* | 0.52 ± 0.09↓* |
| SOCS-2 | 1.95 ± 0.24↑* | 3.08 ± 0.42↑* | 0.54 ± 0.18↓* | 0.83 ± 0.17 |
| SOCS-3 | 2.27 ± 0.40↑* | 1.38 ± 0.63↑* | 0.47 ± 0.21↓* | 0.51 ± 0.09↓* |
| Stat-3 | 0.89 ± 0.14 | 2.94 ± 0.43↑* | 0.89 ± 0.22 | 0.99 ± 0.07 |
| Metabolicb | ||||
| NF-κB activitya | 2.01 ± 0.14↑** | 2.31 ± 0.03↑** | 0.68 ± 0.08↓* | 0.36 ± 0.04↓** |
| HOMA-IRc | 2.56 ± 0.47↑** | 1.64 ± 0.21↑* | 0.47 ± 0.06↓** | 0.42 ± 0.12↓** |
| Liver triglycerides | 0.90 ± 0.13 | 0.71 ± 0.45↓* | 0.98 ± 0.17 | 1.88 ± 0.20↑* |
| Serum FFA | 1.41 ± 0.05↑* | 0.99 ± 0.09 | 0.93 ± 0.04 | 0.96 ± 0.05 |
Quantitative RT-PCR data represent fold increase over control. WT, wild-type (C57BI/6 or unaffected littermates). HFD, high fat diet. Sodium salicylate (NaSal) was administered in the drinking water.
EMSA measurements of NF-κB activity in liver.
Metabolic parameters, not mRNA expression.
HOMA-IR, homeostasis model assessment-insulin resistance (fasting glucose (mmol/L) × fasting insulin (mU/L)/22.5). Statisical analyses: mean ± s.e.m.
P < 0.05
P < 0.01, n = 4–6.
Figure 1.
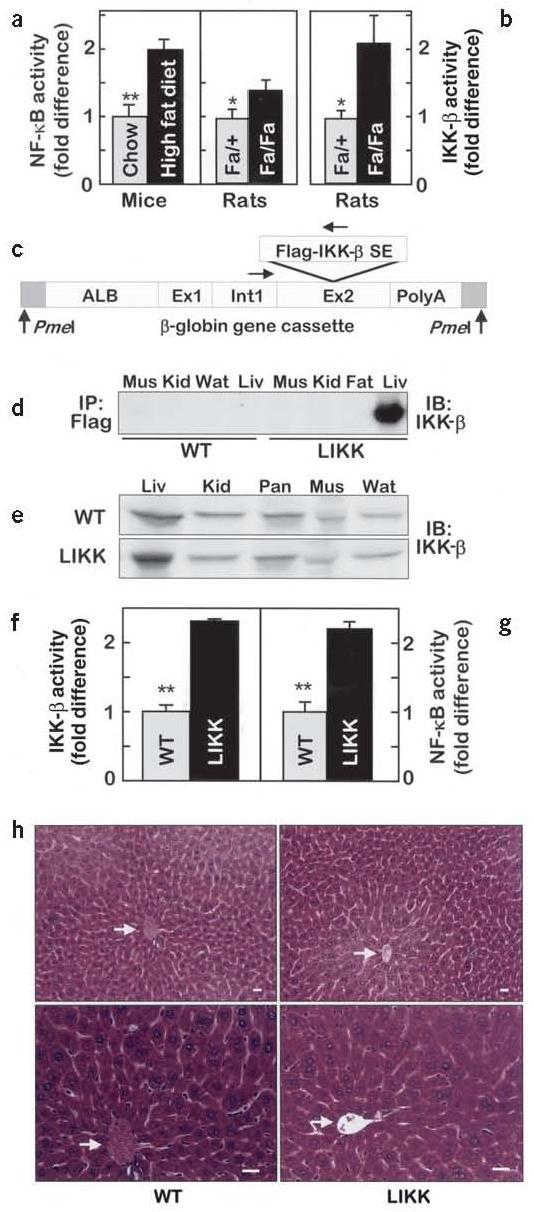
IKK-β and NF-κB activities in liver. (a) NF-κB and (b) IKK-β activities are expressed as fold differences (n = 6, *P < 0.05; **P < 0.01). (c) Schematic map of the transgene construct showing Flag-tagged IKK-β S177E,S181E subcloned into exon 2 of the Alb1 promoter-driven truncated β-globin gene vector. (d) Transgene expression and (e) total amounts of IKK-β in skeletal muscle (Mus), kidney (Kid), white adipose tissue (Wat), liver (Liv) and pancreas (Pan). (f) IKK-β and (g) NF-κB activities in liver (n = 4–6, **P < 0.01). (h) Hematoxylin and eosin–stained sections of liver. Arrows indicate central veins. Scale bars, 50 μm.
Message levels of NF-κB targets were accordingly elevated by HFD, including selected cytokines and associated receptors and signaling molecules (Table 1). Notably, mRNAs encoding IL-6, Il-1β and TNF-α were increased by 6.1-, 3.5- and 2.6-fold, respectively. Each of the encoded cytokines has been associated previously with the development of insulin resistance10,11,15-23. Two- to threefold increases were also seen in the levels of mRNAs encoding cytokine (TNFR1a and IL-8R) and Toll (TLR-2 and TLR-4) receptors and suppressors of cytokine signaling (SOCS-1, SOCS-2 and SOCS-3; Table 1). Although the Socs genes are not themselves NF-κB targets, their expression is driven by many cytokines, including those that are NF-κB targets. Based on these findings, we hypothesized that dietary obesity induces a low-grade inflammatory state in liver that is potentially driven by NF-κB both directly and indirectly through cytokines downstream from it.
Transgenic activation of NF-κB
To test the hypothesis, we used a transgenic approach to activate NF-κB selectively in hepatocytes. This was achieved using an albumin promoter to drive the expression of constitutively active human IKK-β (S177E/S181E)24-26 in LIKK mice (Fig. 1c). Western blotting confirmed liver-specific expression (Fig. 1d) at roughly twofold over endogenous protein (Fig. 1e). IKK-β and NF-κB activities were similarly increased about twofold in LIKK versus wild-type liver (Fig. 1f,g), which closely matches corresponding activities in dietary and genetic models of obesity (Fig. 1a,b).
LIKK mice are viable and have normal overall appearance, body weight and food intake. LIKK livers are histologically normal without gross evidence of immune cell infiltration (Fig. 1h). Circulating leptin (data not shown) and liver enzyme levels (alanine aminotransferase: LIKK 54.8 ± 2.6 U/l and wild-type 55.5 ± 4.0 U/L; lactic acid dehydrogenase: LIKK 665.3 ± 146.8 U/l and wild-type 637.5 ± 101.5 U/L) were normal. In metabolic cages, LIKK activity levels, oxygen consumption, and CO2 and heat production were found to be normal (data not shown). LIKK mice therefore provide an appropriate model for testing whether chronic, subacute ‘inflammation’ in liver—in the absence of other associated and potentially confounding effects of obesity—might contribute to the development of insulin resistance. Data are provided for one transgenic line, although phenotypes of two lines were essentially indistinguishable.
LIKK mice are insulin resistant
Elevated fasting insulin levels in both male and female LIKK mice (Fig. 2a), and normal fasting blood glucose and FFA (Table 1) levels, suggested a state of compensated insulin resistance. Both sexes developed glucose intolerance during glucose tolerance testing (GTT), with both glucose (area under the curve (AUC): male, LIKK 320 ± 20 versus wild-type 276 ± 11 mg/dl·min, P < 0.02; female, LIKK 239. 1 ± 6.7 versus wild-type 182.4 ± 11.8 mg/dl·min, P < 0.01) and insulin (AUC: male, LIKK 49.3 ± 7.5 versus wild-type 36.7 ± 4.2 ng/ml·h, P < 0.05; female, LIKK 26.9 ± 2.0 versus wild-type, 21.4 ± 1.3 ng/ml·h, P < 0.04) excursions increasing by about 25%. An increase in acute insulin response to intraperitoneal glucose and tendency toward increased beta-cell mass are consistent with beta-cell compensation for existent insulin resistance (see Supplementary Fig. 1 online).
Figure 2.

Carbohydrate metabolism. (a) Fasting insulin levels (n = 8–12; AUC, area under curve). (b) Hyperinsulinemic-euglycemic clamps were performed in 12–15-week-old male mice (n = 10, *P < 0.05). (c,d) Glucose tolerance tests were performed in 12-week-old male mice (n = 6). (c) Glucose concentrations or (d) insulin resistance index (IRI = glucose concentration (mmol/L) × insulin concentration (mU/L) ÷ 22.5) were plotted versus time (left) and as AUC (right, per 120 min). *P < 0.05, **P < 0.01. (e) Hepatic glucose production and glycogen synthesis determined during hyperinsulinemic-euglycemic clamps (n = 10; **P < 0.01). (f) GSK3β phosphorylation in liver after hyperinsulinemic-euglycemic clamps. (g) mRNA expression levels for gluconeogenic enzymes determined using real-time RT-PCR (*P < 0.05, **P < 0.01). (h) Glycogen synthesis and glucose uptake in skeletal muscle during hyperinsulinemic-euglycemic clamps (n = 10, *P < 0.05).
We used the hyperinsulinemic-euglycemic clamp method to further assess insulin sensitivity in LIKK mice. Hyperinsulinemia (LIKK, 3.4 ± 0.5 versus wild-type, 3.1 ± 0.6 ng/ml) and euglycemia (LIKK, 92.8 ± 0.8 versus wild-type, 96.5 ± 0.5 mg/dl) were equivalently maintained during the 4.0 mU/kg/min insulin infusions, although glucose infusion rates were 63% lower in LIKK mice than in wild-type littermates (Fig. 2b). Glucose disposal rates were similarly decreased by 39% in LIKK mice (Fig. 2b), consistent with the development of systemic insulin resistance.
We next tested whether the severity of systemic insulin resistance was related to the degree of hepatocellular ‘inflammation,’ using homozygous LIKKTg/Tg mice created by crossing standard hemizygous LIKKTg mice. Levels of Flag-tagged IKK-β protein were elevated in LIKKTg/Tg livers about twofold over those in LIKKTg mice (data not shown). Glucose intolerance and insulin resistance increased in parallel to show a dose-dependent relationship between NF-κB activity in liver and the development of systemic insulin resistance (Fig. 2c,d). Hemizygous LIKKTg mice having the milder phenotype were used for the remainder of our studies.
Tissue specificity and cross-talk
Because the transgene in LIKK mice is expressed selectively in liver, we first determined the degree of hepatic insulin resistance. Steady-state insulin infusion at 4.0 mU/kg/min, which suppressed hepatic glucose production in wild-type controls to 31% of its basal level, did not suppress hepatic glucose production in LIKK mice (Fig. 2e). This was accompanied by decreases in hepatic glycogen synthesis (Fig. 2e), glucose uptake (data not shown) and GSK3β activity (Fig. 2f). Expression of mRNAs encoding the rate-limiting enzymes in gluconeogenesis, phosphoenolpyruvate carboxykinase and glucose-6-phosphatase, was appropriately suppressed by feeding in wild-type controls. In contrast, the expression of mRNA encoding glucose-6-phosphatase was elevated in fasting LIKK mice and feeding did not suppress the expression of mRNAs encoding both phosphoenolpyruvate carboxykinase and glucose-6-phosphatase (Fig. 2g). These findings show that NF-κB activation in hepatocytes causes hepatic insulin resistance.
Reduced glucose disposal rates in LIKK mice suggested that other tissues might also be impacted. In vivo radioisotope studies showed that glycogen synthesis and glucose uptake in muscle were reduced by 27% and 20%, respectively (Fig. 2h), suggesting that there might be cross-talk between liver and muscle, possibly through hepatic production of circulating substances.
Insulin signaling
Insulin receptor phosphorylation increased eightfold in wild-type livers after insulin (5.0 mU/g) injections (Fig. 3a,b). Basal and insulin-stimulated insulin receptor phosphorylation were both decreased in LIKK liver. The patterns for insulin receptor substrate (IRS)-2 phosphorylation were similar, with decreased specific IRS-2 phosphorylation in LIKK liver (Fig. 3a,b). In skeletal muscle, insulin stimulated greater than tenfold increases in insulin receptor phosphorylation in both wild-type and LIKK mice. In contrast, IRS-1 phosphorylation was blunted in LIKK muscle (Fig. 3c,d). These findings are consistent with insulin resistance in both liver and muscle of LIKK mice.
Figure 3.
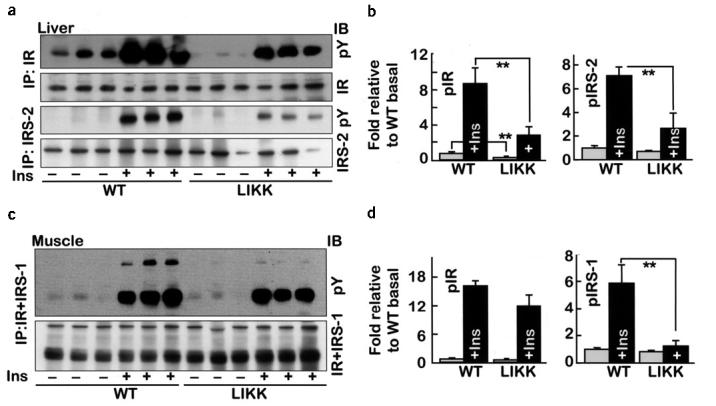
Insulin signaling in liver and skeletal muscle of LIKK mice. Fasting mice were injected with insulin (5.0 mU/g) or saline. Proteins were immunoprecipitated (IP) from (a,b) liver or (c,d) skeletal muscle (gastrocnemius) immunoblotted (IB) with the indicated antibodies. (b,d) Specific phosphorylation: open bars, without insulin; closed bars, with insulin; n = 3; *P < 0.05, **P < 0.01. Ins, insulin; IR, insulin receptor.
Cytokine production and signaling
We used mRNA expression profiles to identify potential mediators and mechanisms for cross-talk between liver and muscle. Similar to the findings in HFD, mRNAs encoding IL-1β and IL-6 were elevated 3.7- and 8.8-fold, respectively, in livers of LIKK mice (Table 1). Levels of mRNAs encoding related receptors were also increased, including mRNAs encoding IL-1R1, IL-6ST/gp130, IL-8R and TLR-2. The elevated levels of mRNAs encoding SOCS-1, SOCS-2, SOCS-3 and Stat-3 suggested that cytokines including IL-6 produced in LIKK liver might have local actions22. Stat-3 phosphorylation was accordingly elevated by 2.4-fold in LIKK liver (Fig. 4a). Circulating IL-6 concentrations were increased in parallel with transgene dosage in wild-type, LIKKTg and LIKKTg/Tg mice (Fig. 4b). Immunofluorescence analyses determined the cellular source of IL-6 in LIKK mice. IL-6 immunostaining was low in wild-type liver, with intense staining of individual CD68-positive cells (Supplementary Fig. 2 online; CD68 is a Kupffer cell marker). IL-6 immunostaining was greater in LIKK liver and localized diffusely to hepatocytes, showing that liver parenchyma is the major source of IL-6 overproduction in LIKK mice.
Figure 4.
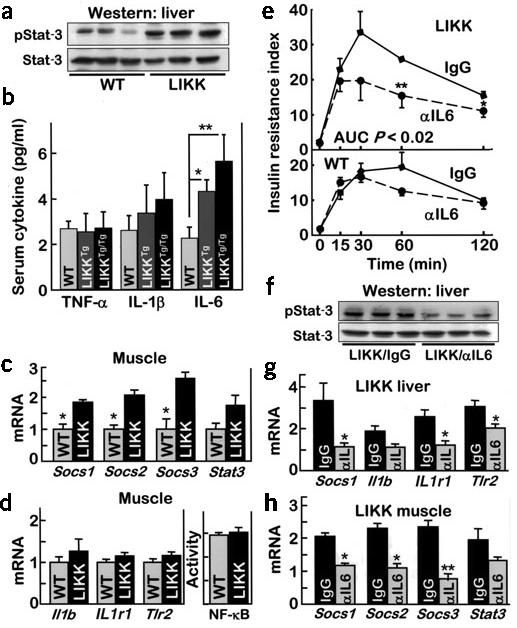
Cytokine signaling in LIKK mice. (a) Western blots of phosphorylated Stat-3 or Stat-3 in liver. (b) Circulating levels of TNF-α, IL-1β and IL-6 (n = 4–8; *P < 0.05, ** P < 0.01). (c,d) mRNA levels in skeletal muscle determined by real-time RT-PCR. NF-κB activity measured by specific DNA binding (n = 6; * P < 0.05). (e) Glucose tolerance tests 2–3 weeks after treatment with neutralizing antibody to IL-6 (αIL6) or control IgG (n = 6; insulin resistance index, IRI = glucose concentration (mmol/L) × insulin concentration (mU/L) ÷ 22.5). (f) Phosphorylated Stat-3 and Stat-3 in livers from mice treated with antibodies to IL-6 (αIL6) or control IgG. mRNA levels in liver (g) and gastrocnemius muscle (h) determined by real-time RT-PCR (*P < 0.05, ** P < 0.01). Il1b encodes IL-1β; Il1R1 encodes IL-1R1.
Socs1, Socs2, Socs3 and Stat3 mRNA levels were also elevated in LIKK muscle, suggesting that IKK-β–NF-κB activation in liver affected signaling in muscle (Fig. 4c). Neither NF-κB activity nor target message levels were elevated in LIKK muscle (Fig. 4d), suggesting that a liver-derived cytokine, possibly IL-6, mediated insulin resistance in muscle.
IL-6 neutralization
Neutralizing IL-6 antibodies, developed for this purpose27-29, were used to test whether IL-6 was involved in the development of insulin resistance in LIKK mice. GTTs showed a significant improvement in insulin resistance in LIKK mice upon IL-6 neutralization (Fig. 4e). Insulin resistance index, which was increased in control immunoglobulin (Ig)G-treated LIKK mice (AUC wild-type-IgG, 14.7 ± 2.2 versus LIKK-IgG, 23.0 ± 1.9 min−1, P = 0.03), was normal following IL-6 neutralization (AUC LIKK–antibody to IL-6, 14.9 ± 2.8 min−1, P < 0.02). Consistent with direct effects on liver, systemic IL-6 neutralization was accompanied by decreased Stat-3 phosphorylation (P = 0.04) and mRNA levels of NF-κB target genes (Fig. 4f,g). Systemic IL-6 neutralization was also accompanied by reductions in relevant mRNA levels in skeletal muscle (Fig. 4h). Those messages that were elevated in LIKK muscle, including Socs1, Socs2, Socs3 and Stat3, were reduced by IL-6 neutralization. These findings strongly support a role for IL-6 in the development of insulin resistance in LIKK mice.
Salicylate treatment of insulin resistance
Our previous studies showed that inhibition of IKK-β and NF-κB with salicylates improved insulin sensitivity in rodents and humans12,13,30. HOMA-IR, which is increased in LIKK mice (3.1 ± 0.4) relative to wild-type littermates (2.1 ± 0.2; P < 0.05), improved with salicylate treatment in LIKK mice by greater than 50% (1.5 ± 0.2; P < 0.005; Table 1). During GTTs, insulin (AUC: LIKK control, 59.1 ± 6.1 versus LIKK + salicylate, 46.2 ± 15.4 ng/ml·h; P = 0.02) and glucose (AUC: LIKK control, 300 ± 11 versus LIKK + salicylate, 254 ± 11 mg/dl·min; P = 0.01) excursions decreased in the treatment group. This translates into a 42% improvement in insulin resistance index (Fig. 5a).
Figure 5.
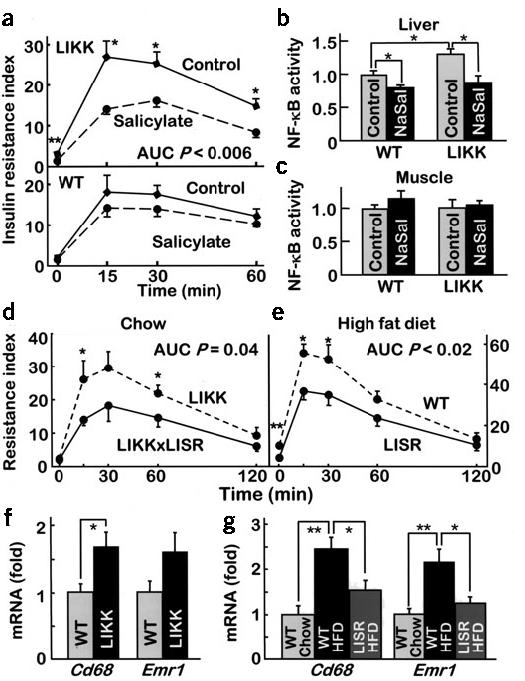
Reversal of insulin resistance and inflammation. (a) Mice (16-week-old males; n = 6–8) treated orally with high-dose salicylate were subjected to glucose tolerance testing (insulin resistance index = glucose concentration (mmol/L) × insulin concentration (mU/L) ÷ 22.5). (b,c) Binding of NF-κB to DNA in liver and skeletal muscle of control and sodium salicylate-treated (NaSal) mice. (d) Doubly transgenic LIKK × LISR mice were subjected to glucose tolerance testing (12-week-old males; n = 5 per group). (e) Mice fed a HFD for 3 months were subjected to glucose tolerance testing (n = 6–7 per group). mRNA levels of monocyte-macrophage proteins in liver of (f) chow-fed wild-type and LIKK mice and (g) wild-type and LISR mice fed chow or HFD (P < 0.05, **P < 0.01).
Salicylate treatment reduced NF-κB activity in liver by 32% in LIKK mice and 20% in wild-type mice (Fig. 5b). In contrast, NF-κB activity was indistinguishable in muscle of LIKK and wild-type mice, with or without salicylate treatment (Fig. 5c). Expression of mRNAs encoding IL-6 and IL-1β, the cytokines most induced in HFD and LIKK models, was reduced in salicylate-treated animals by more than 50% (Table 1). Expression patterns for other genes that were coordinately upregulated by HFD or NF-κB activation (LIKK) were concordantly downregulated by salicylate, including genes encoding receptors (IL-8R and TLR-2) and signaling proteins (SOCS-1, SOCS-2 and SOCS-3). These findings indicate that salicylate improves systemic insulin sensitivity in LIKK mice through IKK-β–NF-κB inhibition in liver but not in muscle.
NF-κB inhibition in LISR mice
Using similar transgenic strategies we also inhibited NF-κB in mice through expression of dominant inhibitory IκBα (S32A,S36A)31 (Fig. 1c). Mice that selectively express the IκBα superrepressor in liver and are designated LISR mice. These mice are viable and have normal appearance, body weight, food intake and liver histology (data not shown). On a chow diet LISR mice had normal fasting glucose (LISR, 76.5 ± 8.3 versus wild-type, 82.1 ± 10.5 mg/dl) and insulin (LISR, 4.9 ± 0.7 versus wild-type, 5.5 ± 0.8 ng/ml) concentrations, normal circulating FFA and leptin levels (data not shown), and normal glucose excursions during GTTs (AUC: LISR, 258 ± 22.6 versus wild-type, 277 ± 19.4 mg/dl·min), despite the fact the NF-κB is inhibited (Supplementary Fig. 3 online).
We crossed LIKK and LISR mice to determine whether the insulin resistance phenotype in LIKK mice was dependent upon NF-κB activation. Coexpression of the IκB superrepressor in LIKK × LISR mice reduced both insulin (AUC: LIKK, 57.7 ± 5.5 versus LIKK × LISR, 43.0 ± 7.9 ng/ml·h; P = 0.05) and glucose (AUC: LIKK, 323 ± 16.2 versus LIKK × LISR, 275 ± 12.2 mg/dl·min; P = 0.04) concentrations during GTTs, which translated into marked improvements in insulin resistance index (Fig. 5d). These findings verify that the development of insulin resistance in LIKK mice is NF-κB dependent, as opposed to being mediated by IKK-β activation through an alternative pathway.
We used LISR mice to test whether liver-specific inhibition of NF-κB protected against the development of diet-induced insulin resistance. Weight gain and hepatic triglycerides (wild-type, 31.8 ± 3.4 versus LISR, 30.7 ± 6.2 nmol/mg; P = 0.01) and serum FFA (wild-type, 1.7 ± 0.1 versus LISR, 1.6 ± 0.08 mM; P = 0.02) concentrations were similar in LISR and control mice after 3 months of HFD. Fasting insulin levels in LISR mice were lower (wild-type, 1.42 ± 0.16 versus LISR, 0.77 ± 0.17 ng/ml; P = 0.02) and both insulin (AUC: wild-type, 92.8 ± 9.5 versus LISR, 63.9 ± 8.5 ng/ml·h; P = 0.04) and glucose (AUC: wild-type, 352 ± 16 versus LISR, 289 ± 16 mg/dl·min; P = 0.03) concentrations were lower in the LISR mice during GTTs. HOMA-IR (wild-type, 10.54 ± 1.21 versus LISR, 4.39 ± 1.25; P = 0.006) and insulin resistance index (Fig. 5e) values were accordingly decreased in LISR mice. Concordantly, the increases in both beta-cell mass and acute insulin response that accompany HFD were less pronounced in LISR mice (Supplementary Fig. 4 online).
Consistent again with a potential role for IL-6 in the development of obesity- and diet-induced insulin resistance, NF-κB inhibition in LISR mice was accompanied by a substantial 64% decrease in Il6 mRNA expression (Table 1). Expression patterns for genes encoding receptors and signaling proteins were similarly clustered: those upregulated in HFD and LIKK models were downregulated in LISR mice much as they were by salicylate treatment (Table 1). The findings with LISR mice indicate that NF-κB activation in liver parenchyma is an integral feature of insulin resistance associated with diet-induced obesity.
Potential role for hepatic macrophages
Recent studies suggested that obesity and HFD lead to the recruitment of macrophages in adipose tissue32,33. Our data also support the potential involvement of hepatic macrophages or Kupffer cells in the pathogenesis of insulin resistance in LIKK mice (Supplementary Fig. 2 online). To learn more about the role of macrophages in the pathology of LIKK mice, we examined the expression of macrophage-specific genes in liver. mRNA levels of Cd68 and Emr1 (also known as F4/80) were upregulated ∼1.8-fold in LIKK versus wild-type liver (Fig. 5f). Without an apparent change in the number of cells, these findings are more consistent with the activation of resident Kupffer cells than recruitment of additional macrophages.
The expression of Cd68 and Emr1 were also increased greater than twofold by HFD, and both were decreased by hepatocellular inhibition of NF-κB in LISR mice (Fig. 5g). This is an important result, as it shows that the process initiated by HFD in liver requires parenchymal NF-κB activation. Hepatocyte-specific inhibition of NF-κB is both necessary and sufficient to concomitantly attenuate insulin resistance (Fig. 5e) and the activation of both widely expressed inflammatory genes (Table 1) and macrophage-specific markers (Fig. 5g). Although additional studies will be required to determine the degree to which macrophages are causally involved as pathogenic mediators, our findings define a crucial and direct role for the hepatocyte in the pathogenesis of diet- and obesity-induced insulin resistance.
DISCUSSION
Abdominal adiposity, hepatic steatosis (fatty liver), and circulating evidence of low-grade, subacute inflammation are independently and collectively correlated with the development of insulin resistance, T2D and the metabolic syndrome. We now show that NF-κB, a master regulator of inflammation, is activated in rodent liver by two common models of obesity, HFD and genetic hyperphagia (ob/ob mice and fa/fa rats). We have mimicked this state of subacute inflammation in the absence of obesity or steatosis in a transgenic mouse model by selective hepatocellular activation of NF-κB. The degree of inflammation in the livers of LIKK mice was successfully matched to that seen in obesity. This approximately twofold activation of hepatic NF-κB is in contrast to the much greater, many-fold activation that typifies acute inflammatory reactions.
Subacute hepatocellular activation of NF-κB in LIKK mice caused profound hepatic insulin resistance and more moderate systemic insulin resistance. Perhaps most notable for understanding pathogenesis, similar gene sets were induced by HFD in wild-type liver and subacute activation of NF-κB in LIKK liver. Among several candidates, we chose IL-6 as a potential mediator because its message levels were elevated most in both HFD and LIKK mice and IL-6 concentrations in the circulation increased in parallel with transgene dose. IL-6 neutralization provided the strongest evidence of pathological involvement, as this restored insulin sensitivity to near normal levels.
The data provide solid evidence in support of a sequence of cellular and molecular events mediating hepatic insulin resistance in fatty liver: steatosis activates IKK-β and NF-κB, which upregulates IL-6 production and secretion. IL-6 works locally through paracrine and/or endocrine mechanisms to activate IL-6 signaling in liver. IL-6 is known to induce insulin resistance in hepatocytes19-23. Although many pieces of the pathogenic puzzle are still missing, including how steatosis activates IKK-β and NF-κB and how IL-6 mediates hepatic insulin resistance, it seems clear that IKK-β–NF-κB and IL-6 are in the pathway.
Hepatic production of IL-6 also provides a potential pathogenic link to extrahepatic organs and tissues such as muscle. NF-κB target genes are not upregulated in LIKK muscle, but IL-6 target genes are, including SOCS and Stat proteins. These were reversed during IL-6 neutralization, consistent with the pathogenic involvement of IL-6. In related studies we have activated (MIKK) and inhibited (MISR) NF-κB in muscle. Activation causes a severe syndrome of muscle wasting, but does not produce insulin resistance34. NF-κB inhibition concordantly protects against muscle wasting but does not affect insulin resistance34. Similarly, mice bearing muscle-specific deletion of IKK-β lack an overt phenotype, although the authors of this study incorrectly asserted that conditional inactivation in general does not prevent obesity-induced insulin resistance35. LIKK and LISR mice clearly show prominent conditional effects on insulin resistance.
Adipose tissue is increasingly appreciated as a synthetic source for potential inflammatory mediators of insulin resistance. Fat in the liver in the form of steatosis represents a second, potentially important but under-recognized site. Many inflammatory markers that have been associated with insulin resistance, T2D, metabolic syndrome and cardiovascular disease, including CRP, PAI-1 and fibrinogen, are in fact liver proteins. Our data now show that through the production of proinflammatory cytokines, including IL-6 and potentially IL-1β, hepatic inflammation can cause both local hepatic and systemic insulin resistance.
We have previously shown that salicylates, acting as inhibitors of IKK-β and NF-κB, could be used to treat insulin resistance and T2D12,13,30,36. Current findings reinforce that conclusion, as oral salicylate therapy reversed insulin resistance in LIKK mice. The utility of salicylates or more selective NF-κB inhibitors to treat fatty liver disease and steatohepatitis probably depends on the endpoint. Insulin resistance seems to be treatable. There is no available information about preventing the progression of steatohepatitis to fibrosis and cirrhosis, although insulin sensitizers such as metformin and thiazolidinediones are being investigated as potential treatments for these disorders37-39. In summary, the results presented here indicate that hepatic steatosis causes subacute hepatocellular inflammation. This in turn leads to the production of proinflammatory cytokines that mediate both local and systemic insulin resistance. These findings provide both mechanistic insights into pathogenesis and potential targets for treatment and prevention.
METHODS
Transgenic mice. We subcloned cDNAs encoding Flag-tagged, constitutively active24-26, human IKK-β (IKBKB) S177E,S181E or hemagglutinin-tagged human IκBα (NFKBIA) S32A,S36A superrepressor31 into a truncated β-globin expression vector40 having a 3.0-kb fragment of the mouse albumin (Alb1) promoter upstream from exon 1 (Fig. 1c). DNA was excised from the cloning vector, purified and microinjected into mouse oocytes, which were introduced into pseudopregnant females. We genotyped transgenic offspring by Southern analysis and PCR. At least two independent lines were obtained for both LIKK and LISR mice and each had the same phenotype. The mice were housed in groups of four per cage, maintained under alternating 12-h light and dark cycles and had free access to food and water. Animal experiments were conducted in accordance with the US National Institutes of Health guidelines under protocols approved by the Institutional Animal Care and Use Committee of the Joslin Diabetes Center.
Assays. We isolated IKK complexes from mouse liver lysates using anti-IKK-γ antibodies (PharMingen) coupled to protein A-Sepharose, and conducted in vitro kinase assays at 30 °C by adding [γ-32P]ATP and 2 μg of GST-IκBα (1-54)12. We determined NK-κB activity using electrophoretic mobility shift assay and enzyme-linked immunosorbent assay–based DNA binding methods41,42, blood glucose using a Glucometer Elite (Bayer), insulin and leptin (Crystal Chem Inc.) and nonesterified fatty acids (Dako), and triglycerides in 50-mg liver samples43 (Sigma) with the indicated kits. We determined plasma concentrations of cytokines, including IL-1β, IL-6 and TNF-α, using a mouse Luminex kit (Linco). The clinical laboratory at Children's Hospital in Boston measured serum salicylate, lactic acid dehydrogenase and alanine aminotransferase levels.
Hyperinsulinemic-euglycemic clamps. We performed the clamps in conscious mice following an overnight fast44, maintaining blood glucose concentrations (5.5 mM) during the 5-h, steady-state human insulin infusions (4 mU/kg/min) by infusing 20% glucose at variable rates. We initiated [3-3H]glucose and 2-deoxy-D-[1-14C]glucose (NEN) infusions during the final 1 h of the clamps to determine whole-animal glucose fluxes and tissue-specific glucose uptake, respectively. Liver, fat and muscle samples were rapidly removed and flash frozen in liquid nitrogen.
Western blotting. We homogenized animal tissues for 1.0 min at 4 °C in lysis buffer (30 mM HEPES, 150 mM NaCl, 1.0 mM phenylmethylsulfonyl fluoride, 3.0 μM aprotinin, 10 μM leupeptin, 5.0 μM pepstatin A, 25 mM benzamidine, 2 mM sodium vanadate, 5.0 mM glycerol phosphate, 100 mM NaF, 1.0 mM ammonium molybdate, 30 mM tetrasodium pyrophosphate, 5.0 mM EGTA, 10% glycerol and 1% Triton X-100, pH 7.4). Proteins were immunoprecipitated with appropriate antibodies, separated by SDS-PAGE, transferred to nitrocellulose membranes and identified by immunoblotting. Primary antibodies used included those directed against Flag (Strategene), hemagglutinin (Cell Signaling), phosphotyrosine (4G10, Upstate Biotechnology); phosphorylated Stat-3 and Stat-3 (Cell Signaling), IKK-β, IκBα, GSK3β, phosphorylated GSK3β, IRS-1, IRS-2 and insulin receptor α (Santa Cruz). Secondary, HRP-conjugated antibodies were specific for rabbit or mouse (Pierce).
Quantitative real-time RT-PCR. We extracted total RNA from frozen, pulverized mouse tissues using TRIzol (Invitrogen) and synthesized cDNA using oligo (dT) primers with the Advantage RT-for-PCR kit (BD Biosciences). Primers spanned intronic regions to generate 300–400-bp PCR products. We quantified PCR amplifications using SYBR Green PCR Master Mix (Applied Biosystems) and normalized results against TATA box binding protein (Tbp) and glyceraldehydes-3-phosphate dehydrogenase (Gapd) gene expression.
IL-6 neutralization and salicylate therapy. We administered antibody to IL-6 or isotype-matched nonimmune rat IgG (BD Biosciences) by tail vein injection (50 μg every other day for 10 d). We conducted glucose tolerance tests and other measures of insulin resistance 2 d after the last injection. Sodium salicylate (6 mg/ml) was dissolved in the drinking water (pH 7.0) and incorporated into the chow (0.5 mg/g). Mice were allowed free access to food and water.
Immunohistochemistry and morphometric analyses. We treated fixed sections of liver (6 μm) with goat antibody to mouse IL-6 (R&D) and rat antibody to mouse Cd68 (PharMingen), followed by FITC- and rhodamine-conjugated secondary antibodies (Jackson). Naive goat and rat IgG were used as negative controls. We took sections (6 μm) from paraffin-embedded pancreas (Bouins, Sigma) as full footprints to include head, body and tail of the organ. These were immunostained with guinea pig antibody to insulin and rabbit antibody to glucagon (Linco), followed by FITC- and Texas Red–conjugated secondary antibodies (Jackson). We calculated beta-cell mass according to the method of Weibel45 using NIH Image 1.60 analysis software.
Statistical analyses. Data are presented as mean ± s.e.m. Student t-tests were used for statistical analysis. P < 0.05 was considered significant.
Supplementary Material
ACKNOWLEDGMENTS
The authors wish to thank Y. Guo, E. Werner and B. C. Oh for suggestions and technical assistance. D.C. was supported by a Mentor-Based postdoctoral fellowship from the American Diabetes Association. These studies were funded by US National Institutes of Health grants R01 DK45493 and R01 DK51729 (S.E.S.), P30 DK36836 (Joslin Diabetes Center) and the Helen and Morton Adler Chair (S.E.S.).
Footnotes
Note: Supplementary information is available on the Nature Medicine website.
COMPETING INTERESTS STATEMENT
The authors declare that they have no competing financial interests.
References
- 1.Mokdad AH, et al. Prevalence of obesity, diabetes, and obesity-related health risk factors, 2001. JAMA. 2003;289:76–79. doi: 10.1001/jama.289.1.76. [DOI] [PubMed] [Google Scholar]
- 2.National Diabetes Data Group . Diabetes in America. 2nd National Institutes of Diabetes and Digestive Diseases, National Institutes of Health; Bethesda, Maryland: 1995. [Google Scholar]
- 3.Boden G, Shulman GI. Free fatty acids in obesity and type 2 diabetes: defining their role in the development of insulin resistance and beta-cell dysfunction. Eur. J. Clin. Invest. 2002;32(Suppl 3):14–23. doi: 10.1046/j.1365-2362.32.s3.3.x. [DOI] [PubMed] [Google Scholar]
- 4.Seppala-Lindroos A, et al. Fat accumulation in the liver is associated with defects in insulin suppression of glucose production and serum free fatty acids independent of obesity in normal men. J. Clin. Endocrinol. Metab. 2002;87:3023–3028. doi: 10.1210/jcem.87.7.8638. [DOI] [PubMed] [Google Scholar]
- 5.Ryysy L, et al. Hepatic fat content and insulin action on free fatty acids and glucose metabolism rather than insulin absorption are associated with insulin requirements during insulin therapy in type 2 diabetic patients. Diabetes. 2000;49:749–758. doi: 10.2337/diabetes.49.5.749. [DOI] [PubMed] [Google Scholar]
- 6.Kelley DE, McKolanis TM, Hegazi RA, Kuller LH, Kalhan SC. Fatty liver in type 2 diabetes mellitus: relation to regional adiposity, fatty acids, and insulin resistance. Am. J. Physiol. 2003;285:E906–E916. doi: 10.1152/ajpendo.00117.2003. [DOI] [PubMed] [Google Scholar]
- 7.Pickup JC, Crook MA. Is type II diabetes mellitus a disease of the innate immune system? Diabetologia. 1998;41:1241–1248. doi: 10.1007/s001250051058. [DOI] [PubMed] [Google Scholar]
- 8.Barzilay JI, Freedland ES. Inflammation and its relationship to insulin resistance, type 2 diabetes mellitus, and endothelial dysfunction. Metabolic Syndrome. 2003;1:55–67. doi: 10.1089/154041903321648252. [DOI] [PubMed] [Google Scholar]
- 9.Festa A, D'Agostino R, Jr., Tracy RP, Haffner SM. Elevated levels of acute-phase proteins and plasminogen activator inhibitor-1 predict the development of type 2 diabetes: the insulin resistance atherosclerosis study. Diabetes. 2002;51:1131–1137. doi: 10.2337/diabetes.51.4.1131. [DOI] [PubMed] [Google Scholar]
- 10.Hotamisligil GS. Inflammatory pathways and insulin action. Int. J. Obes. Relat. Metab. Disord. 2003;27(Suppl 3):S53–S55. doi: 10.1038/sj.ijo.0802502. [DOI] [PubMed] [Google Scholar]
- 11.Moller DE. Potential role of TNF-alpha in the pathogenesis of insulin resistance and type 2 diabetes. Trends Endocrinol. Metab. 2000;11:212–217. doi: 10.1016/s1043-2760(00)00272-1. [DOI] [PubMed] [Google Scholar]
- 12.Yuan M, et al. Reversal of obesity- and diet-induced insulin resistance with salicylates or targeted disruption of Ikkβ. Science. 2001;293:1673–1677. doi: 10.1126/science.1061620. [DOI] [PubMed] [Google Scholar]
- 13.Hundal RS, et al. Mechanism by which high-dose aspirin improves glucose metabolism in type 2 diabetes. J. Clin. Invest. 2002;109:1321–1326. doi: 10.1172/JCI14955. [DOI] [PMC free article] [PubMed] [Google Scholar]
- 14.Radziuk J. Insulin sensitivity and its measurement: structural commonalities among the methods. J. Clin. Endocrinol. Metab. 2000;85:4426–4433. doi: 10.1210/jcem.85.12.7025. [DOI] [PubMed] [Google Scholar]
- 15.Hotamisligil GS, Shargill NS, Spiegelman BM. Adipose expression of tumor necrosis factor-α: Direct role in obesity-linked insulin resistance. Science. 1993;259:87–91. doi: 10.1126/science.7678183. [DOI] [PubMed] [Google Scholar]
- 16.Feinstein R, Kanety H, Papa MZ, Lunenfeld B, Karasik A. Tumor necrosis factor-α suppresses insulin-induced tyrosine phosphorylation of insulin receptor and its substrates. J. Biol. Chem. 1993;268:26055–26058. [PubMed] [Google Scholar]
- 17.Pradhan AD, Manson JE, Rifai N, Buring JE, Ridker PM. C-reactive protein, interleukin 6, and risk of developing type 2 diabetes mellitus. JAMA. 2001;286:327–334. doi: 10.1001/jama.286.3.327. [DOI] [PubMed] [Google Scholar]
- 18.Spranger J, et al. Inflammatory cytokines and the risk to develop type 2 diabetes: results of the prospective population-based European Prospective Investigation into Cancer and Nutrition (EPIC)-Potsdam Study. Diabetes. 2003;52:812–817. doi: 10.2337/diabetes.52.3.812. [DOI] [PubMed] [Google Scholar]
- 19.Kanemaki T, et al. Interleukin 1beta and interleukin 6, but not tumor necrosis factor alpha, inhibit insulin-stimulated glycogen synthesis in rat hepatocytes. Hepatology. 1998;27:1296–1303. doi: 10.1002/hep.510270515. [DOI] [PubMed] [Google Scholar]
- 20.Klover PJ, Zimmers TA, Koniaris LG, Mooney RA. Chronic exposure to interleukin-6 causes hepatic insulin resistance in mice. Diabetes. 2003;52:2784–2789. doi: 10.2337/diabetes.52.11.2784. [DOI] [PubMed] [Google Scholar]
- 21.Rotter V, Nagaev I, Smith U. Interleukin-6 (IL-6) induces insulin resistance in 3T3-L1 adipocytes and is, like IL-8 and tumor necrosis factor-alpha, overexpressed in human fat cells from insulin-resistant subjects. J. Biol. Chem. 2003;278:45777–45784. doi: 10.1074/jbc.M301977200. [DOI] [PubMed] [Google Scholar]
- 22.Lagathu C, et al. Chronic interleukin-6 (IL-6) treatment increased IL-6 secretion and induced insulin resistance in adipocyte: prevention by rosiglitazone. Biochem. Biophys. Res. Commun. 2003;311:372–379. doi: 10.1016/j.bbrc.2003.10.013. [DOI] [PubMed] [Google Scholar]
- 23.Kim HJ, et al. Differential effects of interleukin-6 and -10 on skeletal muscle and liver insulin action in vivo. Diabetes. 2004;53:1060–1067. doi: 10.2337/diabetes.53.4.1060. [DOI] [PubMed] [Google Scholar]
- 24.Delhase M, Hayakawa M, Chen Y, Karin M. Positive and negative regulation of IκB kinase activity through IKKβ subunit phosphorylation. Science. 1999;284:309–313. doi: 10.1126/science.284.5412.309. [DOI] [PubMed] [Google Scholar]
- 25.Mercurio F, et al. IkappaB kinase (IKK)-associated protein 1, a common component of the heterogeneous IKK complex. Mol. Cell Biol. 1999;19:1526–1538. doi: 10.1128/mcb.19.2.1526. [DOI] [PMC free article] [PubMed] [Google Scholar]
- 26.Ling L, Cao Z, Goeddel DV. NF-kappaB-inducing kinase activates IKK-alpha by phosphorylation of Ser-176. Proc. Natl. Acad. Sci. USA. 1998;95:3792–3797. doi: 10.1073/pnas.95.7.3792. [DOI] [PMC free article] [PubMed] [Google Scholar]
- 27.Starnes HF, Jr., et al. Anti-IL-6 monoclonal antibodies protect against lethal Escherichia coli infection and lethal tumor necrosis factor-alpha challenge in mice. J. Immunol. 1990;145:4185–4191. [PubMed] [Google Scholar]
- 28.Abrams JS, et al. Strategies of anti-cytokine monoclonal antibody development: immunoassay of IL-10 and IL-5 in clinical samples. Immunol. Rev. 1992;127:5–24. doi: 10.1111/j.1600-065x.1992.tb01406.x. [DOI] [PubMed] [Google Scholar]
- 29.Haddad E, et al. Treatment of B-lymphoproliferative disorder with a monoclonal anti-interleukin-6 antibody in 12 patients: a multicenter phase 1-2 clinical trial. Blood. 2001;97:1590–1597. doi: 10.1182/blood.v97.6.1590. [DOI] [PubMed] [Google Scholar]
- 30.Shoelson SE, Lee J, Yuan M. Inflammation and the IKKβ/IκB/NF-κB axis in obesity- and diet-induced insulin resistance. Int. J. Obes. Relat. Metab. Disord. 2003;27(Suppl 3):S49–S52. doi: 10.1038/sj.ijo.0802501. [DOI] [PubMed] [Google Scholar]
- 31.Van Antwerp DJ, Martin SJ, Kafri T, Green DR, Verma IM. Suppression of TNF-alpha-induced apoptosis by NF-kappaB. Science. 1996;274:787–789. doi: 10.1126/science.274.5288.787. [DOI] [PubMed] [Google Scholar]
- 32.Weisberg SP, et al. Obesity is associated with macrophage accumulation in adipose tissue. J. Clin. Invest. 2003;112:1796–1808. doi: 10.1172/JCI19246. [DOI] [PMC free article] [PubMed] [Google Scholar]
- 33.Xu H, et al. Chronic inflammation in fat plays a crucial role in the development of obesity-related insulin resistance. J. Clin. Invest. 2003;112:1821–1830. doi: 10.1172/JCI19451. [DOI] [PMC free article] [PubMed] [Google Scholar]
- 34.Cai D, et al. IKKβ/NF-κB activation causes severe muscle wasting in mice. Cell. 2004;119:285–298. doi: 10.1016/j.cell.2004.09.027. [DOI] [PubMed] [Google Scholar]
- 35.Rohl M, et al. Conditional disruption of IkappaB kinase 2 fails to prevent obesity-induced insulin resistance. J. Clin. Invest. 2004;113:474–481. doi: 10.1172/JCI18712. [DOI] [PMC free article] [PubMed] [Google Scholar]
- 36.Shoelson S. Invited comment on W. Ebstein: on the therapy of diabetes mellitus, in particular on the application of sodium salicylate. J. Mol. Med. 2002;80:618–619. [PubMed] [Google Scholar]
- 37.Marchesini G, et al. Metformin in non-alcoholic steatohepatitis. Lancet. 2001;358:893–894. doi: 10.1016/s0140-6736(01)06042-1. [DOI] [PubMed] [Google Scholar]
- 38.Neuschwander-Tetri BA, Brunt EM, Wehmeier KR, Oliver D, Bacon BR. Improved nonalcoholic steatohepatitis after 48 weeks of treatment with the PPAR-gamma ligand rosiglitazone. Hepatology. 2003;38:1008–1017. doi: 10.1053/jhep.2003.50420. [DOI] [PubMed] [Google Scholar]
- 39.Promrat K, et al. A pilot study of pioglitazone treatment for nonalcoholic steatohepatitis. Hepatology. 2004;39:188–196. doi: 10.1002/hep.20012. [DOI] [PubMed] [Google Scholar]
- 40.Brinster RL, Allen JM, Behringer RR, Gelinas RE, Palmiter RD. Introns increase transcriptional efficiency in transgenic mice. Proc. Natl. Acad. Sci. USA. 1988;85:836–840. doi: 10.1073/pnas.85.3.836. [DOI] [PMC free article] [PubMed] [Google Scholar]
- 41.DiDonato JA, Mercurio F, Karin M. Phosphorylation of I kappa B alpha precedes but is not sufficient for its dissociation from NF-kappa B. Mol. Cell Biol. 1995;15:1302–1311. doi: 10.1128/mcb.15.3.1302. [DOI] [PMC free article] [PubMed] [Google Scholar]
- 42.Li N, Karin M. Signaling pathways leading to nuclear factor-kappa B activation. Methods Enzymol. 2000;319:273–279. doi: 10.1016/s0076-6879(00)19027-5. [DOI] [PubMed] [Google Scholar]
- 43.Burant CF, et al. Troglitazone action is independent of adipose tissue. J. Clin. Invest. 1997;100:2900–2908. doi: 10.1172/JCI119839. [DOI] [PMC free article] [PubMed] [Google Scholar]
- 44.Kim JK, et al. Prevention of fat-induced insulin resistance by salicylate. J. Clin. Invest. 2001;108:437–446. doi: 10.1172/JCI11559. [DOI] [PMC free article] [PubMed] [Google Scholar]
- 45.Weibel ER. Academic Press; London: 1979. Sterelogical Methods. [Google Scholar]
Associated Data
This section collects any data citations, data availability statements, or supplementary materials included in this article.