

Abstract
Proteomic profiling with SELDI-TOF MS has facilitated the discovery of disease-specific protein profiles. However, multicenter studies are often hindered by the logistics required for prompt deep-freezing of samples in liquid nitrogen or dry ice within the clinic setting prior to shipping. We report high concordance between MS profiles within sets of quadruplicate split urine and serum samples deep-frozen at 0, 2, 6, and 24 h after sample collection. Gage R&R results confirm that deep-freezing times are not a statistically significant source of SELDI-TOF MS variability for either blood or urine.
Keywords: Repeatability, Reproducibility, SELDI, Serum, Urine
Abbreviation: SPA, Sinapic acid
SELDI-TOF MS has facilitated the discovery of disease-specific protein profiles that hold tremendous promise for the development of diagnostic and prognostic biomarkers. This work is most crucial in oncology, in which early diagnosis and implementation of effective therapy can make a significant difference in outcomes [1–5]. SELDI-TOF MS has also been used to study biomarkers in nononcologic diseases, such as Alzheimer’s Disease [6] and renal allograft rejection [7–9]. Multicenter clinical studies are often required to facilitate the inclusion of sufficient sample sizes to provide adequate power for model training and testing. This is particularly true for pediatric studies for which large sample sizes are often lacking, even when these studies are conducted within major tertiary care pediatric centers.
Our group has developed procedures to significantly improve the intraassay CVs, in order to generate reliable and reproducible protein profiles from SELDI-TOF MS. We have also reported that up to five freeze-thaw cycles of plasma samples did not deteriorate the CVs significantly [10]. Likewise, we found that varying the clotting times of plasma between 30 min and 12 h did not lead to statistically significant differences [10]. It is widely advocated that sample storage conditions are important to preserve the integrity of protein content within biologic samples. However, it has been our experience that the logistics of appropriate sample collection, deep-freezing in either liquid nitrogen or dry ice, and shipping to ensure proper preservation can be overwhelming for participating clinical trial centers, to the point that these centers will not obtain appropriate samples from recruited research subjects. Intrinsic and extrinsic factors that affect SELDI-TOF MS spectra in urine have been reported, including excessive freeze-thaw cycles, midstream versus first-void urine in women, and the presence of microscopic hematuria [11]. We are now reporting the effect of time until deep-freezing of urine and serum samples on SELDI-TOF MS spectra.
We collected a single blood sample and a single urine sample from one healthy adult volunteer. Urine was centrifuged for 5 min at 2500 rpm. Blood was allowed to stand at room temperature for 20 min to allow clotting and then centrifuged for 10 min at 2500 rpm. Urine supernatant and serum were collected in multiple 1 mL aliquots and refrigerated at 4°C until they were transferred via dry ice to the −80°C freezer. Samples were transferred four times following collection: immediately after centrifugation (time 0), and at 2, 6, and 24 h.
Samples were prepared for application on CM10 (cationic) and IMAC30 (anionic) ProteinChip™ (Ciphergen, Fremont, CA) arrays and for analysis by SELDI-TOF MS. Samples were mixed with a denaturing solution of 8 M urea and CHAPS (U8 + 2). Serum was prepared by mixing 32 μL of serum with 48 μL of U8 + 2 for a total volume of 80 μL. Urine was prepared by adding 60 μL of sample with 22.5 μL of U8 + 2 for a total volume of 82.5 μL. To assess the impact of urinary pH on protein peaks, we adjusted urine samples to pH 4.5, 5.5, 6.5, and 7.5. Aliquots of these preparations were subjected in duplicate to SELDI-TOF MS with weak cationic exchange (CM10) ProteinChip arrays. The resulting spectra reveal a decreasing number of protein peaks with higher pH (Fig. 1). This effect was much less pronounced on the IMAC30 (anionic) and H50 (hydrophobic) arrays (data not shown). Therefore, urine samples to be applied to CM10 chips were normalized to a pH of 4.5 with glacial acetic acid.
Figure 1.
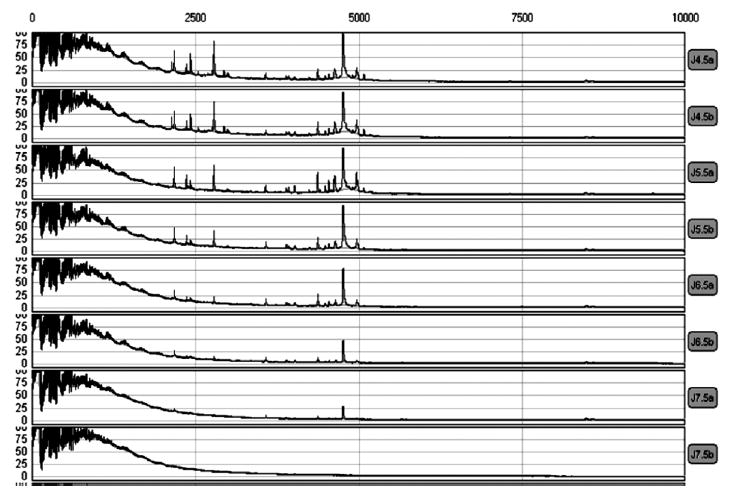
SELDI-TOF MS spectra demonstrating the reduction in peaks in urine samples with higher pH values from CM10 ProteinChips. pH ranged from 4.5 (top) to 7.5 (bottom).
Samples were placed into a 96-well plate until application onto the chips. CM10 chips were activated by gently agitating the chip in a 15 mL conical tube in 10 mM HCl for 5 min, followed by rinsing with 10 mL of Millipore-deionized water in a similar fashion. Chips were then allowed to air dry.
Chips were placed in the bioprocessor assembly and set within the Biomek FX robot (Beckman Coulter). The IMAC30 chips were charged with 0.1 M CuSO4 solution. After completion of the charging step, the bioprocessor was removed from the robot, inverted, and spun at 1300 rpm for 1 min to remove any additional liquid. The bioprocessor was returned to the robot and the chips were washed with water, followed by wash/binding buffer. For the IMAC30 chip, the wash/binding buffer consisted of 0.5 M NaCl and 0.1 M NaH2PO4 at a pH of 7. The buffer for the CM10 chip was 20 mM ammonium acetate and 0.1% Triton X-100 solution at a pH of 6.2. After each step, the robot removed the volume of solution to waste.
The samples were then applied to the chip spots in quadruplicate from each sample type and storage condition. The sample plate was placed in the robot, and the robot dispensed 30 μL of wash/binding buffer and 30 μL of sample into each well/spot and agitated for 1 h. This was followed by another wash/binding buffer step, another water wash step, and removal of the remaining volume. The bioprocessor was again removed and spun at 1300 rpm for 1 min to remove remaining droplets. The reservoir was then removed from the bioprocessor and the chips were allowed to air dry.
The energy-absorbing matrix was prepared for the chips. Sinapic acid (SPA) was used as the matrix. A solvent was prepared of 450 μL of deionized water, 500 μL of ACN, and 50 μL of 10% TFA. SPA powder was mixed with 425 μL of the solvent and vortexed for 2 min, followed by centrifugation for 3 min. Three hundred and twenty-five microliters of SPA/solvent mixture was added to 325 μL of remaining solvent to create a 1:1 dilution of matrix. Twenty-five microliters of matrix solution was then aliquotted into a 96-well plate to be applied to the dry ProteinChips. The bioprocessor, containing dry ProteinChips, was returned to the robot and the SPA matrix solution applied to the chips.
Prior to ionizing the samples, the SELDI-TOF analyzer was calibrated with peptides and proteins of known mass. For the low protocol (2000–20 000 Da), the following peptides were used for calibration: beta-endorphin, bovine insulin, and bovine ubiquitin. For the high protocol (10 000–40 000 Da), the following proteins were used: bovine cytochrome C, bovine beta-lactoglobulin A, horse-radish peroxidase, and bovine albumin. The laser settings for the low protocol were a sensitivity of 8 and intensity of 257. The high protocol laser settings were a sensitivity of 8 and intensity of 275. SELDI-TOF MS was performed on the prepared chips. Each spot underwent two series of SELDI-TOF MS to assess proteins of low (2000–20 000 Da) and high (10 000–40 000 Da) mass/charge ratios. The following are the numbers of peaks obtained for each chip type and protocol. For serum, the number of peaks were CM10 Low 78, CM10 High 69, IMAC30 Low 106, IMAC30 High 51. For urine, the number of peaks obtained were CM10 Low 63, CM10 High 76, IMAC30 Low 103, IMAC30 High 63.
All computational analyses were performed within the R statistical programming environment (http://www.r-project.org). We normalized each spectrum by the probability distribution method [12]. For the purpose of performing concordance tests on discretized MS peaks, we utilized a novel approach to distinguish presumed true peaks from noise: we calculated peak-defining intensity thresholds from the nadir of the bimodal distribution of each spectrum’s intensities. We propose that the distribution of intensity values across a given SELDI spectrum is bimodal, and that the distribution’s nadir intensity is a data-driven threshold for the minimum intensity that constitutes a peak. This approach has the value of obviating the need to select arbitrary thresholds, such as selecting the maximum peak within a user-defined number of nearest peaks [13]. Therefore, we calculated each chip’s intensity threshold as the nadir intensity value for that chip. Figure 2 shows a representative MS spectrum before and after the application of this “noise-reduction” technique.
Figure 2.
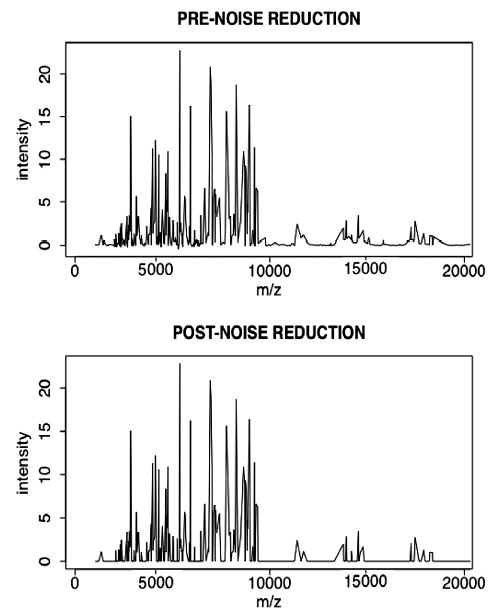
A representative MS spectrum of a urine sample before and after application of a noise-reduction approach for which the peak-defining threshold is based upon the nadir of the bimodal distribution of the spectrum’s MS intensities.
For urine and serum, concordance with time 0 samples was calculated for each of the freezing times for each chip environment. The following procedures were performed for each sample type and chip type: Using the noise-reduced MS peak data, for each m/z value, we tallied the number of peaks above the threshold across quadruplicate spectra within each freezing time. We then calculated the pairwise difference between the time 0 spectrum tallies and each freezing time’s tallies. For each time 0 to time × freezing time tallies difference, we totaled the number of peaks for which the difference was ≤1. In other words, we totaled the number of peaks for which the time 0 and freezing time were in agreement for at least three of the four replicates. Taking this number as a percentage of the total number of m/z values yielded the concordance value for the specific sample type and chip environment. The concordance values for each sample type–chip environment combination are shown in Fig. 3 and representative spectra are shown in Fig. 4. These values suggest that concordance does not appear to significantly depreciate with increasing freezing time, although concordance was reduced in the serum samples at 24 h.
Figure 3.
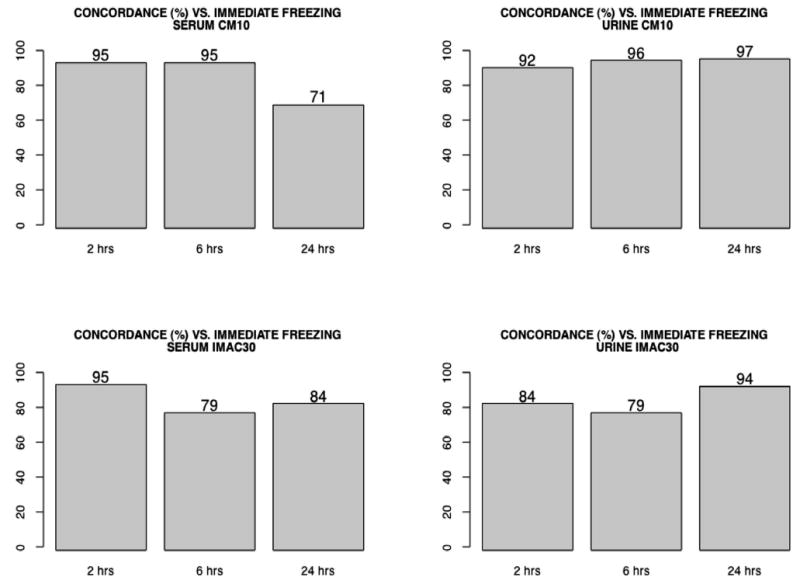
Concordance rates between each freezing time and the respective time 0 MS spectra, for each sample type (serum, urine) and each chip type (CM10, IMAC30).
Figure 4.
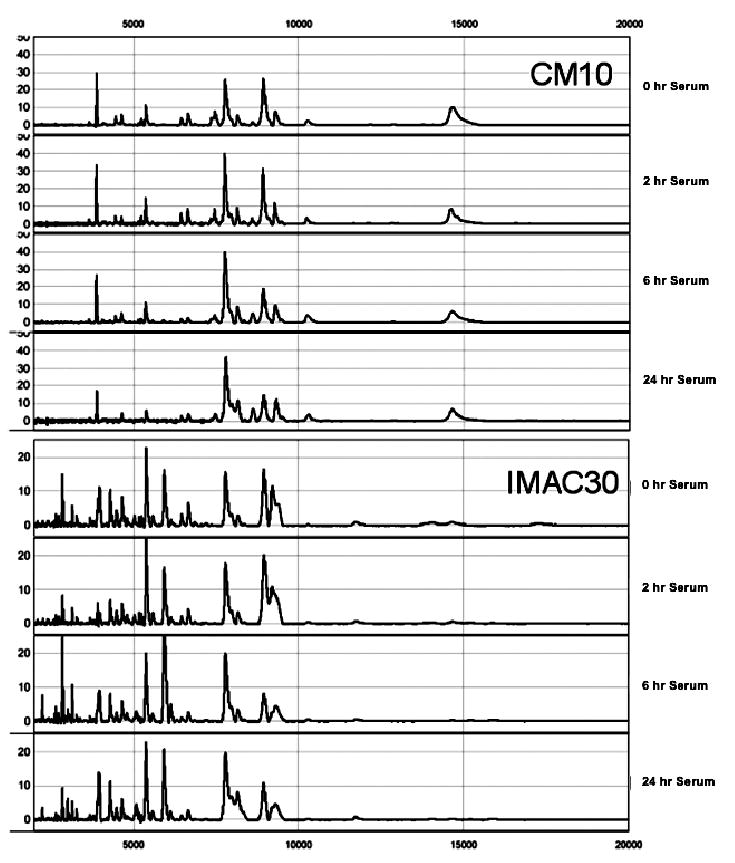
Sample SELDI-TOF spectra from CM10 and IMAC30 chips obtained on serum at all freezing times.
We performed gage repeatability and reproducibility (gage R&R) analysis of our normalized, non-noise-reduced data to determine whether the different freezing times are a significant source of variation in MS spectra. We utilized the analysis of variance method of gage R&R as described in the tutorial available online from Engineered Software, at http://www.engineeredsoftware.com/papers/msa_rr.pdf. We implemented these calculations in the R programming environment and verified our procedures against the sample data contained within the tutorial. For the purpose of this gage R&R analysis, each freezing time is considered an “appraiser/operator”, each m/z value is a “part”, and each replicate spectrum is a “trial”. Because the number of parts far exceeds the recommended number of parts for gage R&R in the tutorial, we limited the number of m/z peaks to a total of 10. In order to uncover any potential source of variation, we chose the 10 m/z peaks with the highest variance across all spectra within a given sample type and chip environment. The resultant F statistics and p values for the appraisers and parts, for each sample type and chip environment, are shown in Table 1. These results suggest that the freezing times are not a significant source of variation in SELDI-TOF MS in either urine or serum for both chip environments tested. As we expected, the parts (m/z values) are the major source of variation within the spectra. This finding also shows that the consistency between the groups are not an artifact resulting from a smoothing effect induced by the normalization procedures because the intrinsic variability of the m/z values is still significant (p = 0.002 to <0.00001).
Table 1.
Freezing times (appraisers) and m/z values (parts) F statistics and p values from gage R&R analysis. Freezing times are not a significant source of variation while the m/z values are a significant source of variation
| Serum: CM10 | Urine: CM10 | Serum IMAC30 | Urine: IMAC30 | |
|---|---|---|---|---|
| Freeze times: F statistic | 0.21 | 1.85 | 0.04 | 0.61 |
| Freeze times: p value | 0.89 | 0.14 | 0.99 | 0.61 |
| m/z values: F statistic | 34.06 | 456.31 | 5.31 | 12.24 |
| m/z values: p value | <0.00001 | <0.00001 | 0.002 | <0.00001 |
In conclusion, we have shown that refrigerated storage of urine or serum for up to 24 h prior to deep-freezing does not significantly affect m/z concordance or variability across spots or samples. These data support simplified protocols for clinical investigators to acquire urine and serum samples for proteomics studies as part of multicenter investigations, most notably by eliminating the requirement for local expertise in the handling of dry ice or liquid nitrogen. Inclusion of large numbers of diverse subjects from multiple centers is crucial to sufficiently power translational proteomics investigations.
Acknowledgments
This work was supported in part by NIH Training Grant T32 DK 007726 (A.Z.T.) and by NIH Grant K23 RR 16080 (A.D.S.).
References
- 1.Petricoin EF, Ardekani AM, Hitt BA, Levine PJ, et al. Lancet. 2002;359:572–577. doi: 10.1016/S0140-6736(02)07746-2. [DOI] [PubMed] [Google Scholar]
- 2.Becker S, Cazares LH, Watson P, Lynch H, et al. Ann Surg Oncol. 2004;11:907–914. doi: 10.1245/ASO.2004.03.557. [DOI] [PubMed] [Google Scholar]
- 3.Wong YF, Cheung TH, Lo KW, Wang VW, et al. Cancer Lett. 2004;211:227–234. doi: 10.1016/j.canlet.2004.02.014. [DOI] [PubMed] [Google Scholar]
- 4.Won Y, Song HJ, Kang TW, Kim JJ, et al. Proteomics. 2003;3:2310–2316. doi: 10.1002/pmic.200300590. [DOI] [PubMed] [Google Scholar]
- 5.Ornstein DK, Rayford W, Fusaro VA, Conrads TP, et al. J Urol. 2004;172:1302–1305. doi: 10.1097/01.ju.0000139572.88463.39. [DOI] [PubMed] [Google Scholar]
- 6.Lewczuk P, Esselmann H, Groemer TW, Bibl M, et al. Biol Psychiatry. 2004;55:524–530. doi: 10.1016/j.biopsych.2003.10.014. [DOI] [PubMed] [Google Scholar]
- 7.Clarke W, Silverman BC, Zhang Z, Chan DW, et al. Ann Surg. 2003;237:660–664. doi: 10.1097/01.SLA.0000064293.57770.42. discussion 4–5. [DOI] [PMC free article] [PubMed] [Google Scholar]
- 8.Schaub S, Rush D, Wilkins J, Gibson IW, et al. J Am Soc Nephrol. 2004;15:219–227. doi: 10.1097/01.asn.0000101031.52826.be. [DOI] [PubMed] [Google Scholar]
- 9.O’Riordan E, Orlova TN, Mei JJ, Butt K, et al. J Am Soc Nephrol. 2004;15:3240–3248. doi: 10.1097/01.ASN.0000145241.83482.68. [DOI] [PubMed] [Google Scholar]
- 10.Aivado M, Spentzos D, Alterovitz G, Otu HH, et al. Clin Chem Lab Med. 2005;43:133–140. doi: 10.1515/CCLM.2005.022. [DOI] [PubMed] [Google Scholar]
- 11.Schaub S, Wilkins J, Weiler T, Sangster K, et al. Kidney Int. 2004;65:323–332. doi: 10.1111/j.1523-1755.2004.00352.x. [DOI] [PubMed] [Google Scholar]
- 12.Kohane, I. S., Kho, A. T., Butte, A. J., Microarrays for an Integrative Genomics, MIT Press, Cambridge, MA 2003, pp. 122–125.
- 13.Yasui Y, Pepe M, Thompson ML, Adam BL, et al. Biostatistics. 2003;4:449–463. doi: 10.1093/biostatistics/4.3.449. [DOI] [PubMed] [Google Scholar]