

Abstract
In the nervous system, homophilic and heterophilic adhesion molecules participate in the induction and differentiation of presynaptic transmitter release sites. We focus on the heterophilic interaction between postsynaptic neuroligin-1 (Nlg) and presynaptic β-neurexin (Nrx). Nlg has previously been shown to trigger presynaptic differentiation in a Nrx-expressing axon even when presented on a non-neuronal cell or on beads coated with lipid bilayers. We have now developed a new method to measure single molecule and ensemble distribution of Nrx and Nlg at the contact site between a non-neuronal Nrx-expressing cell and a flat supported glycosylphosphoinositol–neuroligin-1 (GPI-Nlg) lipid bilayer and relate them to adhesion as measured by cell migration and gravity dissociation. We find that within minutes after cell-bilayer contact, Nrx accumulates at the contact site and the contact area is expanded. The strength of cell-bilayer adhesion depends on the morphology of Nrx accumulation, with the focal concentration strengthening adhesion. The results suggest that Nlg-Nrx interaction rapidly establishes a weak, but specific, adhesion between dynamic pre- and postsynaptic processes, which may ultimately require additional molecules for synapse stabilization.
Adhesion proteins present on the surface of a neuron are instrumental to the recognition and creation of synaptic connections with appropriate partner cells1-3. The extracellular domains of those adhesion proteins bind selectively to cognate adhesion proteins in partner cells, whereas their internal domains bind to cytoplasmic scaffolding proteins. Such a transcellular molecular bridge between signaling systems inside the two cells leads to the organization of the neuronal synapse1-3. Molecular interactions can be mediated by homophilic adhesion molecules, such as NCAM4,5, N-cadherins6,7 and syncam8, or by heterophilic adhesion molecules, such as integrins, or post-synaptic Nlg interacting with presynaptic Nrx9-13. Syncam and Nlg-Nrx are the only known pairs whose interactions trigger presynaptic differentiation8,12,13. We have focused our attention on the heterophilic interaction between Nlg and Nrx.
Nlg and Nrx bind in a calcium-dependent fashion in a stoichiometric ratio of 1:1 (ref. 10). Non-neuronal cells expressing Nrx aggregate with non-neuronal cells expressing Nlg, recruiting Nlg and Nrx to the cell-cell contact10,13. In addition, contact between a non-neuronal Nlg-expressing cell and a Nrx-bearing axon of a primary cultured neuron is sufficient to trigger presynaptic differentiation in the axon at the contact site12-15. The accepted model is that, during development, an encounter between presynaptic axons and cognate postsynaptic dendrites results in the binding of adhesion proteins between the two membranes. Subsequently, the transmitter release apparatus is assembled at the contact zone in the axon and the receptor complex in the dendrite. It is not clear, however, whether a Nlg-Nrx adhesion is formed with sufficient speed and has sufficient strength to overcome the cytoskeletal dynamics that constantly extend and retract filopodial expansions that lead to cell-cell contact, or whether other membrane proteins are required. Our goal is to study the intrinsic binding properties of Nrx and Nlg in the absence of endogenous binding proteins present in neurons and dissect apart the biophysical events that lead to neuronal synapse organization.
To understand the dynamics and adhesion of Nlg-Nrx interaction during the initial step of synapse formation, we visualize proteins distribution at the single molecule and ensemble level and relate it to a quantitative measure of the strength of cell-cell adhesion. Single-molecule imaging requires total internal reflection (TIRF) microscopy16,17 to achieve a low fluorescence background. However, TIRF requires the cell surface under study to be located within 0.1 μm of an optically transparent coverslip. Thus it is not possible to visualize the junction between two cells using TIRF, even when their processes are very thin. To overcome this geometric constraint, a planar fluid lipid bilayer deposited on a silica substrate containing a GPI-linked protein ectodomain can be used as a surrogate for one of the cells18. Planar supported lipid bilayers have mechanical and chemical properties similar to those of native cell membranes and maintain a natural environment for incorporated proteins to preserve their functionality. The lipid bilayer composition can be chosen to minimize nonspecific binding that could obscure the cell binding assay or cellular response19. This approach brings the two membranes into sufficiently close proximity to the coverslip for TIRF. It has been proven essential in studies of the immune synapse, in particular for deciphering the structural variation between different types of immune synapses18. We have adapted this method to study Nlg-Nrx interactions.
Although Nlg is a transmembrane protein with intracellular and extracellular binding domains, it has been shown that the Nlg ectodomain maintains the properties of the full-length protein, which are required for synaptic activity13. A GPI linker can be inserted in place of the single transmembrane domain to anchor the Nlg ectodomain in a fluid supported lipid bilayer and allow it to diffuse freely. Beads coated with lipid bilayers containing the GPI-linked Nlg ectodomain (GPI-Nlg) have been shown to trigger presynaptic differentiation in axons13 and can thus serve as a surrogate for the postsynaptic cell. The absence of endogenous postsynaptic proteins allows us to focus on the intrinsic binding properties of Nrx to Nlg.
Here, we present a real-time study of interactions between membrane-bound GPI-Nlg and Nrx. A supported lipid bilayer containing GPI-Nlg was formed on the flat glass bottom of a microchamber onto which Nrx-expressing cells were dropped. This model system allows us to track fluorescently labeled Nrx in the cell and GPI-Nlg in the lipid bilayer and to examine their redistribution upon cell-bilayer contact. In addition, this micro-chamber design allows us to assess the adhesive strength of the contact through two low-force assays: cell displacement and dissociation by gravitational force. This approach enables us to relate adhesive strength to Nlg and Nrx redistribution at the membrane contact site. We find that the proteins redistribute rapidly to form adhesion points and that the adhesive force depends on the protein distribution. Nlg-Nrx adhesion is weak, suggesting that long-term synapse stabilization requires additional proteins.
RESULTS
To investigate the properties of interaction between membranes containing postsynaptic Nlg protein and presynaptic Nrx, lipid bilayers containing GPI-Nlg were deposited on a glass coverslip. The fluid membrane incorporating the GPI-Nlg serves as a surrogate postsynaptic cell. Nrx expressing HEK293 cells served as surrogate presynaptic cells. This system allows exclusive study of the Nlg-Nrx interaction in the absence of pre and postsynaptic scaffolding proteins or additional adhesion molecules. The flat optically clear glass substrate allows for real time observations of changes in the distribution of GPI-Nlg labeled with Alexa-555, and of a green fluorescent protein fusion of Nrx (GFP- Nrx) in the contacting HEK293 cell. The fluid supported lipid bilayers were formed by fusion of GPI-Nlg proteoliposomes to the glass bottom of a micro–chamber (Fig. 1a).
Figure 1.

Reconstitution of GPI-Nlg in a fluid-supported lipid bilayer. (a) 100-nm SUVs incorporated with Alexa-555–labeled GPI-Nlg form a supported lipid bilayer by fusion with an etched clean glass surface. (b) Alexa-555–GPI-Nlg protein diffusing in the supported lipid bilayer imaged by TIRF for 3 s at 80 frames per second. Each bright spot corresponds to a single protein. (c) Corresponding single-molecule trajectories. Scale bars, 5 μm. (d) Averaged mean squared displacement calculated for all trajectories. For time intervals <1 s, the mean squared displacement is a linear function of time as expected for two-dimensional thermal diffusion. A linear fit to the mean squared displacement led to a translational diffusion coefficient of 1.10 ± 0.01 μm2 s−1 for the GPI-Nlg protein. Irreversible photobleaching of the fluorophores shorten the fluorescent tracks, leaving fewer than ten trajectories for time intervals >1 s, which increases the uncertainty on the mean squared displacement for t > 1 s.
Individual molecules of Alexa-555-labeled GPI-Nlg incorporated into the bilayer were imaged with a CCD camera using TIRF. In the absence of cells, we counted ∼100 randomly distributed fluorescent spots at a time for 289 μm2 field of view. Single molecule analysis revealed that most of the fluorescent features detected were of similar size and brightness (7 pixels across and a brightness of ∼1,000 arbitrary units of the CCD) (Supplementary Methods online), suggesting that each fluorescent spot corresponds to a single Alexa-555-labeled GPI-Nlg. This density is similar to the density of 1 to 6 proteins per μm2 estimated for this preparation by bulk fluorescence spectroscopy of HA-antibody bound to GPI-Nlg (M.M. Baksh, C. Dean, S. Pautot, S. DeMaria, E.Y.I. & J.T.G., unpublished data). Transiently fluorescent spots that were both brighter and larger were observed, consistent with the presence of two or more molecules briefly located too close to one another to be optically resolved. The low density of labeled protein (Fig. 1b) enabled us to track individual GPI-Nlg molecules as they diffused in the bilayer (Fig. 1c). About 85% of the fluorescent molecules could be followed for 1 s before irreversible photobleaching occurred, providing long enough trajectories to determine GPI-Nlg mobility from frame-to-frame single-molecule tracking. A plot of mean squared displacement versus time produced a curve consistent with free diffusion (Fig. 1d), from which we estimated a diffusion coefficient of 1.10 μm2 s−1 ± 0.01 μm2 s−1 by fitting the initial slope with a line. This value is similar to the diffusion coefficient of ∼2 μm2 s−1 ± 1 μm2 s−1 separately estimated using fluorescence intensity autocorrelation analysis (data not shown), and these values are in agreement with values reported for individual lipid molecules and other GPI-linked proteins diffusing in supported lipid bilayers (0.2–1.3 μm2 s−1)20-22. This diffusion coefficient indicates that GPI-Nlg proteins are properly incorporated into the supported lipid bilayers and that they diffuse laterally freely without significant aggregation. This result suggests that although the free Nlg ectodomain oligomerizes in solution, the GPI-Nlg spends little time in the oligomeric state.
Protein accumulation at the Nrx-cell-Nlg-bilayer contact zone
Having established the integrity of the GPI-Nlg lipid bilayers, we used confocal microscopy to visualize how interaction between Nlg in one membrane and Nrx in an opposing membrane influences their respective distributions. Cells expressing GFP-Nrx were dropped onto a supported lipid bilayer and the contact zones were imaged starting ∼10 min after all cells settled on the bilayer. We measured the contact area between the cell and bilayer using confocal microscopy to image GFP-Nrx in an optical slice at the level of the bilayer (Supplementary Methods). Because the contact area varies with the cell size, we normalized for cell size by calculating the ratio between the contact site area and the cell equatorial area. The results of these measurements with GFP-Nrx are described below. Similar results were obtained by using the lipophilic dialkylaminostyryl (DiA) dye to stain the membrane of the GFP-Nrx cell (data not shown).
GFP-Nrx distribution in cells on a supported lipid bilayer made of 1-palmitoyl-2-oleoyl-sn-glycero-3-phosphocholine (POPC) without GPI-Nlg was confined to a contact region of approximately half the equatorial area of the cell (Fig. 2a) (Acontact/Aequatorial = 0.49, s.e.m. = 0.06, n = 11). In contrast, the GFP-Nrx contact zone for cells dropped onto a POPC bilayer containing GPI-Nlg was significantly larger (P < 0.1), covering approximately two-thirds of the equatorial area of the cell (Acontact/Aequatorial = 0.67, s.e.m. = 0.03, n = 14) (Fig. 2b). The larger contact area and the recruitment of Nrx to the contact zone are in agreement with previous observations at adhesion zones between cells expressing the two proteins13.
Figure 2.

Distribution of GFP-Nrx in a HEK293 cell in contact with GPI-Nlg–supported lipid bilayer. (a,b) Confocal microscopy images of GFP-Nrx at the cell-bilayer contact extracted from the z series for a supported POPC bilayer without (a) and with GPI-Nlg (b). Scale bar, 5 μm. The rainbow scale was established such that red corresponds to the maximum GFP fluorescence intensity at the equatorial plane, where the protein concentration is maximal, and blue corresponds to the background fluorescence. The red circle outlines the cell contour at the equatorial plane. Schematic representations of GFP-Nrx distribution and the bound cell shape are shown next to each condition. z0 marks the plane imaged. (c) Co-localization of GPI-Nlg in the supported lipid bilayer with GFP-Nrx expressed in HEK293 cells. Left, distribution of GFP-Nrx in the cell in the optical slice contacting the supported lipid bilayer containing GPI-Nlg. Right, distribution of GPI-Nlg labeled with Alexa-555 in the supported lipid bilayers. Bottom, fluorescence intensity profiles measured along the dash line for Alexa-555–GPI-Nlg (red) and GFP-Nrx (green). In the absence of cells, the fluorescence profile of Alexa-555–GPI-Nlg bilayers fluctuates around the background level (gray).
Further examination of the contact between the GFP-Nrx cell and the GPI-Nlg lipid bilayer shows accumulation of Alexa-555–GPI-Nlg in spots that co-localize with the cell's GFP-Nrx (Fig. 2c). The fluorescence intensity profiles taken along the dashed line show that Alexa-555–GPI-Nlg fluorescence parallels GFP-Nrx fluorescence. In absence of GFP-Nrx–expressing cells, Alexa-555–GPI-Nlg density is about 1 to 6 proteins per μm2 (M.M. Baksh, C. Dean, S. Pautot, S. DeMaria, E.Y.I. & J.T.G., unpublished data). Such a low density is indistinguishable from background in confocal microscopy. Thus, GPI-Nlg accumulation in high-density spots is driven by its binding to Nrx.
Cell mobility impeded by Nlg-Nrx adhesion
We next examined the relation between Nrx distribution and adhesion strength. Time-lapse measurements of HEK293 cells on the supported lipid bilayer revealed that the cells were highly mobile. Cells expressing GFP-Nrx showed a reduced mobility when the lipid bilayer contained GPI-Nlg (Fig. 3). This reduction in mobility is a reflection of the adhesion between the cell and the supported lipid bilayer. The degree of retardation depended on both the concentration and distribution of Nrx and GPI-Nlg at the contact zone.
Figure 3.

Cell immobilization associated with formation of Nrx-Nlg puncta. (a) Bright-field time series of three cells in contact with a GPI-Nlg lipid bilayer. The white dot marks the position of the only non-expressing cell that drifts along the bilayer. Its trajectory is marked by magenta lines. (b) Corresponding confocal microscopy images of GFP-Nrx at the cell-bilayer contact. The upper cell (dashed circle) has several GFP-Nrx puncta and is fixed in place, whereas the lower cell has a diffuse GFP-Nrx distribution and rotates about its center, as marked by the arrow. Scale bar, 10 μm. (c) Typical trajectories observed for GFP-Nrx cells dropped onto a plain POPC supported lipid bilayer. Scale bar, 10 μm. The bar graphs represent all the measured displacement for cells dropped onto plain POPC lipid bilayers color-coded according the displacement dl per minute: blue for dl< R/10, green for R/10 o dl < R/3, orange for R/3 < dl < R and red for dl>R. (d) Range of displacements observed for GFP-Nrx cells dropped onto GPI-Nlg lipid bilayer. The bar graphs represent all the measured displacement for cells dropped onto GPI-Nlg lipid bilayers.
Cells not expressing Nrx drifted continuously and rapidly over the surface of GPI-Nlg bilayers, whereas cells expressing Nrx moved more slowly or became immobilized. An example of this is shown in Figure 3a,b, where the untransfected cell is visible in the DIC image but not in the fluorescence image because it lacks GFP-Nrx. For the GFP-Nrx–expressing cells, the mobility seemed to depend on the distribution of GFP-Nrx. In the most immobile cells (Fig. 3b, dashed circle), GFP-Nrx was clustered into numerous small, bright (highly concentrated) patches and the cells were completely immobile for the duration of imaging (30 min). Other cells showed a more diffuse distribution of GFP-Nrx and appeared to be anchored at one or two points of concentrated GFP-Nrx clustering. These cells often rotated around these clusters without drifting laterally (Fig. 3b, arrows). Some of these cells eventually detached and became highly mobile (data not shown).
Cell mobility was quantified by tracking GFP-Nrx cell displacement over plain lipid bilayers and over lipid bilayers containing GPI-Nlg. As expected from the observations above, GFP-Nrx cells migrated rapidly over plain bilayers (Fig. 3c) and more slowly over bilayers containing GPI-Nlg (Fig. 3d). The rate of GFP-Nrx cell migration over the GPI-Nlg lipid bilayers varied over a wide range that could be divided into four groups based on the distance (dl) that they traveled in 1 min. Group 1 cells were virtually immobile, moving less than one-tenth of a radius (dl < R/10), group 2 cells moved up to one-third of a cell radius (R/10 < dl < R/3), group 3 cells moved up to one cell radius (R/3 < dl < R) and group 4 cells migrated farther than a cell radius (dl > R). For GPI-Nlg lipid bilayers, ∼50% of the cells migrated very slowly (group 1; dl < R/10) and ∼10% migrated faster (group 4; dl > R), with a mean displacement of 3.5R (SD = 1.5R) (Fig. 3d, bar graph). In contrast, on plain POPC bilayers the reverse was true, and only ∼10% of the Nrx cells fell into group 1, whereas ∼50% fell into group 4, with a mean displacement of 2.7R (SD = 1R) (Fig. 3c, bar graph). Therefore, the adhesive interactions between Nrx and GPI-Nlg substantially slow down the Nrx-expressing cells migration over the GPI-Nlg supported lipid bilayer.
Specificity of GPI-Nlg–Nrx interaction
The retardation of cell migration points to a specific adhesive interaction between Nlg in the bilayer and Nrx on the cell surface. Redistribution of adhesion proteins after cell-cell contact is well documented in the immune synapse23 and is likely to have a similar role in the differentiation of the neuronal synapse1,2. The z sections of GFP-Nrx cells obtained by confocal microscopy were used to reconstruct the three-dimensional distribution of GFP-Nrx in cells contacting plain lipid bilayers and lipid bilayers containing GPI-Nlg. We observed that the fraction of the total GFP-Nrx cell fluorescence at the cell-bilayer interface was greater when the bilayer contained GPI-Nlg (Fig. 4a). This increase in GFP-Nrx at the contact plane is associated with a substantial skew in the three-dimensional distribution of GFP-Nrx toward the cell-bilayer interface (Fig. 4b).
Figure 4.
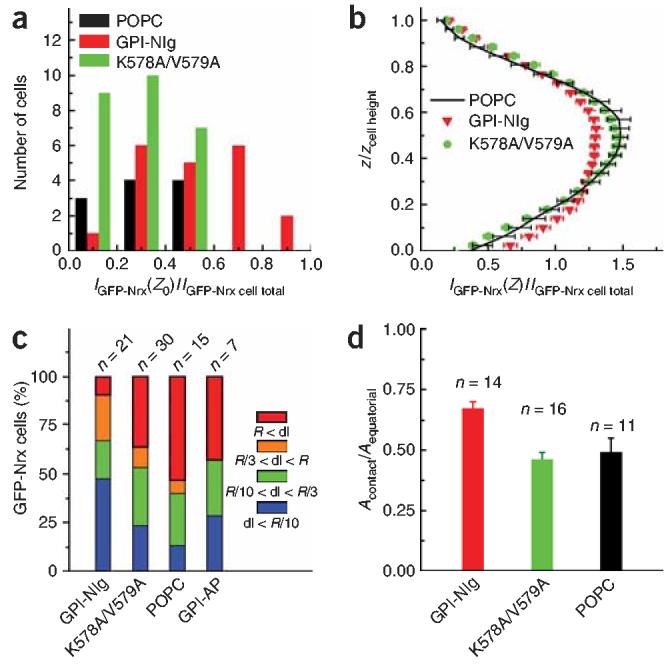
Correlation between distribution of GFP-Nrx in cells and cell immobilization. (a) Histogram of the GFP-Nrx fluorescence intensity (IGFP-Nrx) at z0, the position of the cell-bilayer interface for plain supported lipid bilayers (black), bilayers containing GPI-Nlg (red) and bilayers containing GPI-Nlg(K578A/V579A) (green). IGFP-Nrx(z0) is normalized by the total GFP-Nrx for the cell (IGFP-Nrx cell total). The values were binned in 0.2 intervals. The mean of the normalized GFP-Nrx fluorescence at the contact plain is: 0.31 (s.e.m. = 0.06, n = 11) for cells on plain bilayer; 0.53 (s.e.m. = 0.05, n = 20) for cells on GPI-Nlg–containing bilayers and 0.27 (s.e.m. = 0.03, n = 26) for cells on GPI-Nlg(K578A/V579A)–containing bilayers. (b) z-axis profiles of GFP-Nrx distribution throughout a HEK293 cell. The horizontal axis represents GFP-Nrx fluorescence at one z position (IGFP-Nrx(z)) normalized by IGFP-Nrx cell total. The vertical axis represents the z-axis position normalized by the cell height. This profile reveals a specific skew of distribution to the GPI-Nlg bilayer (red triangles), whereas the profiles for plain POPC bilayers (black lines) and GPI-Nlg(K578A/V579A) (green circles) are more symmetric about the cell equatorial plane. (c) Displacement range for GFP-Nrx cells on supported lipid bilayers, containing from left to right, GPI-Nlg, GPI-Nlg(K578A/V579A), POPC only, GPI-AP. The color code is as for Figure 3c,d. (d) Bar graph of the ratio between the contact region, Acontact, and the equatorial area, Aequatorial, for cells on supported lipid bilayer containing GPI-Nlg (red), GPI-Nlg(K578A/V579A) (green) and plain POPC (black).
To assess the specificity and sensitivity of this interaction, we examined the Nlg double mutant, K578A/V579A, which is mutated at the putative oligomerization motif and has been shown to decrease aggregation with Nrx expressing cells and to eliminate synapse induction13. We found no evidence for GFP-Nrx relocalization to the bilayer interface when cells were dropped onto GPI-Nlg(K578A/V579A) supported lipid bilayers (Fig. 4a,b). In addition, cell migration was faster than on GPI-Nlg lipid bilayers, although still slower than on plain lipid bilayers (Fig. 4c), indicating that a minimal Nrx interaction with the Nlg mutant remains. However, this interaction does not lead to recruitment of additional Nrx to the cell-bilayer contact or to an increase in contact area relative to the control (Acontact/Aequatorial = 0.46, s.e.m. = 0.03, n = 16) (Fig. 4d). These results support earlier conclusions from cell aggregation assays13 that Nlg oligomerization is necessary for proper Nrx-Nlg binding.
In a separate assay, we examined the effect of replacing GPI-Nlg in the bilayer with the protein alkaline phosphatase (GPI-AP), a naturally GPI-linked enzyme. Although a few cell had reduced mobility, the majority were unimpeded. Cells from group 4 (dl > R) are two times faster than on all the other bilayers tested, moving at an average of 6.5R in 1 min (s.d. = 3R, n = 3). Taken together, the results presented so far indicate that contact of a cell containing Nrx with a bilayer containing GPI-Nlg leads to specific binding interactions between the proteins, which concentrates them at the cell-bilayer contact. This Nlg-Nrx binding provides an adhesive force that slows cell migration. The force of adhesion is strengthened by several factors: accumulation of the proteins, their clustering, and an increase in the contact area. To assess the adhesion forces that keep ∼45% of the Nrx-cells immobile on GPI-Nlg supported lipid bilayers, we have developed a gravity dissociation assay for adhesion between the cell and the bilayer.
Inversion assay: a measurement of cell-bilayer binding strength
We implemented an assay to evaluate the strength of Nrx-expressing cells' specific adhesion to the GPI-Nlg bilayer. Flow-induced shear, previously used to study cadherin adhesion24, produce shear forces too strong to distinguish between Nrx-expressing cells and untransfected cells (data not shown). We therefore adapted a cell binding assay used to study cell adhesion forces weaker than 100 pN25: gravitational force was used to pull cells away from the bilayer leading to a force ∼4 pN for a spherical cell of 15 μm diameter with a density of 1.42. A closed observation chamber was designed to minimize hydrodynamic perturbations that could shear cells away from the surface (Fig. 5a; see Supplementary Methods for details). The top and bottom surfaces were optically clear to allow us to image cells in the upright configuration of the chamber when the cells rested on top of the bilayer, and then under gravitational force when the chamber was inverted. To determine the positions of all seeded cells we used bright-field illumination, and GFP-Nrx expressing cell were identified using confocal microscopy. Figure 5b shows the initial cell density on a plain lipid bilayer, lacking GPI-Nlg, and Figure 5c shows the initial cell density on a GPI-Nlg bilayer. Twenty minutes after the cells were dropped onto the bilayer, the chamber was inverted. Within a short time (30 s), all of the cells seeded on the plain lipid bilayer detached, leaving a clean, supported lipid bilayer (Fig. 5d). This result confirms the observations (in Figs. 2-4) that neither untransfected cells nor cells expressing Nrx bind to plain lipid bilayers. In contrast, many GFP-Nrx–expressing cells remained attached to GPI-Nlg lipid bilayers after inversion of the chamber (Fig. 5e). The bar graph (Fig. 5f)shows the average number of cells that bound in these experiments for five different preparations of proteoliposomes. After chamber inversion, only Nrx-expressing cells can be seen on the supported lipid bilayer. Most of them detached progressively within the first 2 min, whereas 17 ± 3 percent of the Nrx-expressing cells adhered strongly enough to overcome gravitational force and remain attached. We imaged the contact zone of the Nrx-expressing cells that remained adhered to the GPI-Nlg bilayers and found that they had Acontact/Aequatorial > 0.7, similar to those seen in Figure 2b. When GPI-Nlg was replaced with GPI-Nlg(K578A/V579A), the number of adherent Nrx-expressing cells dropped to 7.5 ± 2.5 percent. This suggests that significant cell-cell adhesion is due to the specific binding between GPI-Nlg and Nrx and that it is only achieved when multiple Nlg-Nrx binding clusters are formed at the contact site.
Figure 5.
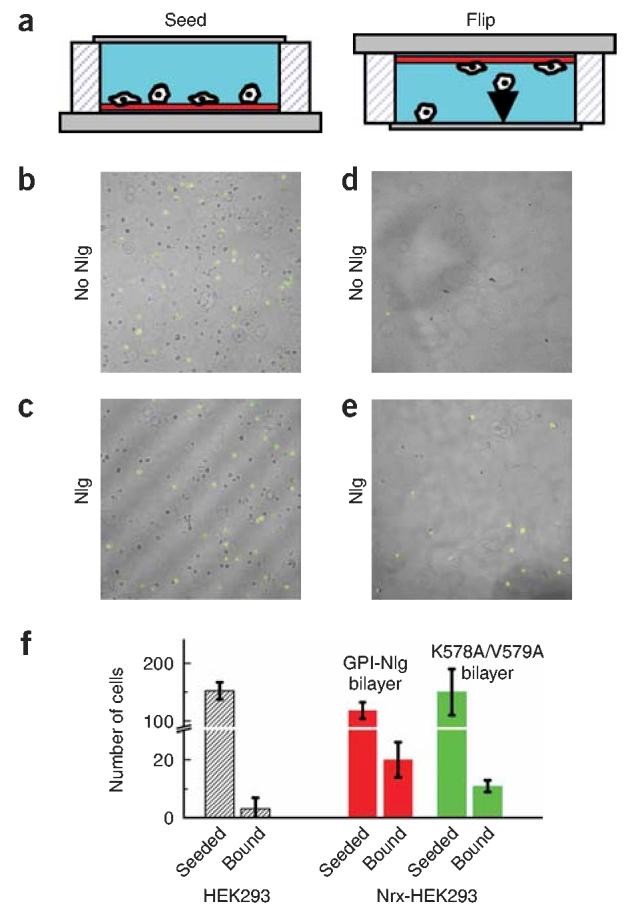
Inversion assay: relation between Nrx-Nlg distribution and adhesion strength. (a) Schematic of the observation chamber after cells are dropped onto the supported lipid bilayer (left) and after the chamber is inverted so that the cells are pulled from the bilayer by gravity (right). (b–e) Overlay images of the bright field, showing all cells, and GFP fluorescence images, showing GFP-Nrx–expressing cells, on a 737 × 737–μm supported lipid bilayer. Shown are cells on a plain lipid bilayer before (b) and 5 min after inversion (d), and cells seeded on a GPI-Nlg lipid bilayer before (c) and 5 min after inversion (e). Cells only adhere to the GPI-Nlg lipid bilayer. The bright stripes in c are artifacts caused by light diffraction. (f) Bar graph of number of cells seeded onto lipid bilayer containing: GPI-Nlg lipid bilayer (red) or GPI-Nlg(K578A/V579A) (green), and number adhering after chamber inversion for control cells and for cells expressing GFP-Nrx. Values are mean ± s.e.m. of five sets of samples. Note that the y-axis is broken to facilitate comparison.
DISCUSSION
We have shown here that incorporation of a GPI-linked ectodomain of the neuronal adhesion protein Nlg into flat supported lipid bilayers allows us to image Nlg distribution and co-localization with the cognate presynaptic binding partner Nrx. These experiments indicate that when Nlg is not associated to cytoskeleton or to scaffolding proteins, its distribution is dictated by its interaction with Nrx. Nlg oligomerization and mutations in the putative interaction interface abolish recruitment of Nrx to the contact area as they do in cell-cell studies, establishing cell-bilayer interaction as a model system.
As opposed to bulk studies in cells expressing Nlg or Nrx, the cell-bilayer system allows for the quantification of the Nlg-Nrx interaction. It provides a straightforward assay to study the weak adhesive interactions between synaptic proteins. It shows that, in the absence of other adhesion proteins, high-density clustering of Nrx is a key determinant in establishing an adhesion (>4 pN per cell). The adhesive forces between Nlg and Nrx are much weaker than those previously measured for cadherins (∼100 pN per cell). This difference may indicate a specialized function for Nlg and Nrx in contact-mediated target recognition and in the signaling that triggers presynaptic differentiation. A weak interaction may provide a rapidly forming but tentative adhesion that requires additional steps for stabilization. Although heterophilic adhesion pairs may offer binding specificity, it is likely that strong adhesion proteins, such as N-cadherins, will provide the majority of the attachment force.
Reconstitution of the immune synapse using cell-bilayer systems has enabled the visualization of the molecular interactions responsible for cell-cell recognition and signaling and led to insights into the physical forces that they exert. Similar benefits are to be expected for the study of the formation and function of neuronal synapses.
METHODS
Small unilamellar vesicles (SUVs)
We used high-pressure extrusion to prepare SUVs. First, 1.8 μmol ml−1 of POPC (Avanti Polar Lipids) in chloroform was added in 10-ml round-bottom flask. Chloroform was removed using a rotary evaporator to form a thin lipid film, which was hydrated in distilled water at 1.5 mg ml−1. The resulting lipid suspension was then forced through a 100-nm-pore filter (Nuclepore Track-Etch Membrane, Whatman) using a nitrogen gas–pressurized extruder (Northern Lipids) to form SUVs. POPC is a zwitterionic lipid molecule that forms neutral lipid bilayers that do not interact with cells through nonspecific electrostatic interactions and that remain fluid during the GPI-linked incorporation process at 4 °C.
GPI-linked NLG purification and incorporation to SUVs
Recombinant GPI-anchored neuroligin (mouse neuroligin-1, GenBank accession number NM-138666, cloned into a pNice plasmid (Clontech), was a generous gift from C. Dean and P. Scheiffele. In this construct, the sequence encoding the peptide that becomes GPI modified by the cell (from mouse acetylcholinesterase, accession number AF312033) is inserted at a KpnI restriction site, downstream of P587, the new C-terminal end of the protein after truncation of the native transmembrane and cytoplasmic domains. To ease the purification of the GPI-Nlg, a 6×His tag was added to the N-terminus downstream of A57. His–GPI-Nlg was expressed in HEK293 cells and isolated from cell lysates by chromatography on NTA-agarose. NTA-agarose beads (Qiagen) were equilibrated for 24 h before use according to the manufacturer's instructions. The proteins were bound to the column in PBS, 350 mM NaCl, 0.5% Triton X-100 and 6 mM imidazole. Nonspecifically bound proteins were removed by extensive washing with PBS containing 1 M NaCl and 0.1% Triton X-100. N-octylglucoside (NOG; Sigma) at 25 mM was added, and bound proteins were eluted with an imidazole gradient (10–200 mM). Peak fractions containing purified GPI-Nlg were labeled using Alexa-555 succinimidyl ester (Alexa-555–NHS; Molecular Probes). A detergent method was used to reconstitute the GPI-linked proteins into preformed POPC unilamellar vesicles. SUVs and the GPI-Nlg protein fraction were incubated with 25 mM NOG for 30 min at room temperature26-28. The suspension was loaded in Spectra Pore7 (Spectrum Laboratories) dialysis tubing with a 10-kDa molecular weight cutoff and NOG was removed with three successive rounds of dialysis against fresh PBS. The activity of GPI-Nlg was tested by its interaction with neurons. The protein was incorporated into lipid bilayers that were coated onto glass bead, placed in contact with hippocampal neurons in culture, and found to trigger presynaptic differentiation as described earlier13 (Fig. 4b) (M.M. Baksh, C. Dean, S. Pautot, S. DeMaria, E.Y.I. & J.T.G., unpublished data).
Supported lipid bilayers
Supported lipid bilayers were made by adding into the chamber 20 μl of a 1:1 suspension of the proteoliposome stock solution with PBS, and allowed this to equilibrate for 1 min before adding 100 μl of PBS. Excess proteoliposomes were washed away by replacing two-thirds of the total volume three times with fresh filtered PBS and three more times with complete cell culture medium at room temperature27,29.
Image acquisition
Single-molecule imaging of Alexa-555–Nlg was obtained by illuminating the supported lipid bilayer in a total internal reflection fluorescence (TIRF) configuration using through-the-objective illumination on an Olympus inverted microscope with the Olympus 60× oil immersion objective, with an NA = 1.45, as described previously16,17. The illumination source was a 100 mW Nd-YAG laser (Coherent) providing a 20-μm, 1-mW, 532-nm laser spot. Fluorescence was collected through a 565LP dichroic (Chroma) and a 565-nm ALP emission filter and imaged with an iXon DV887 CCD camera (Andor Technology).
Confocal images were acquired with a Zeiss LSM 510 META confocal microscope. Laser power and photomultipliers were set such that no detectable bleed-through occurred between the different channels. z-stacks of cells interacting with supported lipid bilayers were acquired with a 40×/0.8 NA dipping lens with pinhole set to 76 μm (0.86 Airy units), corresponding to 2 μm z-slice and with a 63×/0.9 NA dipping lens with pinhole set to 150 μm, corresponding to 2-μm z-slice (1.3 Airy units). Images were analyzed with the Zeiss LSM5 Image Examiner software and processed using Adobe Photoshop software. The analysis of the TIRF images was carried out with IDL (RSI) and Matlab routines (MathWorks). See Supplementary Methods for details.
Gravity adhesion force assay
To do this, we designed a closed observation chamber consisting of a 4-mm-diameter microchamber, small enough to minimize hydrodynamic perturbations that could shear cells away from the surface.
Polydimethylsiloxane (PDMS) sheets, 2 mm thick, were formed by curing Sylgard 182 (Dow Corning) at 60 °C overnight in a flat-bottom dish. The PDMS was cut into 1 × 1–cm square pads in which a 4-mm hole was punched. Glass slides were prepared by etching in piranha solution (3:1 H2SO4/H2O2) for 5–10 min, extensively rinsed with deionized water and dried under nitrogen. Surface oxidation of both PDMS and glass slides was then carried out using a plasma cleaner (PDC-32G, Harrick Scientific) under high power for 30–60 s. The PDMS plasma-treated surface was bound to the plasma-treated glass slide and baked on a hot plate for 15 min. These microchambers were kept in a dust-free environment and used within 48 h to prepare supported lipid bilayers.
Cells preparation was as described in Supplementary Methods. Dissociated cells were dropped onto the supported lipid bilayer and the chamber was sealed with a coverslip held in place by capillary forces. The cells settled to the bilayer surface within 10 min. The cell density was set to minimize contact between cells while maximizing cell number. This yielded ∼300 cells per field of view, enabling statistical analysis. These binding experiments were repeated five times with different preparations of proteoliposomes, and for each experiment we determined the fraction of untransfected cells and the fraction of Nrx-expressing cells that remained bound to the GPI-Nlg bilayer after chamber inversion.
Supplementary Material
ACKNOWLEDGMENTS
We thank C. Dean and P. Scheiffele for the GPI-Nlg construct, C. Dean for help with initial protein preparation, A. Pralle for help with the TIRF microscopy, H. Aaron for help with the confocal microscopy, and C. Dean, P. Scheiffele, E. Douglas, M. Forstner and S. Rozovsky for fruitful discussions. This work was supported by the Chemical Sciences, Geosciences and Biosciences Division, Office of Basic Energy Sciences, US Department of Energy (contract No. DE-AC03-76SF00098).
Footnotes
Note: Supplementary information is available on the Nature Chemical Biology website.
COMPETING INTERESTS STATEMENT
The authors declare that they have no competing financial interests.
References
- 1.Yamagata M, Sanes JR, Weiner JA. Synaptic adhesion molecules. Curr. Opin. Cell Biol. 2003;15:621–632. doi: 10.1016/s0955-0674(03)00107-8. [DOI] [PubMed] [Google Scholar]
- 2.Scheiffele P. Cell-cell signaling during synapse formation in the CNS. Annu. Rev. Neurosci. 2003;26:485–508. doi: 10.1146/annurev.neuro.26.043002.094940. [DOI] [PubMed] [Google Scholar]
- 3.Garner CC, Nash J, Huganir RL. PDZ domains in synapse assembly and signalling. Trends Cell Biol. 2000;10:274–280. doi: 10.1016/s0962-8924(00)01783-9. [DOI] [PubMed] [Google Scholar]
- 4.Dityatev A, et al. Polysialylated neural cell adhesion molecule promotes remodeling and formation of hippocampal synapses. J. Neurosci. 2004;24:9372–9382. doi: 10.1523/JNEUROSCI.1702-04.2004. [DOI] [PMC free article] [PubMed] [Google Scholar]
- 5.Sytnyk V, Leshchyns'ka I, Dityatev A, Schachner M. Trans-Golgi network delivery of synaptic proteins in synaptogenesis. J. Cell Sci. 2004;117:381–388. doi: 10.1242/jcs.00956. [DOI] [PubMed] [Google Scholar]
- 6.Shapiro L, Colman DR. Structural biology of cadherins in the nervous system. Curr. Opin. Neurobiol. 1998;8:593–599. doi: 10.1016/s0959-4388(98)80086-x. [DOI] [PubMed] [Google Scholar]
- 7.Benson DL, Tanaka H. N-cadherin redistribution during synaptogenesis in hippocampal neurons. J. Neurosci. 1998;18:6892–6904. doi: 10.1523/JNEUROSCI.18-17-06892.1998. [DOI] [PMC free article] [PubMed] [Google Scholar]
- 8.Biederer T, et al. SynCAM, a synaptic adhesion molecule that drives synapse assembly. Science. 2002;297:1525–1531. doi: 10.1126/science.1072356. [DOI] [PubMed] [Google Scholar]
- 9.Ichtchenko K, et al. Neuroligin-1—a splice site–specific ligand for b-neurexins. Cell. 1995;81:435–443. doi: 10.1016/0092-8674(95)90396-8. [DOI] [PubMed] [Google Scholar]
- 10.Nguyen T, Sudhof TC. Binding properties of neuroligin 1 and neurexin 1β reveal function as heterophilic cell adhesion molecules. J. Biol. Chem. 1997;272:26032–26039. doi: 10.1074/jbc.272.41.26032. [DOI] [PubMed] [Google Scholar]
- 11.Song JY, Ichtchenko K, Sudhof TC, Brose N. Neuroligin 1 is a postsynaptic cell-adhesion molecule of excitatory synapses. Proc. Natl. Acad. Sci. USA. 1999;96:1100–1105. doi: 10.1073/pnas.96.3.1100. [DOI] [PMC free article] [PubMed] [Google Scholar]
- 12.Scheiffele P, Fan JH, Choih J, Fetter R, Serafini T. Neuroligin expressed in nonneuronal cells triggers presynaptic development in contacting axons. Cell. 2000;101:657–669. doi: 10.1016/s0092-8674(00)80877-6. [DOI] [PubMed] [Google Scholar]
- 13.Dean C, et al. Neurexin mediates the assembly of presynaptic terminals. Nat. Neurosci. 2003;6:708–716. doi: 10.1038/nn1074. [DOI] [PMC free article] [PubMed] [Google Scholar]
- 14.Graf ER, Zhang X, Jin SX, Linhoff MW, Craig AM. Neurexins induce differentiation of GABA and glutamate postsynaptic specializations via neuroligins. Cell. 2004;119:1013–1026. doi: 10.1016/j.cell.2004.11.035. [DOI] [PMC free article] [PubMed] [Google Scholar]
- 15.Nam CI, Chen L. Postsynaptic assembly induced by neurexin-neuroligin interaction and neurotransmitter. Proc. Natl. Acad. Sci. USA. 2005;102:6137–6142. doi: 10.1073/pnas.0502038102. [DOI] [PMC free article] [PubMed] [Google Scholar]
- 16.Axelrod D. Total internal reflection fluorescence microscopy in cell biology. Traffic. 2001;2:764–774. doi: 10.1034/j.1600-0854.2001.21104.x. [DOI] [PubMed] [Google Scholar]
- 17.Sonnleitner A, Mannuzzu LM, Terakawa S, Isacoff EY. Structural rearrangements in single ion channels detected optically in living cells. Proc. Natl. Acad. Sci. USA. 2002;99:12759–12764. doi: 10.1073/pnas.192261499. [DOI] [PMC free article] [PubMed] [Google Scholar]
- 18.Groves JT, Dustin ML. Supported planar bilayers in studies on immune cell adhesion and communication. J. Immunol. Methods. 2003;278:19–32. doi: 10.1016/s0022-1759(03)00193-5. [DOI] [PubMed] [Google Scholar]
- 19.Sapuri AR, Baksh MM, Groves JT. Electrostatically targeted intermembrane lipid exchange with micropatterned supported membranes. Langmuir. 2003;19:1606–1610. [Google Scholar]
- 20.Lee GM, Ishihara A, Jacobson KA. Direct observation of brownian motion of lipids in a membrane. Proc. Natl. Acad. Sci. USA. 1991;88:6274–6278. doi: 10.1073/pnas.88.14.6274. [DOI] [PMC free article] [PubMed] [Google Scholar]
- 21.Fein M, et al. Lateral mobility of lipid analogues and GPI-anchored proteins in supported bilayers determined by fluorescent bead tracking. J. Membr. Biol. 1993;135:83–92. doi: 10.1007/BF00234654. [DOI] [PubMed] [Google Scholar]
- 22.Hovis JS, Boxer SG. Patterning and composition arrays of supported lipid bilayers by microcontact printing. Langmuir. 2001;17:3400–3405. [Google Scholar]
- 23.Dustin ML. Role of adhesion molecules in activation signaling in T lymphocytes. J. Clin. Immunol. 2001;21:258–263. doi: 10.1023/a:1010927208180. [DOI] [PubMed] [Google Scholar]
- 24.Pierres A, Benoliel AM, Bongrand P. Use of a laminar flow chamber to study the rate of bond formation and dissociation between surface-bound adhesion molecules: effect of applied force and distance between surfaces. Faraday Discuss. 1998;111:321–330. doi: 10.1039/a806339g. [DOI] [PubMed] [Google Scholar]
- 25.McClay DR, Wessel GM, Marchase RB. Inter-cellular recognition—quantitation of initial binding events. Proc. Natl. Acad. Sci. USA. 1981;78:4975–4979. doi: 10.1073/pnas.78.8.4975. [DOI] [PMC free article] [PubMed] [Google Scholar]
- 26.Westcott KR, Hill RL. Reconstitution of a porcine submaxillary gland β-Dgalactoside α2—3 sialyltransferase into liposomes. J. Biol. Chem. 1985;260:13116–13121. [PubMed] [Google Scholar]
- 27.Hinterdorfer P, Baber G, Tamm LK. Reconstitution of membrane-fusion sites—a total-internal-reflection fluorescence microscopy study of influenza hemagglutininnediated membrane-fusion. J. Biol. Chem. 1994;269:20360–20368. [PubMed] [Google Scholar]
- 28.Angrand M, Briolay A, Ronzon F, Roux B. Detergent-mediated reconstitution of a glycosyl-phosphatidylinositol-protein into liposomes. Eur. J. Biochem. 1997;250:168–176. doi: 10.1111/j.1432-1033.1997.t01-1-00168.x. [DOI] [PubMed] [Google Scholar]
- 29.Sackmann E. Supported membranes: scientific and practical applications. Science. 1996;271:43–48. doi: 10.1126/science.271.5245.43. [DOI] [PubMed] [Google Scholar]
Associated Data
This section collects any data citations, data availability statements, or supplementary materials included in this article.