

Abstract
The hypothesis that chromosome size affects the rate and distribution of meiotic crossovers in budding yeast was tested. Map distance and interference were measured in the same genetic intervals present on either small (340 and 508 kb) or large (917 and 1085 kb) chromosomes, respectively. No differences were observed.
DURING meiosis, crossovers between homologous chromosomes, in combination with sister-chromatid cohesion, create physical connections that promote the accurate segregation of chromosomes to opposite poles at the first meiotic division (Bascom-Slack et al. 1997; Petronczki et al. 2003). Genetic interference is a phenomenon by which a crossover in one interval decreases the probability that additional crossovers will occur nearby. The distribution of crossovers by interference has been postulated to ensure that every pair of homologs receives at least one. The degree of interference and the number of crossovers per meiosis varies between organisms. For example, in nematodes interference is strong, such that each chromosome pair undergoes only a single crossover (Hillers and Villeneuve 2003). In contrast, in fission yeast there is no interference, but because there is a large number of crossovers and only three chromosomes, the probability that each chromosome will receive a crossover is high (Munz 1994). In budding yeast, there are ∼90 crossovers per meiosis (Mortimer et al. 1991). There are 16 pairs of homologs and these chromosomes vary in size from 230 to 1530 kb (Saccharomyces Genome Database). Mutations that abolish interference increase nondisjunction of small chromosomes preferentially, consistent with the idea that crossovers are distributed to ensure that all chromosomes receive at least one (Sym and Roeder 1994). Studies in the literature using bisected and translocated chromosomes suggest that chromosome size is important in determining the rate of recombination (in centimorgans per kilobase) as well as the degree of interference (Kaback et al. 1992, 1999). We sought to test this hypothesis by comparing map distance and interference values obtained from the same genetic intervals present on either small or large chromosomes. Contrary to what has been previously reported, we saw no effect of chromosome size on either of these parameters. We conclude, therefore, that differences in the rate of recombination and interference observed between chromosomes in budding yeast, at least for some intervals, are a function of their DNA sequence as opposed to the size of the chromosome.
To allow direct comparison between the same DNA sequences on different-size chromosomes, ectopic recombination was used to make a reciprocal translocation that exchanges the right arm of chromosome VII for the last ∼8 kb of the right arm of chromosome III and vice versa, using the approach described in Borde et al. (2000)(Figure 1, A and B). Recombination between ade2 truncation alleles on chromosomes III and VII generated Ade+ cells that were screened by polymerase chain reaction (PCR) and Southern blot analysis to confirm the presence of the translocation (Figure 1B). Three intervals on chromosomes III and VII were then analyzed on either a short chromosome (340 and 508 kb, respectively) or a long chromosome (917 and 1085, respectively). The isogenic diploids, NH598 (which contains the native chromosomes) and NH607 (which contains the translocation chromosomes), were sporulated and dissected. Over 1000 tetrads were analyzed for each diploid. The map distance of each interval was unaffected by the change in chromosome size (Table 1). Gene conversion was also unaffected (data not shown). To monitor interference, the ratio of observed nonparental ditypes (or NPDs, which arise from four-strand double crossovers) to those expected assuming no interference, was calculated. An NPD ratio of 1 indicates no interference, while an NPD ratio of 0 indicates complete interference (Snow 1979). Although differences in NPD ratio were observed, these differences are not likely to be significant as the standard deviations of all the intervals overlap, with the exception of the LEU2-THR4 interval (where at least 48 NPDs were scored for each diploid; Table 1). In the LEU2-THR4 interval, the NPD ratio is increased in the translocation diploid, in contradiction to what was expected from the literature. The prediction was that moving this interval from a small chromosome to a large chromosome should increase the amount of interference (i.e., decrease the NPD ratio).
Figure 1.—
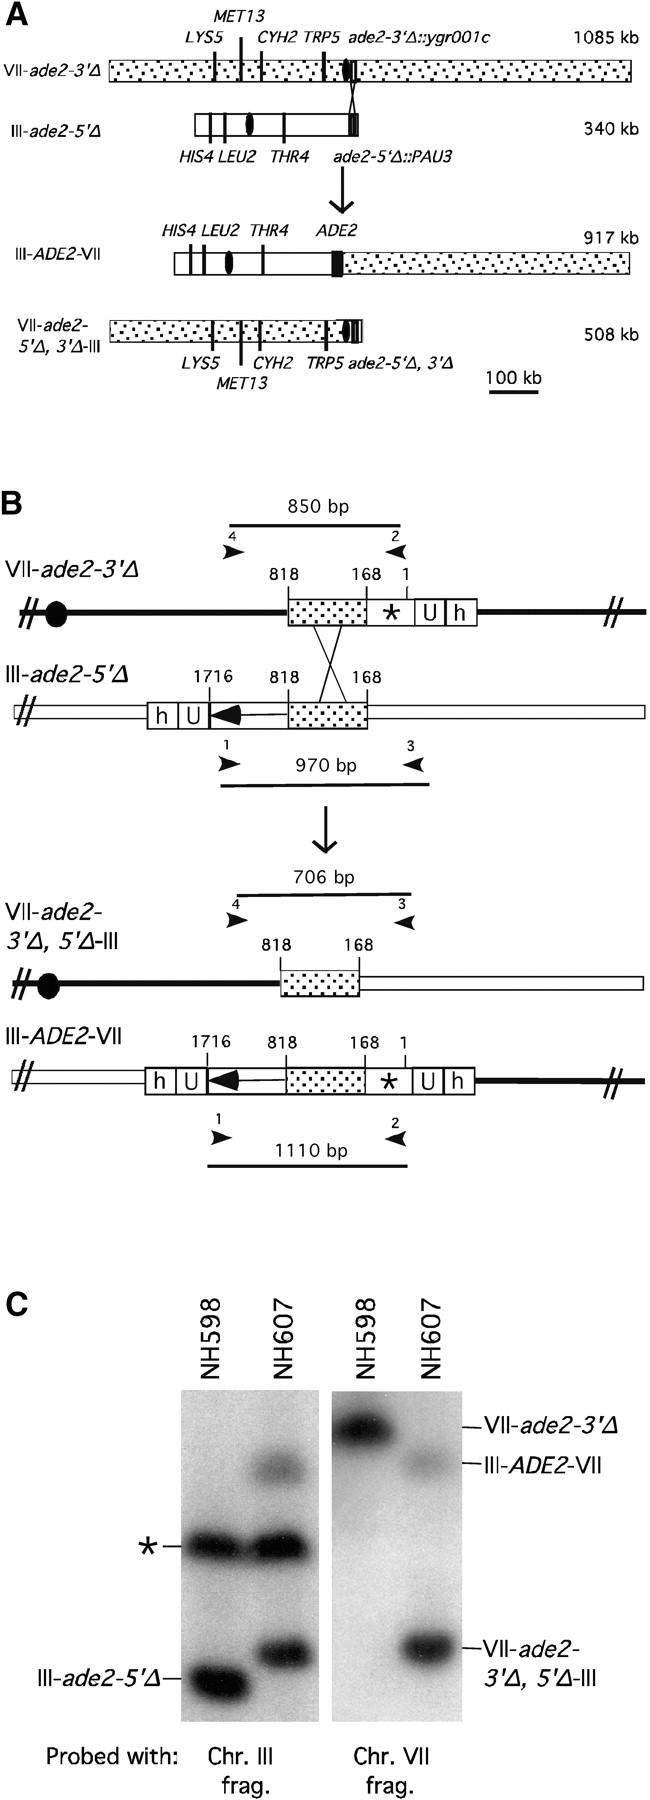
Construction of a reciprocal translocation between chromosome III and VII by ectopic recombination. (A) Overview of the translocation strategy drawn to scale. A cassette containing a truncation of the 3′ end of the ADE2 gene, URA3, and hisG was integrated 680 bp from the centromere on chromosome VII. A cassette containing hisG, URA3, and a 5′ truncation of ADE2 was integrated 7.6 kb from the telomere of the right arm of chromosome III. Recombination between the two truncated ade2 alleles produces Ade+ colonies containing two reciprocal translocation chromosomes (Borde et al. 2000). Solid ovals represent centromeres; rectangles represent ade2 cassettes; the stippled bar indicates chromosome VII sequences while the open bar represents chromosome III. (B) Expanded view of the ade2 truncation cassettes and their recombination products (not drawn to scale). h, hisG; U, URA3; dotted bar, the region of ADE2 shared between the two truncation cassettes; the arrow and the asterisk indicate the 3′ and 5′ ends of the ADE2 gene, respectively. To create the strains, a 576-bp fragment from chromosome III (coordinates 308386–308962 from the Saccharomyces Genome Database, located between PAU3 and ADH7) and a 583-bp fragment from chromosome VII (coordinates 497716–498299, one end of which is within YGR001c) were amplified and cloned into pVZ1. Site-directed mutagenesis was used to introduce an SphI and a XhoI site into the III and VII sequences, respectively. A 4.9-kb SphI fragment from pMJ436 containing the hisG-URA3-ade2-5′Δ cassette was cloned into the SphI site to generate pTS93. A 5.3-kb XhoI fragment from pMJ437 containing the ade2-3′Δ-URA3-hisG cassette was inserted into the XhoI site to make pTS87. BamHI/SacI-digested pTS93 and SphI/SacI-digested pTS87 were used to transform MATa and MATα derivatives of two SK1 strains of complementary genotypes (G1 and G2) using URA3 as the selectable marker. To generate G1 and G2 strains that contained both truncation cassettes, the G1 VII::ade2-3′Δ haploid was crossed to the G1 III::ade2-5′Δ haploid. The diploid was sporulated and dissected and Ura+ segregants were screened by Southern blot analysis for the presence of both cassettes. The G2 strains were treated similarly. G1 and G2 haploids carrying both ade2 truncations were crossed to create the nontranslocation diploid, NH598. This diploid was converted to Ade+ by transformation of an ADE2 fragment. To generate the translocations, G1 and G2 haploids carrying both cassettes were plated on SD-ade medium. Ade+ colonies arose at a frequency of 2–4 × 10⁻⁷. The Ade+ colonies were screened for the VII-III translocation using yeast colony PCR (see http:://www.fhcrc.org/labs/hahn/methods/mol_bio_meth/per_yeast_colony.html). The presence of this translocation was indicated by the formation of a 706-bp fragment when the TL3 and TL4 primers were used for amplification and the concomitant loss of the 850- and 970-bp fragments obtained using the TL4/TL2 and TL1/TL3 primer combinations, respectively. Primers are indicated by arrowheads. Primer sequences were TL1, 5′-TTCCGCCATACTGGAGGC-3′; TL2, 5′-ATGGATTCTAGAACAGTTGG-3′; TL3: 5′-ATACACACATAAGTAGGCAC-3′; TL4, 5′-CGGTTTCATTAAGATGTAAG-3′). A G1 translocation haploid was mated to a G2 translocation haploid to make the diploid NH607. Strain genotypes are as follows:
NH598: 


 NH607:
 |
 |
 |
(C) Southern blot confirming the formation of the translocation chromosomes. NH598 and NH607 were grown to stationary phase in YEPD and cell plugs were made as described in Borde et al. (1999). The chromosomes were fractionated on a contour-clamped homogeneous electric field gel, transferred to a nylon membrane and probed with either the chromosome III or the chromosome VII amplified fragments. The chromosome III fragment was observed to cross-hybridize with a second chromosome indicated by an asterisk.
TABLE 1.
Map distances and NPD ratios from translocation and nontranslocation diploids
| Map distance (cM)a
|
||||||||||||||||||||||||
|---|---|---|---|---|---|---|---|---|---|---|---|---|---|---|---|---|---|---|---|---|---|---|---|---|
| Chromosome III markersb
|
Chromosome VII markersb
|
|||||||||||||||||||||||
|
HIS4-LEU2c
|
LEU2-MAT
|
MAT-THR4
|
LYS5-MET13
|
MET13-CYH2
|
CYH2-TRP5
|
|||||||||||||||||||
| Strain | P | N | T | cM | P | N | T | cM | P | N | T | cM | P | N | T | cM | P | N | T | cM | P | N | T | cM |
| NH598 | 804 | 3 | 228 | 11.9 | 563 | 18 | 438 | 26.8 | 709 | 3 | 312 | 16.1 | 623 | 5 | 366 | 19.9 | 807 | 1 | 217 | 10.9 | 348 | 41 | 655 | 43.1 |
| NH607 | 781 | 2 | 229 | 11.9 | 600 | 16 | 373 | 23.7 | 672 | 6 | 310 | 17.5 | 574 | 7 | 412 | 22.9 | 769 | 0 | 231 | 11.5 | 311 | 42 | 667 | 45.0 |
| NPD ratiob | ||||||||||||||||||||||||
| NH598 | 0.40 ± 0.23 | 0.51 ± 0.13 | 0.20 ± 0.11 | 0.22 ± 0.10 | NA | 0.36 ± 0.06 | ||||||||||||||||||
| NH607 | 0.26 ± 0.18 | 0.65 ± 0.17 | 0.38 ± 0.15 | 0.22 ± 0.09 | NA | 0.30 ± 0.06 | ||||||||||||||||||
|
HIS4-MAT
|
LEU2-THR4
|
LYS5-TRP5
|
||||||||||||||||||||||
| Map distance |
NPD ratio | Map distance |
NPD ratio | Map distance |
NPD ratio | |||||||||||||||||||
| NH598 | 37.0 | 0.57 ± 0.10 | 43.6 | 0.50 ± 0.08 | 64.9 | 0.68 ± 0.12 | ||||||||||||||||||
| NH607 | 35.2 | 0.57 ± 0.11 | 41.2 | 0.75 ± 0.12 | 70.1 | 0.86 ± 0.13 | ||||||||||||||||||
Spore viability for NH598 was 94.7% (1305 tetrads) and for NH607, 96.4% (1282 tetrads).
Tests for statistical significance were performed using the program available at http://groik.com/stahl/. NPD ratios were calculated by the Papazian equation (Papazian 1952) using the software at this website. NA, not applicable because too few N tetrads.
Map distances were calculated using the Perkins formula (Perkins 1949). P, parental ditype; N, nonparental ditype; T, tetratype.
Our experiments unambiguously demonstrate that changes in chromosome size, by either an increase of 2.6-fold or a decrease of 2.1-fold, have no effect on the rate of recombination or the degree of interference for specific intervals on chromosomes III and VII. Why do these results differ from those in the literature? One possible explanation is that intervals on different chromosomes are differentially sensitive to changes in chromosome size. In the work by Kaback et al. (1992)(1999), recombination was measured using translocations between chromosomes I and II, while this work used translocations between chromosomes III and VII. Alternatively, there may be genetic differences between the SK1 strains used in this study and the non-SK1 strains used by the Kaback lab that are responsible. Whatever the reason, the main finding of this article is that the phenomenon of chromosome size affecting recombination rates and interference is not a general one.
Different intervals in our experiment clearly exhibited different rates of recombination as measured by centimorgans per kilobase. The highest rates were observed for the chromosome III intervals MAT-THR4 and HIS4-LEU2, irrespective of chromosome size (Table 2). Interestingly, chromosome III also contained the interval that exhibited the lowest rate of recombination. Not surprisingly, the rate of recombination correlates well with the frequency of double-strand breaks (DSBs) formed in or near these intervals (Baudat and Nicolas 1997; Gerton et al. 2000; Borde et al. 2004). Whereas chromosome III has well-defined hotspots for DSB formation, the breaks on chromosome VII are more evenly distributed (Gerton et al. 2000; Borde et al. 2004). Therefore, differences in recombination rates between chromosomes are likely due to DNA sequences that lead to different chromosomal contexts that influence the frequency of DSB formation, rather than to chromosome size.
TABLE 2.
Crossover rates for the same intervals on different-size chromosomes
| Interval | Chromosome size (kb) |
cM/kb |
|---|---|---|
| HIS4-LEU2 | 340 | 0.49 |
| 917 | 0.49 | |
| LEU2-MAT | 340 | 0.25 |
| 917 | 0.22 | |
| MAT-THR4 | 340 | 0.90 |
| 917 | 0.98 | |
| LYS5-MET13 | 508 | 0.39 |
| 1085 | 0.34 | |
| MET13-CYH2 | 508 | 0.29 |
| 1085 | 0.28 | |
| CYH2-TRP5 | 508 | 0.33 |
| 1085 | 0.32 |
Acknowledgments
Many thanks go to Neil Hunter and Michael Lichten for strains, plasmids, and ideas. Rebecca Cole assisted in the tetrad dissection. We are grateful to Bernadette Holdener for use of her CHEF gel apparatus. This work was supported by National Institutes of Health grant GM-50717.
References
- Bascom-Slack, C. A., L. O. Ross and D. S. Dawson, 1997. Chiasmata, crossovers and meiotic chromosome segregation. Adv. Genet. 35: 253–284. [DOI] [PubMed] [Google Scholar]
- Baudat, F., and A. Nicolas, 1997. Clustering of meiotic double-strand breaks on yeast chromosome III. Proc. Natl. Acad. Sci. USA 94: 5213–5218. [DOI] [PMC free article] [PubMed] [Google Scholar]
- Borde, V., T. C. Wu and M. Lichten, 1999. Use of a recombination reporter insert to define meiotic recombination domains on chromosome III of Saccharomyces cerevisiae. Mol. Cell. Biol. 19: 4832–4842. [DOI] [PMC free article] [PubMed] [Google Scholar]
- Borde, V., A. S. Goldman and M. Lichten, 2000. Direct coupling between meiotic DNA replication and recombination initiation. Science 290: 806–809. [DOI] [PubMed] [Google Scholar]
- Borde, V., W. Lin, E. Novikov, J. H. Petrini, M. Lichten et al., 2004. Association of Mre11p with double-strand break sites during yeast meiosis. Mol. Cell 13: 389–401. [DOI] [PubMed] [Google Scholar]
- Gerton, J. L., J. DeRisi, R. Shroff, M. Lichten, P. O. Brown et al., 2000. Inaugural article: global mapping of meiotic recombination hotspots and coldspots in the yeast Saccharomyces cerevisiae. Proc. Natl. Acad. Sci. USA 97: 11383–11390. [DOI] [PMC free article] [PubMed] [Google Scholar]
- Hillers, K. J., and A. M. Villeneuve, 2003. Chromosome-wide control of meiotic crossing over in C. elegans. Curr. Biol. 13: 1641–1647. [DOI] [PubMed] [Google Scholar]
- Kaback, D. B., V. Guacci, D. Barber and J. W. Mahon, 1992. Chromosome size-dependent control of meiotic recombination. Science 256: 228–232. [DOI] [PubMed] [Google Scholar]
- Kaback, D. B., D. Barber, J. Mahon, J. Lamb and J. You, 1999. Chromosome size-dependent control of meiotic reciprocal recombination in Saccharomyces cerevisiae: the role of crossover interference. Genetics 152: 1475–1486. [DOI] [PMC free article] [PubMed] [Google Scholar]
- Mortimer, R. K., D. Schild, C. R. Contopoulou and J. A. Kans, 1991. Genetic and physical maps of Saccharomyces cerevisiae. Methods Enzymol. 194: 827–863. [DOI] [PubMed] [Google Scholar]
- Munz, P., 1994. An analysis of interference in the fission yeast Schizosaccharomyces pombe. Genetics 137: 701–707. [DOI] [PMC free article] [PubMed] [Google Scholar]
- Papazian, H. P., 1952. The analysis of tetrad data. Genetics 37: 175–188. [DOI] [PMC free article] [PubMed] [Google Scholar]
- Perkins, D. D., 1949. Biochemical mutants in the smut fungus Ustilago maydis. Genetics 34: 607–626. [DOI] [PMC free article] [PubMed] [Google Scholar]
- Petronczki, M., M. F. Siomos and K. Nasmyth, 2003. Un menage à quatre: the molecular biology of chromosome segregation in meiosis. Cell 112: 423–440. [DOI] [PubMed] [Google Scholar]
- Snow, R., 1979. Maximum likelihood estimation of linkage and interference from tetrad data. Genetics 92: 231–245. [DOI] [PMC free article] [PubMed] [Google Scholar]
- Sym, M., and G. S. Roeder, 1994. Crossover interference is abolished in the absence of a synaptonemal complex protein. Cell 79: 283–292. [DOI] [PubMed] [Google Scholar]