

Abstract
To identify hypothesized missing components of the synaptic Gαo-Gαq signaling network, which tightly regulates neurotransmitter release, we undertook two large forward genetic screens in the model organism C. elegans and focused first on mutations that strongly rescue the paralysis of ric-8(md303) reduction-of-function mutants, previously shown to be defective in Gαq pathway activation. Through high-resolution mapping followed by sequence analysis, we show that these mutations affect four genes. Two activate the Gαq pathway through gain-of-function mutations in Gαq; however, all of the remaining mutations activate components of the Gαs pathway, including Gαs, adenylyl cyclase, and protein kinase A. Pharmacological assays suggest that the Gαs pathway-activating mutations increase steady-state neurotransmitter release, and the strongly impaired neurotransmitter release of ric-8(md303) mutants is rescued to greater than wild-type levels by the strongest Gαs pathway activating mutations. Using transgene induction studies, we show that activating the Gαs pathway in adult animals rapidly induces hyperactive locomotion and rapidly rescues the paralysis of the ric-8 mutant. Using cell-specific promoters we show that neuronal, but not muscle, Gαs pathway activation is sufficient to rescue ric-8(md303)'s paralysis. Our results appear to link RIC-8 (synembryn) and a third major Gα pathway, the Gαs pathway, with the previously discovered Gαo and Gαq pathways of the synaptic signaling network.
INTENSIVE research over the past 15 years has yielded a molecular description of the core machinery that drives synaptic vesicle fusion and neurotransmitter release (Lin and Scheller 2000; Rizo and Sudhof 2002). Although important questions remain, a major challenge now becomes to define and to understand the logic of the network of signal transduction pathways that regulates neurotransmitter release, because these pathways are likely to serve as key substrates for behavioral modification, learning, and memory.
The available evidence suggests that as many as three major classes of Gα signaling proteins could be involved in regulating different aspects of neurotransmitter release: Gαq, Gαo/i, and Gαs. Biochemical studies have revealed that the binding of neurotransmitter to receptors coupled to these G proteins causes the receptors to act as guanine-nucleotide exchange factors (GEFs) that put the Gα protein in the GTP-bound activated state and facilitate its dissociation from the βγ subunits of the G protein (Hepler and Gillman 1992; Neer 1995; Bourne 1997). Our knowledge of how these three major Gα pathways affect neurotransmitter release is a mixture of single pathway studies and other intriguing, but poorly understood, observations. For example, we know that the Gαq pathway produces, among other possible effectors, the small molecule diacylglycerol (DAG; Singer et al. 1997). Although the effects on neurotransmitter release of knocking out the Gαq pathway have not been investigated, experiments using phorbol esters (molecular analogs of DAG) suggest that activating the Gαq pathway can strongly potentiate evoked neurotransmitter release and even stimulate spontaneous release (Malenka et al. 1986; Parfitt and Madison 1993; Stevens and Sullivan 1998; Hori et al. 1999; Waters and Smith 2000). Proteins of the Gαo/i family arouse interest because of their puzzling localization on synaptic vesicles (Ngsee et al. 1990; Aronin and DiFiglia 1992; Ahnert-Hilger et al. 1994) and because they are found at remarkably high concentrations in brain (Sternweis and Robishaw 1984). The third pathway, controlled by Gαs, clearly plays an important role in learning and memory and in the synaptic facilitation paradigms thought to represent physiological correlates for some forms of learning and memory (Davis et al. 1995; Kandel and Pittenger 1999; Kandel 2001).
The logic behind how these three pathways interact with each other, if indeed they do, has largely eluded researchers. Do the pathways intersect/converge, or do they represent independent parallel pathways? What are the key downstream effectors that mediate the interactions of each pathway with the neurotransmitter release machinery? Are the pathways active only in response to receptor stimulation, or can they be kept active independently of continued receptor input? Finally, what determines when and where the pathways are active to ultimately produce, or allow, a coherent, coordinated behavior?
Genetic studies of the Caenorhabditis elegans EGL-30 (Gαq) pathway have begun to shed light on some of these questions by revealing a large network of proteins that regulates neurotransmitter release (Figure 1). As in vertebrates, Gαq's action in the C. elegans nervous system appears to be mediated by phospholipase Cβ (EGL-8), although the C. elegans studies also point to one or more unidentified Gαq effectors (Lackner et al. 1999; Miller et al. 1999; Bastiani et al. 2003). According to the model, EGL-8 (PLCβ) makes the small molecule DAG, which is involved in activating the synaptic vesicle priming mechanism by binding to, among other possible targets, the C1 domain of UNC-13 (Maruyama and Brenner 1991), which is a large, conserved protein that interacts with the synaptic vesicle fusion machinery (Betz et al. 1997; Sassa et al. 1999) and which is required for synaptic vesicle priming (Aravamudan et al. 1999; Augustin et al. 1999; Richmond et al. 1999; Richmond et al. 2001). C. elegans researchers can identify proteins involved in EGL-30 (Gαq) signaling through genetic screens centered around easily recognizable phenotypes that affect locomotion, egg laying, and growth on aldicarb. Loss-of-function mutations in positive regulators of neurotransmitter release (the green proteins in Figure 1) tend to cause paralysis, decreased egg laying, and resistance to aldicarb, while loss-of-function mutations in negative regulators (the red proteins in Figure 1) tend to cause hyperactive locomotion and egg laying and hypersensitivity to aldicarb. In recent years, genetic screens centered on these phenotypes, as well as related suppressor screens, have begun to uncover a large network of proteins. This network includes another major Gα protein, GOA-1 (Gαo), which negatively regulates the EGL-30 (Gαq) pathway by one or more unknown mechanisms, a DAG kinase that antagonizes the EGL-30 pathway, and two RGS proteins that negatively regulate each Gα protein (see Figure 1 and references in its legend).
Figure 1.—

Pathway model of the Gαo-Gαq signaling network as inferred from C. elegans genetic studies. Solid lines indicate that direct interactions are known or likely, while dashed lines and/or large gaps between line endpoints and downstream effectors indicate predicted interactions or missing components. Proteins that positively regulate neurotransmitter release are shown in green. Reducing green protein function results in aldicarb resistance, paralysis or decreased locomotion, decreased egg laying, and, in some cases, paralytic larval arrest. Proteins that inhibit neurotransmitter release are shown in red blocks. Reducing red protein function results in aldicarb hypersensitivity and increased rates of locomotion and egg laying. The bottom green dashed lines represent hypothetical components (searched for using the genetic screens herein) that could positively regulate the EGL-30 (Gαq) pathway to establish or maintain synapse activation. This model is based on the following studies: Maruyama and Brenner (1991), Mendel et al. (1995), Segalat et al. (1995), Brundage et al. (1996), Koelle and Horvitz (1996), Hajdu-Cronin et al. (1999), Lackner et al. (1999), Miller et al. (1999)(2000), Nurrish et al. (1999), Richmond et al. (1999)(2001), Robatzek and Thomas (2000), Chase et al. (2001), Robatzek et al. (2001), van der Linden et al. (2001), Bastiani et al. (2003), and Tall et al. (2003).
While many aspects of the model in Figure 1 are well supported, other connections are poorly understood, as represented by the dashed lines in the model. In addition, the model includes several mechanisms for negatively regulating the Gαq pathway, but it seems reasonable to expect that synapses might have one or more mechanisms for positively regulating the Gαq pathway, perhaps even in the absence of continuous receptor stimulation. Such a need might arise, for instance, if a synapse needed to be kept in an active state for an extended period of time. One protein that appears required for proper activation of the EGL-30 (Gαq) pathway is RIC-8 (synembryn), originally identified in C. elegans as a novel, conserved protein that functions upstream of EGL-30 (Gαq) (Miller et al. 2000) and recently revealed by biochemical studies to be a GEF that helps monomeric Gα subunits (including, but not limited to, Gαq) to attain the GTP-bound activated state independently of receptor stimulation (Tall et al. 2003; Figure 1). However, given the central importance of the core Gαq pathway with respect to neurotransmitter release (Reynolds et al. 2005, accompanying article in this issue), we hypothesized that there could be other components, in addition to RIC-8, that positively regulate, or otherwise impinge upon, the EGL-30 (Gαq) pathway (Figure 1).
To identify some of these hypothetical missing components, and others alluded to above, we undertook two large forward genetic screens and focused first on mutations that strongly suppress the paralysis associated with reduced RIC-8 function. Our results appear to link RIC-8 (synembryn) and a third major Gα pathway, the Gαs pathway, with the previously discovered Gαo-Gαq signaling network. Together with the accompanying study (Reynolds et al. 2005), these results suggest that three highly conserved Gα signaling pathways form the synaptic signaling network, an integrated molecular circuit that is likely to be a major substrate for behavioral modification, learning, and memory.
MATERIALS AND METHODS
Worm culture and observation:
Twenty-four-well culture plates (Evergreen 222804401F) were prepared in sets of 80 or 120 using a plate-dispensing machine to dispense 2.8 ml (for genetic screening plates) or 2.3 ml (for integration plates) into each well. Plates were cured 3 days at room temperature before seeding each well with 10 μl of OP-50 culture using a repeat pipetter with a sterile tip. Seeded plates were dried for 1 hr in a 37° room with the lids off before returning to room temperature for 4 more days, stacked lid side up. Plates were then wrapped in plastic wrap and stored at room temperature or 4°. All culture media was made with Sigma (St. Louis) A-7002 agar. All other worm culture was based on previously described methods (Brenner 1974). Worms were observed and manipulated using Olympus SZX-12 stereomicroscopes equipped with ×1.2, 0.13 numerical aperture plan apochromatic objectives. Unless otherwise specified, wild-type worms were C. elegans variety Bristol, strain N2. acy-1(pk1279) was maintained over the closely linked mutation dpy-17(e164) as the strain NL1999, which was kindly provided by Celine Moorman and Ron Plasterk.
Genetic screens:
All but one of the mutants described in this article were isolated in the genetic screens described below. A clonal screen for mutants with hyperactive locomotion was performed in weekly cycles by plating 2000 mature adult F1 progeny of ethyl methanesulfonate (EMS)-mutagenized N2 hermaphrodites on individual wells of 24-well culture plates. Plates were loaded in the afternoon and incubated overnight at 14°, which allowed each F1 to lay an average of ∼40 eggs. To prevent the small food supply in each well from being exhausted before potentially slow-growing mutant F2's fully matured, the F1's were picked from each well and killed after the overnight incubation at 14°. The F2 progeny on the plate were then allowed to mature to adulthood by incubating 23 hr at 14° followed by 72 hr at 20°. At this point the plates were screened, and wells perceived to contain hyperactive mutants were noted. From these wells, three to five candidate hyperactive mutants were cloned to individual streak plates and incubated 5 days at 20° to produce populations of animals. A plate containing a population judged to be homozygous for a hyperactive mutation was then scored for various hyperactive behaviors and characteristics and then used to produce a working stock and frozen culture.
Similarly, a clonal screen for mutations that suppress the nearly paralyzed phenotype of ric-8(md303) mutants was performed in weekly cycles by plating 2000 mature adult F1 progeny of EMS-mutagenized ric-8(md303) hermaphrodites on 24-well culture plates. The plating methods were the same as described for the N2 screen, except that the F1 populations used for plating were allowed to mature at 14°, since ric-8(md303) produces larger broods at this temperature. The plated F1's were incubated overnight at 14° followed by 4 days at 20° before screening. Wells were screened as described for the N2 hyperactive screen, except that the plates were regularly picked up and dropped on the microscope stage to provide a stimulus for movement. Unstarved ric-8(md303) single mutants only rarely show movement in response to this stimulus, whereas ric-8(md303) animals containing a strong suppressor mutation will move well, often even in the absence of plate dropping.
Screens were performed as described above, in weekly cycles, alternating between 3 successive cycles of each screen, for 16 cycles for the ric-8 suppressor screen and 12 cycles for the N2 hyperactive screen. We estimate that each cycle screened 3000 mutagenized genomes for a total of 48,000 mutagenized genomes for the ric-8 suppressor screen and 36,000 for the N2 hyperactive screen. The md1756 mutation was isolated in a previously described smaller genetic screen for suppressors of ric-8(md303) (Miller et al. 1999).
Complementation tests and outcrossing:
When analyzing new mutants isolated in the hyperactive mutant screen, mutants that strongly resembled loss-of-function mutations in one of the known genes of goa-1, dgk-1, eat-16, or gpb-2 were immediately complement tested with a known mutant in the suspected gene, using standard methods. Mutants not corresponding to the known genes were outcrossed four times by crossing heterozygous males with dpy-5(e61) hermaphrodites and then reisolating the mutation in the F2 generation and repeating this procedure once.
Mutants isolated in the ric-8(md303) suppressor screen were first analyzed by crossing N2 males to ric-8(md303); sup-x double-mutant hermaphrodites and then isolating putative homozygous sup-x single mutants in the F2 generation. One-time outcrossed suppressor mutants that were X-linked and resembled dgk-1 mutants were immediately complement tested against dgk-1. All other one-time outcrossed suppressor mutants were crossed back into a ric-8(md303) background to test suppression by crossing sup-x/+ males to ric-8(md303) hermaphrodites and reisolating three-time outcrossed versions of both the sup-x single mutant and the ric-8(md303); sup-x double mutant in the F2 generation. This cross was then repeated to produce five-time outcrossed versions of the sup-x single and the ric-8(md303); sup-x double mutants.
The dominant mutation acy-1(md1756) was outcrossed in a ric-8(md303) background by crossing md1756; md303 males to md303 hermaphrodites. Suppressed male progeny of this cross (genotype md1756/+; md303/md303) were then crossed again to ric-8(md303), and this process was repeated two times. Suppressed virgin hermaphrodite progeny from the final cross were then allowed to self-fertilize, and candidate homozygous four-time outcrossed md1756; md303 double mutants were isolated and confirmed by the absence of md303 single mutants in the next generation. md1756 single mutants were isolated after the mutation was mapped (see below) by first placing md1756 over the balancer qC1 to facilitate identification of md1756 homozygotes.
The egl-30(ce263) mutation was lethal in a wild-type background or as the trans-heterozygote ce263/+; md303/+. This mutation was therefore outcrossed by crossing md303/+ males to ce263; md303 hermaphrodites and reisolating putative ce263; md303 double mutants in the F2 generation. Putative double mutants were tested for homozygosity by allowing them to self-fertilize and then checking for the absence of ric-8(md303) single mutants among the self-progeny.
Mapping and sequencing mutations:
All mutations were mapped entirely with respect to single nucleotide polymorphisms (SNPs) using the CB4856 SNP mapping strain (Table 1). Most of the mutations were mapped by crossing CB4856 males to homozygous mutant hermaphrodites. Virgin F1 hermaphrodite progeny of this cross were then cloned to individual culture plates and allowed to self-fertilize. Candidate homozygous mutants were then reisolated from the resulting F2 population and cloned to individual streak plates. The progeny of these animals were then checked for homozygosity (absence of wild-type animals), and, upon starvation, we checked the homozygous cultures for various CB4856 SNPs using the methods described below.
TABLE 1.
SNPs used to fine map synaptic signaling network mutations
| Linkage group |
Allele | Genetic positiona |
Clone location on clone |
Method of IDb | Enzyme | N2 products (bp) |
CB4856 products (bp) |
|---|---|---|---|---|---|---|---|
| I | ceP27 | −21.50 | ZC123-21628 | Snip-SNP | SspI | 347 | 195/152 |
| I | ceP28 | −17.64 | Y48G8AR-11223 | Snip-SNP | ApoI | 306 | 193/113 |
| I | ceP32 | −19.96 | C45G6-19957 | Snip-SNP | BsiEI | 329 | 188/141 |
| I | ceP75 | −13.85 | Y71G12B-85969 | Snip-SNP | BsaHI | 735 | 446/289 |
| I | ceP76 | −12.50 | Y71G12A-29112 | Snip-SNP | SspI | 597 | 374/223 |
| III | ceP35 | −3.44 | F25F2-15611 | Snip-SNP | DdeI | 394 | 231/163 |
| III | ceP39 | −2.14 | Y54H5A-20087 | Snip-SNP | TspRI | 350 | 220/130 |
| III | ceP42 | −2.56 | F26A1-7094 | Seq-SNP | NA | NA | NA |
| X | ceP34 | −3.93 | Y23B4A-12491 | Snip-SNP | Hpy188I | 370 | 232/138 |
| X | ceP43 | −3.32 | T13C5-12745 | Snip-SNP | RsaI | 355 | 239/116 |
| X | ceP45 | −3.77 | F22F4-6421 | Seq-SNP | NA | NA | NA |
Listed are the SNP markers used to fine map the mutations described in Figure 2 of this article. SNP assays were designed as described above in the supplemental SNP mapping protocol at http://www.genetics.org/supplemental/, using data derived from Wicks et al. (2001) and the C. elegans SNP website (http://genome.wustl.edu/projects/celegans/index.php?snp=1). The unique allele numbers assigned to each SNP used in this article are not meant to be official names of these SNPs, since they were all previously discovered (Wicks et al. 2001) and may now have other names.
Extrapolated genetic position as given by WormBase Freeze WS100 (http://www.wormbase.org).
Snip-SNP, a SNP identified by restriction digest; Seq-SNP, a SNP identified by sequencing.
acy-1(md1756) was mapped by its suppressor activity in a ric-8(md303) background by crossing md1756; ric-8(md303) males to a strain of ric-8(md303) that had been outcrossed 12 times into a CB4856 background. Virgin cross progeny were cloned to individual culture plates and putative homozygous md1756; ric-8(md303) double mutants were reisolated from the progeny of these animals and cloned to individual plates. Homozygosity was confirmed after one to two generations and the plates were allowed to starve out and processed as described below.
egl-30(ce263) was mapped by crossing CB4856 males to ric-8(md303) (12 times outcrossed into CB4856) and crossing the resulting md303/+ (CB4856) males to ce263; md303 hermaphrodites. Only cross progeny homozygous for md303 will survive this cross. Putative homozygous ce263; md303 double mutants were then reisolated in the following generation, confirmed in the generation after this, and homozygous mutant cultures were allowed to starve out and processed as described below.
To map a mutation at high resolution, we typically isolated ∼300–400 F2 homozygous mutant progeny that had been crossed through the mapping strain and let their cultures go to starvation on individual culture plates before processing as described below.
Once a mutation had been mapped to an interval of <250 kb, we amplified candidate genes from mutant lysates and sequenced the coding exons and intron/exon boundaries as described (Miller et al. 2000).
Identification of cultures containing specific CB4856 SNPs:
Starved cultures of homozygous mutants that had been passed through the CB4856 mapping strain were harvested and lysed in preparation for PCR by rinsing with 500 μl ddH2O and by recovering 100 μl of the worm suspension. Suspensions were added to a 96- × 650-μl deep-well block (Marsh Bio Products, Rochester, NY). An equal volume (100 μl) of lysis buffer (50 mm KCl; 10 mm Tris-HCl, pH 8.2; 2.5 mm MgCl2; 0.45% Tween-20; 0.5 mg/ml gelatin; 200 μg/ml proteinase K) was added to each well. The block was sealed with a flexible mat lid (Marsh Bio Products) and placed at −85° for at least 1 hr and then double wrapped in plastic wrap and put in a hybridization oven (Bellco) at 65° for 4 hr. The plate was vortexed for ∼30 sec after 1 hr at 65° and again at the end of the incubation period. To inactivate the proteinase K, the 96-well blocks were incubated in a Bellco hybridization oven at 95° for 30 min and then spun 5 min at 800 rpm to pellet insoluble debris. Control lysates (usually CB4856, prepared in a separate block) were usually added to selected wells left empty until this point. Blocks were stored for up to 1 month at 4° (double wrapped in plastic wrap) or frozen for longer storage.
Designing SNP assays:
Using the C. elegans SNP database (http://genome.wustl.edu/projects/celegans/index.php?snp=1) we sought snip-SNPs in the regions of interest that could be identified by a restriction enzyme that cuts the SNP site in CB4856, but not in N2, and for which other sites cut by that enzyme (in both CB4856 and N2) are not closer than 90–100 bp from the unique SNP site. Primers were designed to be centered around the SNP such that, after cutting, the N2 SNP-containing fragment is ∼400–750 bp in size and the CB4856 SNP-containing fragment is ∼100 bp smaller.
SNP analysis:
To identify which wells in a 96-well block of mutant lysates contain a specific snip-SNP, we dispensed 25 μl of a PCR master mix to the wells of a 96-well PCR plate. Each 25-μl reaction consists of 2.5 μl of 10× PCR buffer, 1 μl of a 10 pmol/μl stock of each primer, 2 μl of a dNTP stock (stock of 2.5 mm each dNTP), 2 μl of 30% sucrose, 1 μl of 0.1% cresol red, 15.4 μl of ddH2O, and 0.122 μl of a 5 units/μl stock of Taq polymerase (Wicks et al. 2001). A 96-pin plastic replicator (Incyte Genomics ATD-5000) was then inserted into the 96-well block containing the mutant lysates. We noted that the PCR reactions worked significantly better if the 96-well block of mutant lysates was spun 3 min at 800 rpm within 5 min of replicating the lysates. The 96-well PCR plate containing the master mix was then placed, without its lid in place, in a thermal cycler [MJ Research (Watertown, MA) DNA engine] paused at the denaturation step of the first cycle. The 96-pin replicator was then withdrawn from the lysate block and immediately inserted in the PCR plate, swished briefly, and withdrawn, dragging the spikes along the sides of each well. The PCR plate was then sealed with Microseal A film (MJ Research) using a roller to seal all regions of the plate. The PCR program was then resumed, and the reactions were PCR'ed for 35 cycles of 94° for 40 sec, 57° for 40 sec, and 72° for 40 sec, followed by 72° for 5 min. During thermal cycling, a restriction enzyme master mix was assembled, consisting of 3.5 μl of 10× buffer, 3.5 μl of 10 mg/ml bovine serum albumin, 1 μl of 30% sucrose, 0.5 μl of 0.1% cresol red, 4–5 units of enzyme, and ddH2O to bring to 10 μl/reaction (Wicks et al. 2001). After thermal cycling, 10 μl of the restriction master mix was dispensed to each well followed by incubation at the optimal digest temperature for 2 hr. Products were resolved by loading 12 μl of each reaction on a 2% agarose 100-lane gel (Owl Centipede gel system with 2- × 50-well combs) with ethidium bromide (0.5 μg/ ml) included in the gel and buffer. Gels were run for 45 min at 140 V, and lanes containing CB4856 products were noted.
To test multiple snip-SNPs in parallel (e.g., one snip-SNP from each chromosome), a PCR master mix was first prepared without primers and then divided equally into batches of 24 reactions before adding primers specific for each snip-SNP to be tested. The mixes were then dispensed to a PCR plate in sets of 24 and processed from there as described above. Similarly, restriction enzyme master mixes were first assembled without 10× buffer or enzyme and then divided into batches of 24 reactions before adding buffer and enzyme specific for each snip-SNP. In this way, a 96-well block that is only partially full (with at least 24 samples) can be used to test multiple SNPs.
To test specific lysates for SNPs by sequencing, we assembled, in individual 200-μl PCR tubes, 100-μl reactions with the same components as above, except we included no sucrose or cresol red, and 0.5 μl of sample lysate was added directly to each reaction. If the SNP had not been previously confirmed, CB4856 control lysates were PCR'ed in parallel. Reaction products were purified using the Wizard PCR Prep (Promega, Madison, WI) and submitted for sequence analysis using an appropriate primer.
Long PCR products and plasmids:
All long PCR products were produced via Expand 20 kb+ (Roche) amplification of purified N2 genomic DNA, according to the manufacturer's instructions. The 12.4-kb kin-2 gene rescuing PCR product KG370/371 includes ∼5 kb of native kin-2 upstream sequence as well as the kin-2 gene and its putative 3′ control region. The pAC2 plasmid was kindly provided by Mike Nonet and contains the P260S gain-of-function mutation in the acy-1 gene driven by the acy-1 native promoter. To construct KG#81 [myo-3::acy-1(gf) cDNA], we applied reverse transcriptase to purified C. elegans mRNA and synthesized the 1155-bp 5′ part of the acy-1 cDNA. This fragment was then fused to the partial cDNA clone yk35d9, using an internal SphI site and a 5′ site that had been engineered into the 5′ primer. QuikChange mutagenesis was used to introduce the P260S gain-of-function mutation by changing a CCT to a TCT at nucleotide 778 from the start of the coding region. The 3.8-kb acy-1 coding region was then amplified using Pfu ultra polymerase and primers engineered with restriction sites and cloned into AgeI/XhoI-cut pPD96.52, a C. elegans muscle expression vector. The final construct was sequenced and a clone was chosen that contained no additional mutations. To make KG#83 [rab-3::acy-1(gf) cDNA], we used AgeI/XhoI to cut out the 3800-bp acy-1(P260S) cDNA from KG#81 and cloned this fragment into like-digested KG#59, which is identical to pPD96.52 except that the myo-3 promoter has been replaced with the 1.2-kb rab-3 neuronal-specific promoter.
Production of transgenes:
Transgenic strains bearing extrachromosomal arrays were produced by the method of Mello et al. (1991). pBluescript carrier DNA was used, if necessary, to bring the final concentration of DNA in the injection mixture to 175 ng/μl. ceEX1 [kin-2::kin-2 gene] was produced by injecting kin-2(ce179) mutants with the KG370/371 PCR product at 20 ng/μl, along with the marker plasmid pPD118.20 [myo-3::GFP]. ceEx49 [acy-1::acy-1 (gf) gene] was produced by injecting pha-1(e2123) animals with pAC2 at 2 ng/μl along with the pha-1(+) rescuing plasmid pBx (70 ng/μl). ceIs6 [myo-3::acy-1(gf) cDNA] and ceIs11 [rab-3::acy-1(gf) cDNA] were produced by injecting pha-1(e2123) animals with KG#81 (10 ng/μl) and KG#83 (10 ng/μl), respectively, along with the pha-1(+) cotransformation marker plasmid pBx, and then integrating the resulting transgenes. To integrate the transgenes, we irradiated growing cultures with 4200 rad of Cs-137 gamma irradiation, then picked four L4-stage animals to each of 12 culture plates and grew them 6 days at 25° to let the cultures starve. A chunk of media from each starved culture was then transferred to a fresh plate and grown 2 days at 25°. From each of the 12 plates, 24 adult animals were picked to wells of solid media on a 24-well plate (288 wells total) and grown 1 day at 25°. The adults were picked off and the plates were incubated 1 day at 25° to allow the eggs to hatch. Cultures were screened for 100% transmission of the temperature-sensitive embryonic-lethal pha-1 marker by identifying wells that contained no unhatched eggs.
RNAi:
For kin-2 RNAi, the entire 1131-bp kin-2 coding region was amplified by PCR, cloned into the L4440 RNAi vector, and transferred into the HT115(DE3) expression strain. After inducing expression of the double-stranded RNA, the kin-2 RNAi expression strain was fed to wild-type animals and their progeny (Kamath et al. 2001; Timmons et al. 2001).
Double-mutant strain construction and verification:
Unless otherwise specified, double mutants were constructed using standard genetic methods without additional marker mutations and were confirmed by crossing N2 males to the double mutant, cloning 12 L4 hermaphrodite cross progeny and confirming the presence of both mutant phenotypes and wild type among the progeny of each animal. Outcrossed versions of the ric-8(md303); sup-x double mutants isolated in this study were produced during outcrossing as described above. We constructed gsa-1(ce81); acy-1(pk1279) double mutants by crossing ce81/+ males to pk1279/dpy-17(e164) hermaphrodites. L4 progeny of this cross were then cloned and, from plates segregating both mutant phenotypes, 40 putative pk1279/+; ce81 animals were cloned. From this group, plates found to be homozygous for ce81 (no wild type) were tested for the presence of the pk1279 mutation by PCR using primers flanking the pk1279 deletion. ce81 homozygous cultures found to carry pk1279 were then expanded, and each culture was retested for the presence of the pk1279 deletion. After collecting putative double-mutant larvae from these cultures for documentation and assays (see below), a portion of the population was used to confirm homozygosity of pk1279 by duplicate reactions of double-amplification PCR using nested primers that are completely internal to the deletion and by comparing to wild-type positive control reactions amplified with the same master mix and containing the same number and same stage of animals in each tube. To construct ric-8(md303) dpy-20(e1282); pkIs296, we started with NL545 dpy-20(e1362); pkIs296 [HS::gsa-1(Q208L) dpy-20(+)] (Korswagen et al. 1998) and replaced dpy-20(e1362) in this strain with dpy-20(e1282), because e1282 males mate better. We then crossed dpy-20(e1282); pkIs296 males to ric-8(md303) dpy-20(e1282) hermaphrodites and used standard methods to produce the final strain. ceIs6; ric-8(md303) and ceIs11; ric-8(md303) double mutants were confirmed by sequencing the ric-8(md303) locus and by confirming that 100% of animals were positive for the GFP cotransformation marker.
Neuronal vacuole counting:
Animals that had never been starved were picked from growing cultures, mounted on 2% agarose pads in 1 mm sodium azide in M9 buffer and viewed using ×40 dry DIC optics on a Zeiss Axioplan upright microscope. The number of neuronal vacuoles in the head ganglia, ventral cord, and tail ganglia were noted and counted. For each strain, 10 animals from each stage (L1/L2, L2/L3, L4, and young adult) were assayed in this way.
Locomotion assays:
Standard locomotion assays were performed as previously described using standardized plates and a standardized definition of a body bend (Miller et al. 1999). Exaggerated movements in which the animal doubles back on itself during reversal such that the tail touches the anterior of the body in a figure-eight pattern were scored as three body bends (this applied only to the egl-30 gain-of-function mutants and to strains treated with phorbol esters in this study). For coiling movements, a body bend was counted every 90° around the circle.
To assay acy-1(pk1279)-containing strains, synchronized, larval-arrested, homozygous larvae, along with identically staged wild-type and single-mutant control larvae, were collected and assayed for locomotion rate as described (Reynolds et al. 2005). For heat-shock locomotion assays four young adults were picked from growing cultures for each of four locomotion assay plates. These plates were heat-shocked at 13-min intervals, and, at the specified times after heat shock, two of the four animals on each plate were randomly chosen, and body bends were counted for 6 min for each animal. To heat-shock, plates were triple sealed with parafilm strips, immersed in a 33° water bath for the specified time, using stacks of 33° equilibrated glass microscope slides to hold each plate completely immersed. At the end of the heat shock, plates were immersed in slushy ice water for 35 sec, dried, and incubated at room temperature for the specified time before beginning the assay.
Video production:
Images of worms on agar plates containing OP-50 bacterial lawns were captured using a Sony CCD-IRIS black-and-white video camera mounted on an Olympus SZX-12 stereomicroscope and recorded on a Panasonic AG-DV1000 digital videocassette recorder. Video clips were transferred via a firewire connection to a Macintosh Powerbook G4 and captured as an NTSC file using Final Cut Pro 3 (Apple). Cleaner 6 (Discrete) was then used to crop and trim each clip and to convert them to compressed QuickTime videos.
Drug sensitivity assays:
Aldicarb sensitivity assays using the population growth rate method were performed as previously described (Miller et al. 1999). Aldicarb and levamisole acute paralysis assays on solid media were performed as previously described (Lackner et al. 1999; Nurrish et al. 1999), except the concentration of aldicarb and levamisole in the media was 2000 and 800 μm, respectively. For the paralysis assays, aldicarb was added from a 10-mm stock solution in ddH2O (allowing ∼2–3 hr for dissolving before adding to the 55° cooled molten media), and media was made with 20% less water than normal to compensate for the large drug volume. Levamisole was added to 55° cooled molten media from a 200-mm stock solution in ddH2O. Aldicarb and levamisole-containing plates were seeded with OP-50 on the day that they were poured and stored at room temperature for 2 days, lid side up, before using. Levamisole acute paralysis assays in liquid were carried out in microtiter plates containing 30 μl of 2% agarose in each well and 50 μl of 100 μm levamisole in M9 on top of that. For each of three trials for each strain, three wells of 10 animals per well were loaded over a 3-min period and then the number of animals paralyzed (not thrashing) were counted at the specified intervals. It should be noted that the levamisole resistance of the strains in this study was significantly more pronounced in this liquid assay, when compared to the assay on solid media (e.g., compare Figures 6B and 7B).
Figure 6.—
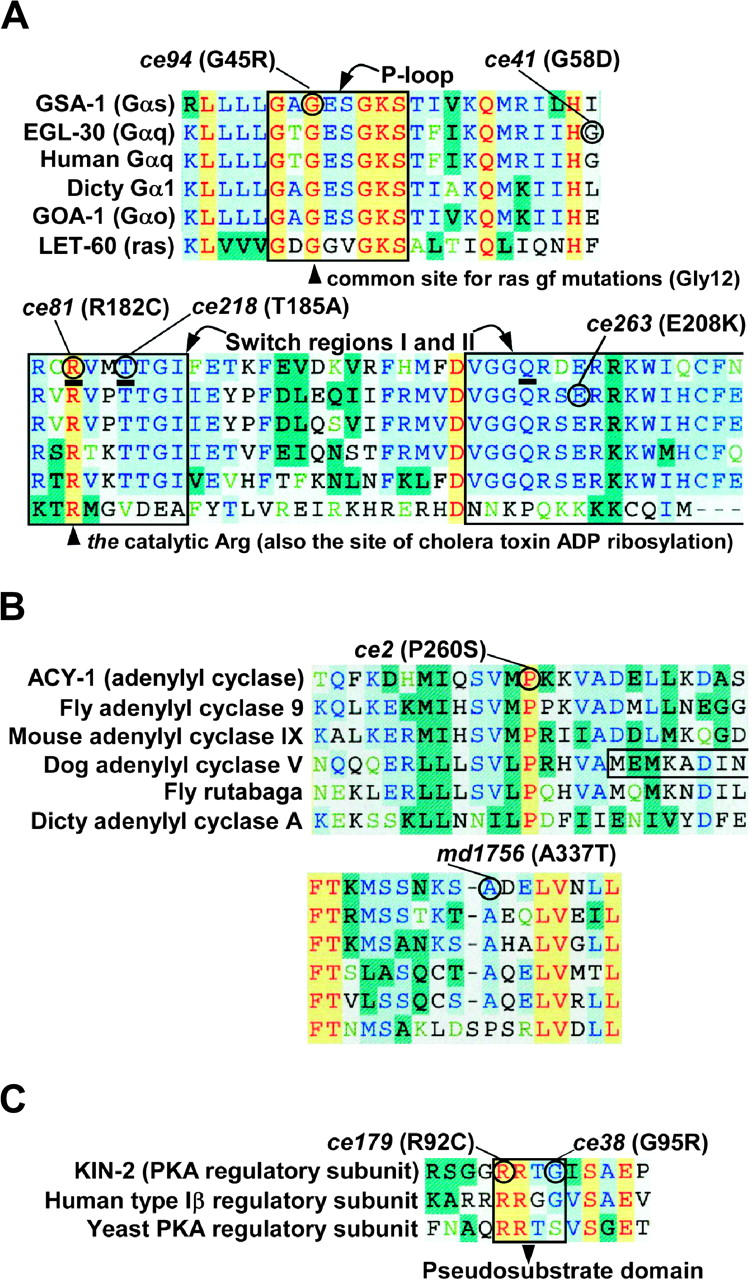
Molecular analysis of ric-8(md303) suppressor mutations reveals both known and novel gain-of-function mutations in the Gαs and Gαq pathways. (A) Gain-of-function mutations in GSA-1 (Gαs) and EGL-30 (Gαq) disrupt residues critical for GTP hydrolysis. Shown are amino acid sequence alignments of two regions relevant to the Gα mutations described herein. Residues that are identical in all six proteins are highlighted yellow, those identical in five of six are highlighted light blue, and other colors indicate various degrees of less-conserved residues. The boxed area labeled “P-loop” in the upper alignment indicates the boundaries of the phosphate-binding loop that binds the βγ phosphates of GTP (Vetter and Wittinghofer), which is thought to participate in stabilizing a pentavalent intermediate of GTP hydrolysis (Sondek et al. 1994). Boxes in the lower alignment delineate the boundaries of two of the three moveable switch elements that are directly involved in GTP hydrolysis, as defined by Sunahara et al. (1997). The three residues underlined in the GSA-1 (Gαs) sequence correspond to residues proposed to form the pentavalent intermediate active site for GTP hydrolysis (Sondek et al. 1994). GSA-1 (Gαs) and EGL-30 (Gαq) gain-of-function mutations identified in this study are circled, and the specific amino acid change is stated. Note that two of the three gsa-1 gain-of-function mutations identified in this study change active site residues. Arrowheads point to amino acids corresponding to a common site of ras gain-of-function mutations (which is the same residue mutated in gsa-1(ce94)) and the catalytic arginine that is ADP ribosylated by cholera toxin, which is mutated in gsa-1(ce81)). Accession numbers for the six proteins (from top to bottom) are GI:2443297, U56864, P50148, M25060, M38251, and A36290. (B) Gain-of-function mutations in ACY-1 change conserved residues in the C1 catalytic domain. Shown are amino acid sequence alignments of two regions in adenylyl cyclase's C1 catalytic domain that are relevant to the mutations described herein. The aligned sequences in each region, as indicated, include C. elegans ACY-1, mouse and fly orthologs of ACY-1 (known as type IX adenylyl cyclase), dog adenylyl cyclase V, the fly rutabaga gene product, and Dictystelium adenylyl cyclase A. A three-sided box in the dog adenylyl cyclase V sequence indicates the start of the C1 region that was used for a previous structural study (Tesmer et al. 1997). Note that the ce2 gain-of-function mutation changes an absolutely conserved Pro residue near the beginning of the C1 domain. The md1756 mutation changes a conserved Ala residue that corresponds to a known contact point between the C1 and C2 domains, as revealed by structural studies (Tesmer et al. 1997; Zhang et al. 1997). Accession numbers for the six proteins (from top to bottom) are CAA84795, AF005630, AAC52603, M88649, M81887, and Q03100. (C) Strong reduction-of-function mutations in KIN-2 (regulatory subunit of protein kinase A) change conserved residues in the small, inhibitory pseudosubstrate domain. Shown is an amino acid sequence alignment centered around the pseudosubstrate domain. The aligned sequences include C. elegans KIN-2, its human ortholog (type Iβ PKA regulatory subunit), and the yeast PKA regulatory subunit. Both the ce179 and the ce38 mutations fall within the four-amino-acid boxed region known as the pseudosubstrate domain. The kin-2(ce151) mutation (E137K; not shown) falls outside of the region shown. Note that the ce179 mutation changes an absolutely conserved Arg. Accession numbers for the three proteins (from top to bottom) are P30625, P31321, and NC_001141.
RESULTS
Mutations that activate the Gαq or Gαs pathways rescue the paralysis of ric-8(md303) mutants and cause coordinated, hyperactive locomotion as single mutants:
To further clarify the network of signaling proteins that regulates neurotransmitter release, we undertook two large genetic screens. In one screen, we looked for mutations that could suppress the nearly paralyzed phenotype caused by the ric-8(md303) missense mutation. Our choice of this mutant for a suppressor screen was based on RIC-8's upstream role in synaptic Gα signaling and our guess that suppressors of the ric-8 mutant could reveal new components of the Gαo-Gαq signaling network or components of intersecting pathways. In a second screen, we looked for mutants that exhibit the hyperactive phenotypes caused by excessive EGL-30 (Gαq) pathway activity. To increase our chances of identifying rare, dominant mutations or rare reduction-of-function mutations in genes with lethal null phenotypes, we did the combined screens at ∼27-fold redundancy with respect to gene knockout coverage rates.
The screens yielded a number of interesting mutants, including a group of 10 mutants that appeared to strongly suppress the paralysis of ric-8(md303). By adapting existing C. elegans technology (Wicks et al. 2001), we developed a method to rapidly map the new mutations, at high resolution, relative to SNPs. By this method we mapped the 10 mutations to four different intervals, each <250 kb (Figure 2, A–D). Then, using candidate gene sequencing, we identified the four genes that contain these mutations. Perhaps not surprisingly, we found that two of the mutations are dominant alleles of egl-30 (Gαq), but all of the remaining mutations fell within the canonical Gαs pathway (Figure 3): three are dominant alleles of gsa-1 (Gαs), two are dominant alleles of adenylyl cyclase (acy-1), and three are recessive alleles of kin-2 (regulatory subunit of protein kinase A).
Figure 2.—

Summary of SNP fine-mapping data for four new synaptic signaling network mutations. (A–D) Regions of 320 kb (B and D) or 640 kb (A and C) near each mutation. The chromosome on which each mutation resides is indicated on the right as LG I, III, or X. The top strand represents the mutant chromosome, and the bottom strand represents the CB4856 chromosome containing the indicated SNP markers. This is the expected arrangement of the two chromosomes during the crossing-over stage of meiosis when recombination could occur. Sinusoidal lines represent recombination events that could place the mutation on the same chromosome as an SNP marker. Fractions represent the number of actual recombination events, inferred from SNP mapping data, over the total number of homozygous mutant lines tested. The vertical dashed line in A–D represents the predicted location of each mutation, which we extrapolated from the fraction of recombination events that occurred on each side of the mutation. The arrow in A–D points to the actual location of the mutation based on sequencing studies described herein. The numbers in parentheses under each SNP marker indicate the distance of each marker, in units of millions of base pairs, from the left end of the chromosome (taken from WormBase Release WS91). We also mapped the other six ric-8 suppressor mutations that were analyzed in this study as follows: ce81 and ce218 both map to the same region as ce94, between ceP27 and ceP28 (A); ce41 maps to the same interval as ce263, between ceP75 and ceP76 (B); ce2 maps to the same region as md1756, between ceP35 and ceP39 (C); and ce38 and ce151 fail to complement ce179 (D) and show tight linkage to ce179 (no wild-type progeny observed among progeny of ce179/ce38). See Table 1 for details of the SNP markers shown in this figure.
Figure 3.—

Pathway model of the C. elegans Gαs pathway. Shown are the C. elegans orthologs of the canonical Gαs pathway that are relevant to this study, arranged as originally defined by vertebrate biochemical studies, which is consistent with this study and previous C. elegans genetic studies (Berger et al. 1998; Korswagen et al. 1998). According to the model, GSA-1 (Gαs)'s action is mediated, in whole or part, by its major effector molecule ACY-1. ACY-1 produces the small signaling molecule cAMP. The binding of cAMP to KIN-2 (a PKA regulatory subunit) leads to its dissociation from the inactive holoenzyme and the release of active KIN-1 (a PKA catalytic subunit). Other potential effectors of cAMP are not shown. cAMP action is terminated by one or more cAMP phosphodiesterases (not identified). Activating green proteins or reducing the function of red proteins suppresses ric-8(md303). For each component, the number of alleles that this study identified is indicated, along with allele type (dominant or recessive).
Although the extent of suppression varied significantly between the different mutants, the strongest gsa-1 mutations, remarkably, transformed the nearly paralyzed ric-8(md303) mutants into strains that were significantly more active than the wild-type strain, resulting in an ∼40-fold improvement in locomotion rate, and when we transferred the suppressor mutations out of the ric-8 mutant background into a wild-type background, we found that all of the mutations conferred continuous, strongly hyperactive and highly coordinated locomotion as single mutants (Figure 4, A and B, and Figure 4 supplemental QuickTime movies at http://www.genetics.org/supplemental/). ce94 appears to be the strongest gsa-1 gain-of-function mutation that we isolated on the basis of the fact that ce94/+ heterozygotes are significantly more hyperactive than ce81/+ heterozygotes.
Figure 4.—
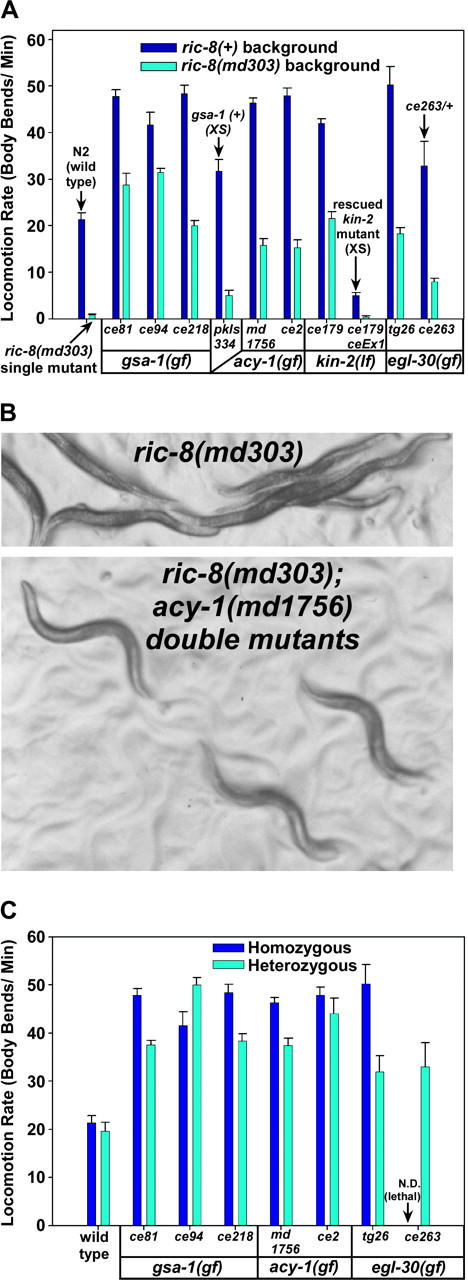
Mutations that activate the Gαs or Gαq pathways strongly suppress the paralysis of ric-8(md303) mutants and cause hyperactive locomotion in a ric-8(+) background. (A) Shown are the mean locomotion rates, expressed as body bends per minute, of strains carrying various mutations that activate the Gαs or Gαq pathways. egl-30(tg26) was isolated in a previous study (Doi and Iwasaki 2002). Dark-blue bars represent the mutants in a ric-8(+) (wild type for ric-8) background, while cyan bars represent double mutants carrying the indicated mutations in a ric-8(md303) (strong reduction-of-function) background. For comparison, wild-type animals (N2) and ric-8(md303) single mutants are shown in the first set of two bars, as indicated. Allele names are indicated and are grouped according to the affected genes. Allele types [gain of function (gf) or loss of function (lf)] are indicated for each gene. The two strongest gsa-1 gf mutations improve the locomotion rate of ric-8(md303) mutants ∼40-fold and confer significantly hyperactive locomotion even in a ric-8(md303) background (in comparisons of N2 wild type vs. gsa-1(ce94); ric-8(md303) or gsa-1(ce81); ric-8(md303) double mutants, the P-values are <0.0001 and 0.0222, respectively, using the unpaired t-test with Welch correction). Strains carrying transgenic arrays that overexpress gsa-1(+) or kin-2(+) are indicated with arrows and the annotation “XS.” Note that overexpression of the kin-2(+) gene in either the ric-8(+) or the ric-8(md303) background rescues the kin-2 loss-of-function locomotion phenotype and confers sluggish locomotion. As indicated, the egl-30 gain-of-function mutation ce263 has been assayed only as a heterozygote in the ric-8(+) background, because heterozygotes are larval lethals. Not included are data for two weaker alleles of kin-2 (ce38 and ce151) and one weaker gain-of-function allele of egl-30(ce41). Error bars represent the standard error of the mean for 8–10 animals. See also supplemental QuickTime movies for Figure 4 at http://www.genetics.org/supplemental/. (B) Images comparing the posture and movement of ric-8(md303) single mutants and ric-8(md303); acy-1(md1756) double mutants. While ric-8(md303) mutants exhibit a relatively flat waveform and a straight, paralyzed posture, the double mutants exhibit postures not readily distinguishable from wild type (not shown). (C) Mutants carrying gain-of-function mutations in the Gαs or Gαq pathways exhibit strong dominance. Shown are the mean locomotion rates, expressed as body bends per minute, of strains carrying various mutations that activate the Gαs or Gαq pathways. Dark blue and cyan bars represent animals homozygous or heterozygous, respectively, for the indicated mutations. All heterozygotes are also heterozygous for dpy-5(e61), which was used as a recessive marker mutation to identify heterozygotes. For comparison, wild type (N2) and dpy-5(e61)/+ are shown in the first set of two bars. Allele names are indicated and are grouped according to the affected genes. Note that all of these mutations confer significantly hyperactive locomotion even in heterozygous strains (highest P-value for any strain when compared to wild type is 0.051 for the egl-30(ce263)/+ mutant). Note that mutants carrying the gsa-1(ce94) mutation are significantly more hyperactive as heterozygotes than as homozygotes (P = 0.021). The notation “ce263/+” indicates that the egl-30(ce263) gain-of-function mutation has not been assayed in a homozygous state outside of the ric-8(md303) background in which we isolated it (because strains heterozygous for this mutation in a ric-8(+) background do not reach adulthood). Error bars represent the standard error of the mean for 10 animals. Statistical comparisons use the unpaired t-test with Welch correction.
The egl-30, gsa-1, and acy-1 mutations all exhibited strong dominance (Figure 4C). Indeed, strains heterozygous for the acy-1(ce2) and gsa-1(ce94) mutations were as hyperactive, or more hyperactive, respectively, than the corresponding homozygous strains. The hyperactive locomotion conferred by the dominant egl-30, gsa-1, and acy-1 mutations described here is the opposite of the sluggish/paralyzed phenotype conferred by reduction or loss-of-function mutations in these genes (Table 2). This suggests that these mutations promote a gain-of-function activation of each protein and therefore that the suppression of ric-8(md303) is caused by these mutations promoting activation of the Gαq or Gαs pathways. Further genetic analysis supports this inference. The gain-of-function nature of the egl-30 (Gαq) and gsa-1 (Gαs) mutations is suggested by our finding that they promote hyperactive locomotion when present at a single copy per genome in a manner similar to, or greater than, strains that overexpress wild-type transgenic versions of these genes (Figure 4, A and C; Korswagen et al. 1997; Bastiani et al. 2003). Supporting the gain-of-function nature of the acy-1 mutations, we found that introducing the ce2 mutation into wild-type worms on a transgene caused hyperactive locomotion (shown later in Figure 10A), whereas a wild-type version of acy-1 did not obviously affect locomotion rate, even at significantly higher transgene doseages (data not shown). Although this result alone does not rule out the possibility that the acy-1 alleles might have an altered (neomorphic) function, their strong similarity to the other Gαs pathway activating mutations, and the fact that they confer the opposite phenotype from loss-of-function mutants (Table 2), argues that they are also true gain-of-function alleles. In contrast, the recessive kin-2 mutations are reduction-of-function alleles, because a transgene containing a wild-type copy of the kin-2 gene rescues the kin-2 mutant phenotypes, including the ability of the kin-2 mutations to suppress ric-8(md303) (Figure 4A).
TABLE 2.
Locomotion rates conferred by selected gain-of-function and null mutations in theC. elegans Gαq and Gαs signaling pathways
| Protein | Mutant genotype |
Reference for mutation isolation | Effect of mutation |
Locomotion rate (body bends/min)a |
|---|---|---|---|---|
| − | N2 (wild type) | − | + | 21.3 ± 1.5 |
| EGL-30 (Gαq) | egl-30(tg26) | Doi and Iwasaki (2002) | Gain of function | 50.3 ± 4.0 |
| EGL-30 (Gαq) | egl-30(ad810) | Brundage et al. (1996) | Putative null | 0.024 ± 0.003b |
| GSA-1 (Gαs) | gsa-1(ce81) | This study | Gain of function | 47.9 ± 1.3 |
| GSA-1 (Gαs) | gsa-1(pk75) | Korswagen et al. (1997) | Null | NDc |
| ACY-1 | acy-1(ce2) | This study | Gain of function | 48.0 ± 1.6 |
| ACY-1 | acy-1(pk1279) | Moorman and Plasterk (2002) | Null | 0.75 ± 0.10b |
Note the opposite effects on locomotion rate conferred by gain-of-function and null mutations in each of these genes.
Mean ± standard error. N ≥ 10 animals.
The paralysis of these mutants is not caused by general sickness, muscle, or developmental defects, because they can be acutely rescued to wild-type levels of locomotion by manipulating Gα pathway signaling (Reynolds et al. 2005, accompanying article in this issue).
These mutants exhibit early larval paralysis and death caused by an apparent problem in fluid balance (Korswagen et al. 1997).
Figure 10.—
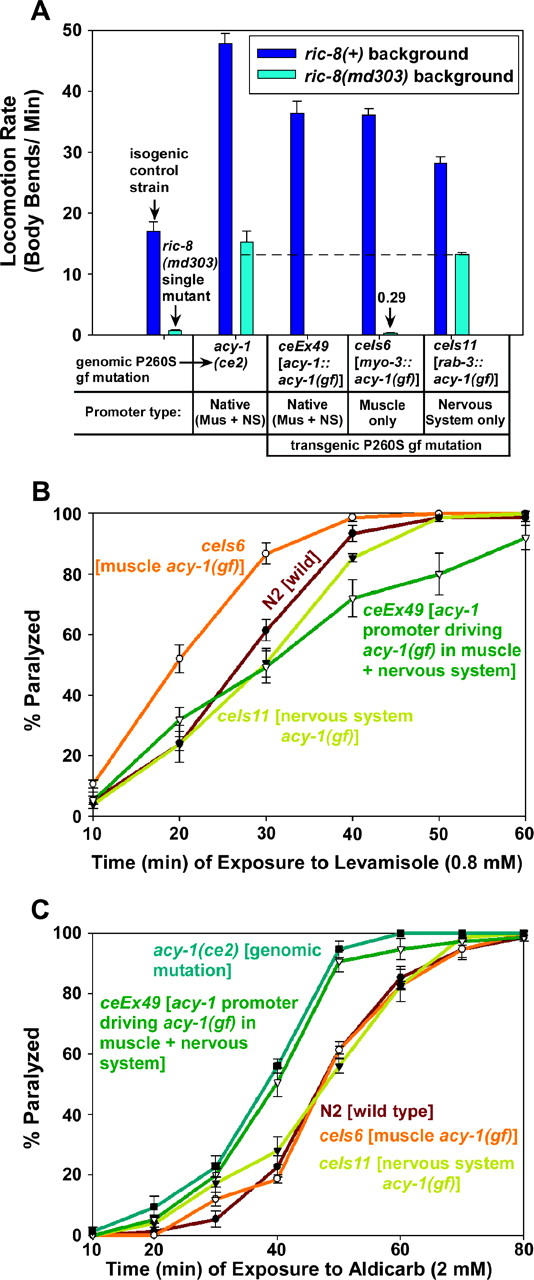
Suppression of ric-8(md303) occurs via the neuronal Gαs pathway, but both the muscle and the nervous system Gαs pathway contribute to the locomotion rate and drug sensitivity phenotypes. (A) Hyperactivation of the Gαs pathway in either muscle or nervous system is sufficient to confer hyperactive locomotion; hyperactivation of the Gαs pathway in the nervous system, but not muscle, significantly suppresses the paralysis of ric-8(md303). Shown are the mean locomotion rates of various strains, expressed as body bends per minute. Dark-blue bars represent a ric-8(+) (wild type for ric-8) background, while light-blue bars represent a ric-8(md303) strong reduction-of-function background. For comparison, the isogenic control strain and the ric-8(md303) single mutant are shown in the first set of two bars, as indicated. All remaining bars represent strains carrying the acy-1 (P260S) gain-of-function mutation either in the form of the ce2 genomic mutation or on trangenes driven by various promoters, as indicated. All transgenic strains in this figure, including the isogenic control strain, are in the pha-1(e2123) background rescued with the pha-1(+) gene, which was used as a selectable marker for transformants. Error bars represent the standard error of the mean for 8–10 animals. (B) Both the muscle and the nervous system Gαs pathways contribute to the levamisole resistance phenotype. The graph compares the percentage of animals that are paralyzed, over a time course, on plates containing 800 μm levamisole. Note that a transgene that expresses the same mutation (P260S) under control of the native acy-1 promoter appears to cause slight resistance to the paralytic effects of levamisole (P = 0.12 and 0.09 for the 40- and 50-min time points, respectively). However, the same mutation expressed only in body-wall muscle confers significant hypersensitivity to levamisole (P = 0.032 and 0.0071 for the 20- and 30-min time points, respectively), and when expressed only in the nervous system, it either does not significantly alter levamisole sensitivity or causes slight resistance (P = 0.17 and 0.11 for the 30- and 40-min time points, respectively). Error bars represent standard error of the means for three experiments. (C) Expressing the acy-1 (P260S) gain-of-function mutation only in muscle or only in nervous system does not significantly alter overall levels of neurotransmitter release. The graph compares the percentage of animals that are paralyzed, over a time course, on plates containing 2 mm aldicarb. Note that both the genomic acy-1(ce2) mutation and a transgene that expresses the same mutation (P260S) under control of the native acy-1 promoter cause significant hypersensitivity to aldicarb (P = 0.0055 and 0.022 for each strain, respectively, at the 50-min time point). However, when the same mutation is expressed only in body-wall muscle or only in the nervous system, aldicarb sensitivity is not significantly altered. Similar results were obtained using the population growth method of measuring aldicarb sensitivity (data not shown). Error bars represent standard error of the means for three experiments.
Gαs is completely dependent on adenylyl cyclase to regulate growth and locomotion:
As shown in Figure 4, the strong gsa-1 (Gαs) gain-of-function mutations suppress the paralysis of ric-8(md303) mutants significantly better than the gain-of-function mutations in acy-1. This could indicate that Gαs has other effectors in addition to adenylyl cyclase, or it could simply indicate that the mutations activate the pathway to different degrees. To address whether or not other Gαs effectors contribute significantly to the regulation of locomotion, we constructed a double mutant containing a strong gsa-1 (Gαs) activating mutation in combination with an acy-1 null mutation. A previous study produced the acy-1(pk1279) mutation and showed that it deletes the acy-1 gene and causes larval lethality and paralysis that can be rescued with the wild-type acy-1 gene (Moorman and Plasterk 2002). Interestingly, the acy-1(pk1279) null mutation actually increases life span; the larval arrest results from failure to progress to the adult stage (Moorman and Plasterk 2002). The paralysis conferred by the acy-1(pk1279) mutation results from functional, rather than permanent developmental, defects (Reynolds et al. 2005).
When we moved the acy-1(pk1279) mutation into the gsa-1(ce81) background, we found that the double mutant was essentially indistinguishable from the acy-1(pk1279) single mutant with respect to overall appearance, and, as Figure 5 shows, the locomotion rate of acy-1(pk1279) was not improved by the gsa-1(ce81) mutation. This suggests that there are no other major effectors in addition to ACY-1 through which GSA-1 can signal to regulate locomotion rate. Similarly, we found that the gsa-1 strong gain-of-function mutation could not bypass the larval arrest phenotype of acy-1 nulls, although the gsa-1(ce81); acy-1(pk1279) double mutants, like acy-1(pk1279) single mutants, can survive for days after hatching (Reynolds et al. 2005). Although our genetic analysis does not address whether or not GSA-1 directly activates ACY-1, as biochemical studies have shown with vertebrate homologs (e.g., Tesmer et al. 1997), these results are consistent with ACY-1 being the major effector by which GSA-1 (Gαs) regulates growth and locomotion rate.
Figure 5.—

Gαs is completely dependent on adenylyl cyclase to regulate locomotion rate. Shown are the mean locomotion rates, expressed as body bends per minute, of the wild-type strain and strains carrying the gsa-1(ce81) and/or acy-1(pk1279) mutations. Error bars represent the standard error from populations of 8–10 larvae (each 6–30 hr old).
Molecular analysis of ric-8(md303) suppressor mutations reveals both known and novel gain-of-function mutations in the Gαq and Gαs pathways:
To investigate the mechanisms by which the ric-8 suppressor mutations activate the Gαq and Gαs pathways, we undertook a molecular analysis of each mutation in the context of available structural data. Our three dominant mutations in GSA-1 (Gαs) are all missense alleles that are predicted to interfere with GTP hydrolysis and thus should cause the protein to become stuck in the GTP-bound “ON” position (Figure 6A; Table 3). gsa-1(ce94) (G45R) changes a Gly in the phosphate-binding P-loop that binds the βγ phosphates of GTP (Vetter and Wittinghofer 2001). Interestingly, this Gly is completely conserved in all G proteins, including small G proteins such as ras, where it corresponds to Gly12, a common site for ras gain-of-function mutations in human tumors (Bos 1989). The other two mutations affect two of the three residues that are proposed to form the catalytic triad for GTP hydrolysis (Sondek et al. 1994). gsa-1(ce81) (R182C) mutates the catalytic Arg. This Arg is the target of ADP ribosylation by cholera toxin (Van Dop et al. 1984). Indeed, R182C is known to inhibit GTP hydrolysis, both in vitro and in human disease, where it is found in individuals with McCune-Albright syndrome, and in certain kinds of growth-hormone-secreting human pituitary tumors (Landis et al. 1989; Lyons et al. 1990; Shenker et al. 1993). The gsa-1(ce218) mutation (T185A) also affects the catalytic triad; however, this mutation suppresses ric-8(md303) more weakly than do the ce81 and ce94 mutations (Figure 4A).
TABLE 3.
Summary ofric-8(md303) suppressor mutations that activate the Gαs or Gαq pathways
| Allele name | Allele type | Affected protein | Amino acid change | Region disrupted |
|---|---|---|---|---|
| egl-30(ce41) | Gain of function | EGL-30 (Gαq) | G58D | 11th amino acid downstream from P-loop |
| egl-30(ce263) | Gain of function | EGL-30 (Gαq) | E208K | Switch region II; third amino acid downstream from the catalytic glutamine |
| gsa-1(ce94) | Gain of function | GSA-1 (Gαs) | G45R | P-loop mutation. Glycine is conserved in ras, where it is known as Gly12, and is a common site for ras gain-of-function mutations in human cancers |
| gsa-1(ce81) | Gain of function | GSA-1 (Gαs) | R182C | Switch region I; this is the catalytic Arg and also the site of cholera toxin ADP ribosylation, and this same mutation is found in human pituitary tumors |
| gsa-1(ce218) | Gain of function | GSA-1 (Gαs) | T185A | Switch region I; this is the catalytic Thr. |
| acy-1(ce2) | Gain of function | ACY-1 | P260S | Near the beginning of the C1 catalytic domain |
| acy-1(md1756) | Gain of function | ACY-1 | A337T | C1 catalytic domain. A known point of contact between the C1 and C2 catalytic domains |
| kin-2(ce179) | Reduction of function | KIN-2 (PKA regulatory subunit) |
R92C | Pseudosubstrate domain; this Arg is known to be critical for inhibition of protein kinase A |
| kin-2(ce38) | Reduction of function | KIN-2 (PKA regulatory subunit) |
G95R | Pseudosubstrate domain that normally functions to keep protein kinase A turned off in absence of cAMP |
| kin-2(ce151) | Reduction of function | KIN-2 (PKA regulatory subunit) |
E137K | Region between pseudosubstrate domain and cAMP binding sites |
Strongest pathway activators are underlined. See also Figure 6.
One of our dominant mutations in EGL-30 (Gαq) also changes residues in a region known to be important for GTP hydrolysis (Figure 6A; Table 3). The egl-30(ce263) (E208K) mutation is located just three amino acids downstream of the catalytic glutamine. This residue is conserved among all Gα proteins, but not in ras.
Our two dominant mutations in ACY-1 both change conserved residues in the C1 catalytic domain (Figure 6B; Table 3). Adenylyl cyclase is composed of two soluble catalytic domains (C1 and C2) connected to 12 transmembrane helices (Taussig and Gilman 1995). Previous studies have shown that the activation of adenylyl cyclase requires the coming together of the C1 and C2 domains, and previous dominant mutations have been found to increase the affinity of the two domains for each other (Hatley et al. 2000). We note that the acy-1(md1756) mutation occurs at a known contact point between the two domains, as revealed by structural studies of vertebrate adenylyl cyclases (Tesmer et al. 1997; Zhang et al. 1997). Our two strongest recessive mutations in KIN-2 (a regulatory subunit of protein kinase A) both change conserved residues in the four-amino-acid inhibitory pseudosubstrate domain that normally functions to keep protein kinase A turned off in the absence of cAMP (Figure 6C; Table 3). Biochemical studies in vertebrates have shown that the Arg mutated in kin-2(ce179) (R92C) and conserved from yeast to humans is critical for the regulatory subunit to exert its inhibitory effects and that mutating it results in a holoenzyme that is extremely hypersensitive to cAMP (Buechler et al. 1993); however, none of our kin-2 mutations are likely to be null mutations, because we found that kin-2 RNAi confers a larval arrest loss-of-function phenotype.
In summary, our findings of strong dominance, our comparisons to loss-of-function phenotypes, our molecular analyses, and our transgenic experiments demonstrate that the mutations in EGL-30, GSA-1, and ACY-1 all promote a gain-of-function activation of each protein, while the recessive KIN-2 mutations, rescueable with wild-type transgenes, are reduction of function, although, as demonstrated by the vertebrate biochemical studies, they should indirectly cause hyperactivation of protein kinase A. Therefore, the ric-8(md303) suppressor mutations described herein are mutations that enhance or activate signaling in the Gαq or Gαs pathways.
Native Gαs pathway activating mutations cause minimal neuronal cell death:
We were not surprised to find that activating the Gαq pathway could suppress ric-8 mutants, because in a previous study we showed that knocking out negative regulators of the EGL-30 (Gαq) pathway or exogenous application of phorbol esters could suppress ric-8 mutants (Miller et al. 2000). However, we were surprised to find that activating the Gαs pathway could suppress ric-8 mutants, because previous transgenic studies in C. elegans demonstrated that Gαs gain-of-function mutations can kill neurons and cause permanent paralysis (Korswagen et al. 1997; Berger et al. 1998). Do the native gsa-1 gain-of-function mutations kill neurons? When we used Nomarski microscopy to look for signs of neuronal cell death in these mutants, we found that they did have significantly more neuronal vacuoles (an indicator of dead or dying neurons) than wild type; but, on average, only ∼1 of the ∼300 nerve cells in each animal was affected (Figure 7). This is much lower than the transgenic Gαs gain-of-function strains, in which about half of the neurons were killed (Korswagen et al. 1997; Berger et al. 1998). Furthermore, we found that the number of neuronal vacuoles did not significantly increase as the gsa-1 mutants developed (Figure 7). So, unlike the transgenic strains, the native dominant mutations do not cause widespread neuronal death, as seems self-evident from the hyperactive locomotion phenotype.
Figure 7.—

Native gain-of-function mutations do not cause widespread neuronal death. Shown is the average number of neuronal vacuoles per animal in wild type and in our two strongest gsa-1 gain-of-function mutants. The results show that these mutants have significantly more neuronal vacuoles than wild type (the P-values are 0.0002 and <0.0001 for comparing N2 to gsa-1(ce81) and gsa-1(ce94), respectively, using the unpaired t-test with Welch correction); however, the level of neuronal death amounts to, on average, only ∼1 of ∼300 nerve cells in each animal. Also note that the number of neuronal vacuoles did not significantly increase as the mutants developed into young adults. Error bars represent the standard error of the means for a sample size of 10 animals.
Activating the Gαs pathway suppresses ric-8(md303) by inducing rapid functional changes:
What is the function of the Gαs pathway at the synapse, and why do mutations that activate it cause hyperactive locomotion and strongly suppress ric-8(md303)? To begin to address this question, we first asked if the suppression of ric-8(md303) is the result of permanent developmental changes that occur as the ric-8 mutants develop in the presence of an activated Gαs pathway or, alternatively, if the suppression is caused by “real-time” functional changes that can be induced at any stage by activating the Gαs pathway. To test this, we crossed a transgene containing a gsa-1 gain-of-function mutation under control of a heat-shock-inducible promoter (Korswagen et al. 1997) into the ric-8(md303) mutant background. In the absence of heat shock, these animals were only slightly more active than ric-8(md303) single mutants, apparently as a result of slight leakiness of the heat-shock promoter (Figure 8). In contrast, only 3 hr after a 40-min heat-shock treatment, ric-8(md303) adult animals containing the gsa-1 gain-of-function transgene were, astonishingly, moving at locomotion rates slightly greater than that of the wild-type strain (Figure 8 and Figure 8 supplemental movies at http://www.genetics.org/supplemental/). The locomotion rates of wild-type and ric-8(md303) single-mutant controls were unchanged 3 hr after the heat shock. We observed similar results upon heat-shock induction of the gsa-1 gain-of-function transgene in larval ric-8(md303) animals (data not shown). In a wild-type background, heat-shock induction of the gsa-1 gain-of-function transgene in adults caused hyperactive locomotion (Figure 8). We conclude that both the hyperactive locomotion and the strong suppression of ric-8(md303) that occurs upon activating the Gαs pathway is largely, if not entirely, the result of relatively rapid changes.
Figure 8.—

Activating the Gαs pathway suppresses ric-8(md303) and causes hyperactive locomotion by inducing rapid functional changes. A transgenic array carrying the gsa-1 Q208L gain-of-function mutation under control of a heat-shock-inducible promoter [HS::gsa-1(Q208L)] suppresses ric-8(md303) only 3 hr after a 40-min heat-shock treatment. Dark blue and cyan bars indicate locomotion rates without or with heat-shock treatment, respectively. Note that the heat-shock induction of gsa-1 (Q208L) improves the locomotion rate of ric-8(md303) ∼13-fold relative to non-heat-shock conditions, whereas heat-shock treatment of control strains does not improve locomotion rate. Heat-shock induction of gsa-1 (Q208L) in a ric-8(+) background causes significantly hyperactive locomotion. The slightly improved locomotion rate associated with the array under non-heat-shock conditions (relative to control strains) may indicate that the promoter is not completely off under non-heat-shock conditions. Error bars represent the standard error of the mean for eight animals. See also supplemental QuickTime movies for Figure 8 at http://www.genetics.org/supplemental/.
The hyperactivated Gαs pathway does not strongly suppress the paralysis of presynaptic mutants with defects in synaptic vesicle docking or priming:
To further investigate why activating the Gαs pathway strongly rescues the paralysis of ric-8(md303) mutants, we tested the specificity of the suppression by asking if the Gαs pathway activating mutations could rescue the near paralysis of mutants with defects in synaptic vesicle docking or priming. The locomotion rate of ric-8(md303) is improved up to 40-fold by activating the Gαs pathway, but the locomotion rate of the synaptic vesicle priming mutant unc-13(s69), a strong reduction-of-function mutant (Richmond et al. 1999; Kohn et al. 2000), is improved only ∼4-fold by activating the Gαs pathway (Figure 9A). This slight suppression amounted to a nearly complete block of the Gαs pathway with respect to locomotion rate, because the locomotion rate of the gsa-1(ce81); unc-13(s69) double mutant was only ∼2% of the gsa-1(ce81) single mutant. In addition, activating the Gαs pathway restored, to all appearances, perfectly coordinated locomotion in ric-8(md303) mutants, whereas the movement of gsa-1(ce81); unc-13(s69) double mutants was uncoordinated (Figure 9 supplemental movies at http://www.genetics.org/supplemental/). Similar results were obtained with unc-18 null mutants (Figure 9 and Figure 9 supplemental movies at http://www.genetics.org/supplemental/), in which synaptic vesicle docking is disrupted (Weimer et al. 2003). In addition to highlighting the specificity of the suppression of ric-8(md303), these results demonstrate that the Gαs pathway is largely dependent on the synaptic vesicle priming mechanism to exert its effects on locomotion.
Figure 9.—
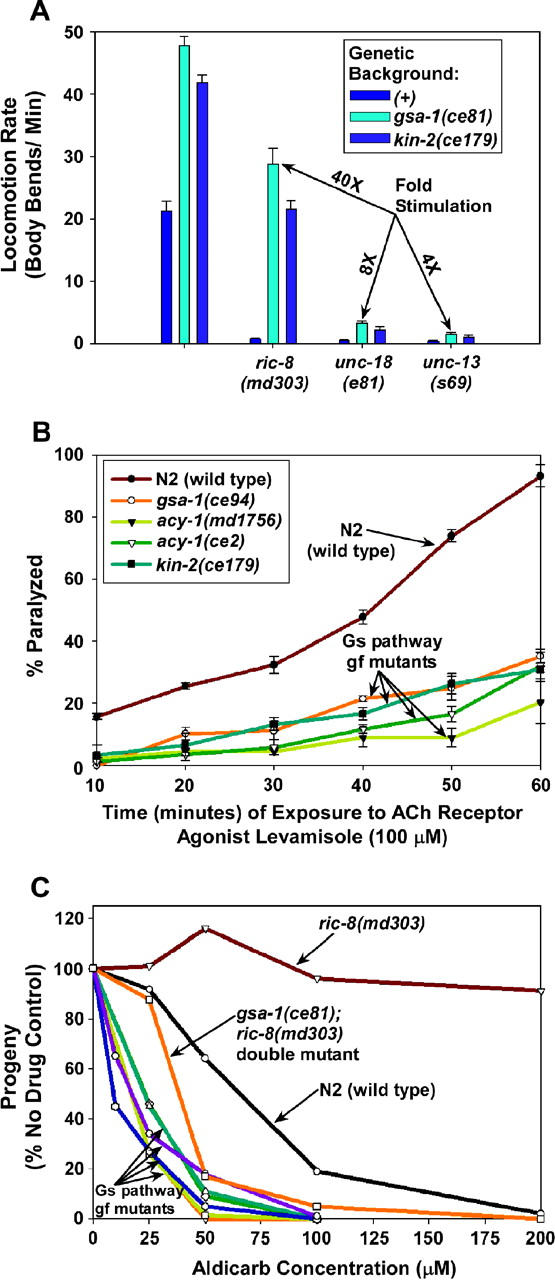
The hyperactivated Gαs pathway increases neurotransmitter release and requires the synaptic vesicle priming protein UNC-13 to exert its effects on locomotion. (A) Activating the Gαs pathway does not strongly suppress the near-paralysis of mutants with reduced synaptic vesicle docking and priming. Shown are the mean locomotion rates, expressed as body bends per minute, of various strains. Strains homozygous for ric-8(md303), unc-18(e81), or unc-13(s69) are grouped together as indicated. Dark-blue bars within each set represent strains carrying no additional mutations (genetic background (+)). Cyan bars represent double mutants in which the second mutation is gsa-1(ce81), and royal blue bars represent double mutants in which the second mutation is kin-2(ce179). The first group of bars (unlabeled) represents wild-type and single-mutant control strains. “Fold stimulation” calculations are shown only for double mutants carrying the gsa-1(ce81) mutation. Error bars represent the standard error of the mean for 8–10 animals. See also supplemental QuickTime movies for Figure 9 at http://www.genetics.org/supplemental/. (B) Mutants with an activated Gαs pathway show reduced sensitivity to the ACh receptor agonist levamisole. The graph compares the percentage of animals that are paralyzed, over a time course, in a solution of 100 μm levamisole. Note that all of the mutants with an activated Gαs pathway are significantly resistant to the paralytic effects of levamisole (all P-values are <0.014 for any strain compared to wild type at any time point). This indicates that their hyperactive behavior is not the result of increased sensitivity of the muscle to ACh. Similar results were obtained using 1200 μm nicotine (solution assay) and 800 μm levamisole (solid media assay; data not shown). Error bars represent standard error of the means for three experiments. (C) Hyperactivation of the Gαs pathway causes hypersensitivity to aldicarb. The graph compares the population growth rates of strains with various concentrations of aldicarb. One hundred percent represents the number of progeny produced from a starting population of L1 larvae over a 96-hr period in the absence of aldicarb (carrier only). Note that ric-8(md303) is strongly resistant to aldicarb (indicating decreased neurotransmitter release); however, activating the Gαs pathway in the ric-8 mutant background seems to restore neurotransmitter release to at least wild-type levels, if not greater, since the gsa-1(ce81); ric-8(md303) double mutant is hypersensitive to aldicarb. Note that all of the mutants with an activated Gαs pathway (designated “Gs pathway gf mutants”) are hypersensitive to aldicarb as single mutants. Mutants included in the cluster designated “Gs pathway gf mutants” are as follows (from left to right at the 40% level): kin-2(ce179), gsa-1(ce94), gsa-1(ce81) (superimposed on ce94), kin-2(ce38), acy-1(ce2), and acy-1(md1756) (superimposed on ce2). Curves are representative of duplicate experiments.
Hyperactivating the Gαs pathway increases steady-state neurotransmitter release:
Is the hyperactive locomotion and strong suppression of ric-8(md303) that occurs upon activating the Gαs pathway associated with increased neurotransmitter release, or could altered neurotransmitter receptor responses also contribute? The major excitatory neurotransmitter at C. elegans neuromuscular junctions is acetylcholine (ACh). Therefore, to address this question, we first tested the responses of the Gαs pathway activation mutants to the acetylcholine receptor agonist levamisole, and we found that they are all significantly resistant to the paralytic effects of levamisole (Figure 9B). Similar results were obtained with the ACh receptor agonist nicotine (data not shown). Although this seems to support the idea that the hyperactive locomotion of these mutants is not the result of increased sensitivity of the muscle to ACh, it could also mean that these mutants are simply able to tolerate higher amounts of receptor stimulation without becoming paralyzed.
To test for increased steady-state neurotransmitter release in the Gαs pathway activation mutants, we assessed their sensitivities to the acetylcholinesterase inhibitor aldicarb. Since the secreted ACh that accumulates in the presence of aldicarb is toxic, mutations that decrease or increase the rate of ACh secretion confer resistance or hypersensitivity to aldicarb, respectively (Rand and Nonet 1997). When we measured the aldicarb sensitivities of the mutants with an activated Gαs pathway, we found that they all are hypersensitive to aldicarb at all concentrations tested (Figure 9C). This result suggests that these strains release abnormally high levels of the neurotransmitter acetylcholine. Is increased neurotransmitter release related to the suppression of ric-8(md303)? This seems to be the case, because ric-8(md303) releases abnormally low levels of acetylcholine, as indicated by its strong resistance to aldicarb, and yet activating the Gαs pathway in ric-8(md303) seems to restore steady-state neurotransmitter release to levels in excess of wild type (Figure 9C).
Suppression of ric-8(md303) occurs via the neuronal Gαs pathway, but both the muscle and nervous system Gαs pathways contribute to the locomotion rate and drug sensitivity phenotypes:
The C. elegans GSA-1 (Gαs) pathway is expressed in both nervous system and body-wall muscle cells. To investigate the relative contributions of these two tissues to the suppression, locomotion, and drug sensitivity phenotypes associated with an activated Gαs pathway, we reproduced the ce2 (P260S) mutation on a full-length acy-1 cDNA and then made transgenic animals carrying this gain-of-function mutation under control of muscle and/or nervous system specific promoters. Expressing the acy-1 (P260S) cDNA under control of the rab-3 nervous system specific promoter caused hyperactive locomotion in a wild-type background as well as strong suppression of the paralysis of ric-8(md303) (Figure 10A). Surprisingly, however, expressing the acy-1 (P260S) cDNA under control of the myo-3 muscle-specific promoter also conferred hyperactive locomotion in a wild-type background (Figure 10A). This is not caused by “leaking” of the muscle promoter in nervous system tissue, because control experiments, done as part of a separate study, showed that the myo-3 promoter, even at high levels, cannot drive rescue of a nervous-system-specific mutant (Reynolds et al. 2005). However, unlike the nervous-system-specific acy-1 (P260S) transgene, the muscle-specific acy-1 (P260S) transgene was unable to cause any rescue of the paralysis of ric-8(md303) (Figure 10A). These results show that the suppression of ric-8(md303) is dependent on activation of the neuronal Gαs pathway.
The hyperactive locomotion conferred by muscle-specific expression of the acy-1 (P260S) transgene seems to be caused, at least in part, by increased muscle excitability, because the strain containing the muscle-specific acy-1 (P260S) transgene was significantly hypersensitive to the paralytic effects of levamisole (Figure 10B). In contrast, the strain containing the neuron-specific acy-1 (P260S) transgene showed normal sensitivity, or slight resistance, to levamisole, and a strain expressing the acy-1 (P260S) gene under control of its native promoter (muscle + nervous system) conferred significant resistance to levamisole (Figure 10B). Since expression in either muscle or nervous system alone is not sufficient to reconstitute the levamisole resistance seen with the native mutations that activate the Gαs pathway, these results suggest that it is the combined actions of hyperactivating the muscle and nervous system Gαs pathways, possibly in communication or coordination with each other, that leads to levamisole resistance.
Similarly, expressing the acy-1 (P260S) mutation only in muscle or only in the nervous system does not appear to significantly alter overall steady-state levels of neurotransmitter release, as measured by aldicarb sensitivity (Figure 10C). Both the genomic acy-1(ce2) mutation and a transgene that expresses the same mutation (P260S) under control of the native acy-1 promoter cause significant hypersensitivity to aldicarb, this time measured using a paralysis assay, but in agreement with previous results using the population growth assay (Figures 9C and 10C). However, when the same mutation is expressed only in muscle cells or only in the nervous system, aldicarb sensitivity is not significantly altered (Figure 10C), despite the fact that these same transgenes cause hyperactive locomotion (Figure 10A). These results suggest that it is the combined actions of hyperactivating the muscle and nervous system Gαs pathways, possibly in communication or coordination with each other, that leads to aldicarb hypersensitivity and increased steady-state neurotransmitter release.
DISCUSSION
In this study, we undertook two large genetic screens aimed at identifying components of the signaling network that regulates neurotransmitter release, and we focused our initial efforts on 10 mutations that strongly suppress the paralysis of ric-8(md303) mutants. Through high-resolution SNP-based mapping and candidate gene sequencing, we showed that the mutations affect four proteins—EGL-30 (Gαq), GSA-1 (Gαs), ACY-1, and KIN-2 (PKA regulatory subunit)—and that the effect of these mutations is to activate the Gαq or Gαs pathways. Our screens produced the first native, germline Gαs and adenylyl cyclase gain-of-function mutations isolated in an animal system and the first whole-animal nontargeted PKA regulatory subunit mutations.
The results presented in this study do not reveal why activating the Gαs pathway strongly suppresses ric-8(md303). Hindering our understanding of the suppression is the fact that RIC-8 interacts with multiple Gα subunits, including all three major classes of Gα's that are involved in synaptic signaling (Miller et al. 2000; Miller and Rand 2000; Klattenhoff et al. 2003; Tall et al. 2003). In addition, epistasis studies using a ric-8 null mutant strongly suggest that RIC-8 has an essential role in activating both the Gαq and the Gαs pathways (Reynolds et al. 2005). Although we do not know to what extent the Gαs pathway is affected in the non-null ric-8(md303) missense mutant, the available evidence indicates that the function of the Gαq pathway is strongly reduced in ric-8(md303) mutants, because applying phorbol esters or knocking out negative regulators of the Gαq pathway strongly suppresses the paralysis of ric-8(md303) mutants and restores coordinated locomotion and because steady-state levels of neurotransmitter release are reduced in ric-8(md303) mutants to a similar degree as in similarly paralyzed egl-30 reduction-of-function mutants (Miller et al. 2000). In contrast, similarly paralyzed mutants lacking a neuronal Gαs pathway exhibit approximately wild-type levels of steady-state neurotransmitter release and are only partially suppressed for short periods of time by applying phorbol esters or knocking out negative regulators of the Gαq pathway (Reynolds et al. 2005). Therefore, although ric-8(md303)'s suppression by Gαs pathway activation may partially result from correcting a deficit in Gαs signaling, we think that the activated Gαs pathway must also be compensating, directly or indirectly, for a deficit in Gαq signaling in ric-8(md303) mutants. The data discussed in this paragraph therefore suggest a link between the Gαs pathway and the previously discovered Gαo-Gαq signaling network.
Activating the Gαs pathway rapidly induces continuous, coordinated, hyperactive locomotion and rapidly rescues the paralysis of ric-8(md303) mutants:
Our results show that constitutive activation of the Gαs pathway can produce continuous, coordinated and strongly hyperactive locomotion and are in agreement with a previous study, which showed that transgenic overexpression of wild-type gsa-1 confers hyperactive locomotion (Korswagen et al. 1997). However, previous C. elegans studies reported widespread neuronal death and paralysis upon transgenic expression of Gαs gain-of-function mutations (Korswagen et al. 1997; Berger et al. 1998). We think that this was most likely caused by the difficulty in controlling transgene copy number and/or expression levels, since our native mutations conferred only minimal neuronal death and since we were able to produce hyperactive locomotion by controlled heat-shock induction of the same gsa-1 gain-of-function mutation that was used in the neuronal death studies. Likewise, the sluggish locomotion conferred by a Gαs gain-of-function transgene under control of ectopic promoters in Drosophila larvae could have resulted from expression levels or expression timing factors that were not easily controlled and not optimized for coordinated hyperactive locomotion (Renden and Broadie 2003). Indeed, when we placed wild-type worms on plates containing various concentrations of membrane-permeable cAMP analogs, we were unable to induce hyperactive locomotion and, in fact, high concentrations resulted in sluggish locomotion or paralysis (K. G. Miller, unpublished results). This suggests that the timing and/or location of cAMP elevations is critical with respect to producing cAMP-induced hyperactive locomotion. This is in striking contrast to phorbol esters, which mimic Gαq-pathway-produced DAG and cause strongly hyperactive locomotion within 1–2 hr of omnidirectional contact (Miller et al. 2000).
Our experiments with a heat-shock inducible Gαs gain-of-function transgene demonstrate that the coordinated, strongly hyperactive locomotion can be induced at any stage, including adulthood, by relatively rapid functional changes on the order of 30 min–3 hr. This is an important point, since its corollary is that the hyperactive locomotion is not dependent on the nervous system developing in the presence of an activated Gαs pathway. A previous study found increased numbers of terminal varicosities and branches in Drosophila dunce (cAMP phosphodiesterase) mutants, which have increased levels of cAMP (Zhong et al. 1992). Although our studies do not rule out that the Gαs pathway can change nervous system structure, especially at the synaptic ultrastructural level, as has been previously reported (Renger et al. 2000), they do suggest that any important changes that it induces occur relatively rapidly and need not be coordinated with neuronal development. Similarly, we also showed that the strong suppression of ric-8(md303) occurs independently of development. This is important because it shows that the inferred link between the Gαs and Gαq pathways, uncovered by the genetic screens described herein, is functional rather than developmental.
The hyperactivated Gαs pathway increases neurotransmitter release:
Our results suggest that the hyperactive locomotion that occurs upon hyperactivating the Gαs pathway is associated with increased neurotransmitter release. Previous studies have clearly shown that mutations that increase the production of cAMP, as well as application of cAMP or its analogs, can facilitate both nerve-evoked and spontaneous neurotransmitter release (Brunelli et al. 1976; Zhong and Wu 1991; Yoshihara et al. 1999; Zhang et al. 1999). In addition, the often-used method of hypertonicity-induced transmitter release is partially mediated by cAMP (Suzuki et al. 2002). More recently, transgenic activation of Gαs itself in Drosophila was shown to increase basal-evoked transmitter release (Renden and Broadie 2003). The present study does not address how activating the Gαs pathway increases neurotransmitter release; however, previous studies in which cAMP levels and/or protein kinase A activity have been acutely manipulated have demonstrated that the Gαs pathway increases the probability of release (Trudeau et al. 1996; Chen and Regehr 1997). A later study found a specific role for cAMP/PKA in recruiting synaptic vesicles from the reserve pool to the readily releasable primed pool (Kuromi and Kidokoro 2000). Applying the insights from these latter studies to our current study leads us to infer that the increased neurotransmitter release and coordinated hyperactive locomotion that results from activating the Gαs pathway in whole animals is a consequence of increased synaptic vesicle priming/probability of release, at least at the specific synapses that drive locomotion.
Presynaptic and postsynaptic roles of the Gαs pathway:
Our results show that it is the neuronal, not the muscle, Gαs pathway that mediates the strong suppression of ric-8(md303)'s paralysis; however, we could not reproduce the strong levamisole resistance and aldicarb hypersensitivity phenotypes by expressing an acy-1 gain-of-function transgene solely in muscle or solely in the nervous system, although expression in both tissues using the acy-1 native promoter did reproduce both phenotypes. This suggests that it is the combined actions of hyperactivating the muscle and nervous system Gαs pathways that leads to strong tolerance to levamisole and hypersensitivity to aldicarb. Previous studies have found that postsynaptic activation of components of the Drosophila Gαs pathway increases neurotransmitter release via retrograde (muscle-to-neuron) signaling (Davis et al. 1998; Renden and Broadie 2003). Our finding that aldicarb sensitivity is unaffected by activating the Gαs pathway solely in muscle cells, or solely in neurons, may reflect compensatory mechanisms in which postsynaptic receptor sensitivity, or the composition of the receptor field, is altered in such a way as to prevent us from detecting increased release by our pharmaco-behavioral assays (Davis et al. 1998; DiAntonio et al. 1999; Renden and Broadie 2003). However, the fact that driving the acy-1 gain-of-function transgene with its native promoter in both tissues results in signficant drug sensitivity phenotypes is consistent with communication or coordination between the muscle and neuronal Gαs pathways via one or more trans-synaptic signals. Alternatively, it could be that the drug sensitivity phenotypes are dependent on proper expression levels or expression timing factors that are not easily controlled with the ectopic promoters that we used.
In summary, the large forward genetic screens and initial epistasis analysis presented here link RIC-8 (synembryn) and the Gαs pathway with the previously described Gα-Gαq signaling network. The accompanying study in this issue (Reynolds et al. 2005) directly investigates the relationship of the Gαs and Gαq pathways to each other and to synaptic vesicle priming and reveals a role for RIC-8 in maintaining activation of both pathways (Reynolds et al. 2005).
Acknowledgments
The authors are grateful to Bob Barstead and Gary Molder for technical advice that we applied to our SNP mapping method. We also thank Kouichi Iwasaki for providing his egl-30(tg26) allele ahead of publication, Ann Rose for providing unc-13(s69), and Celine Moorman and Ron Plasterk for providing acy-1(pk1279). Mike Nonet generously shared information about his ACY-1 (P260S) gain-of-function mutation, isolated independently in his lab and identical to our acy-1(ce2), and also provided a plasmid containing this mutation and helped with our transgene integration protocol. All DNA sequences were obtained from the Core DNA Sequencing Facility at the Oklahoma Medical Research Foundation. Some of the strains used here were provided by the C. elegans Genetics Center. This work was supported by a grant from the National Institute of Mental Health to K.G.M. (MH62400).
References
- Ahnert-Hilger, G., T. Schäfer, K. Spicher, C. Grund, G. Schultz et al., 1994. Detection of G-protein heterotrimers on large dense core and small synaptic vesicles of neuroendocrine and neuronal cells. Eur. J. Cell Biol. 65: 26–38. [PubMed] [Google Scholar]
- Aravamudan, B., T. Fergestad, W. S. Davis, C. K. Rodesch and K. Broadie, 1999. Drosophila Unc-13 is essential for synaptic transmission. Nat. Neurosci. 2(11): 965–971. [DOI] [PubMed] [Google Scholar]
- Aronin, N., and M. DiFiglia, 1992. The subcellular localization of the G-protein Giα in the basal ganglia reveals its potential role in both signal transduction and vesicle trafficking. J. Neurosci. 12(9): 3435–3444. [DOI] [PMC free article] [PubMed] [Google Scholar]
- Augustin, I., C. Rosenmund, T. C. Südhof and N. Brose, 1999. Munc13–1 is essential for fusion competence of glutamatergic synaptic vesicles. Nature 400: 457–461. [DOI] [PubMed] [Google Scholar]
- Bastiani, C. A., S. Gharib, M. I. Simon and P. W. Sternberg, 2003. Caenorhabditis elegans Gαq regulates egg-laying behavior via a PLCβ-independent and serotonin-dependent signaling pathway and likely functions both in the nervous system and in muscle. Genetics 165: 1805–1822. [DOI] [PMC free article] [PubMed] [Google Scholar]
- Berger, A. J., A. C. Hart and J. M. Kaplan, 1998. Gαs-induced neurodegeneration in Caenorhabditis elegans. J. Neurosci. 18: 2871–2880. [DOI] [PMC free article] [PubMed] [Google Scholar]
- Betz, A., M. Okamoto, F. Benseler and N. Brose, 1997. Direct interaction of the rat unc-13 homologue Munc13–1 with the N terminus of syntaxin. J. Biol. Chem. 272(4): 2520–2526. [DOI] [PubMed] [Google Scholar]
- Bos, J. L., 1989. ras oncogenes in human cancer: a review. Cancer Res. 49: 4682–4689. [PubMed] [Google Scholar]
- Bourne, H. R., 1997. How receptors talk to trimeric G proteins. Curr. Opin. Cell Biol. 9: 134–142. [DOI] [PubMed] [Google Scholar]
- Brenner, S., 1974. The genetics of C. elegans. Genetics 77: 71–94. [DOI] [PMC free article] [PubMed] [Google Scholar]
- Brundage, L., L. Avery, A. Katz, U. Kim, J. E. Mendel et al., 1996. Mutations in a C. elegans Gqα gene disrupt movement, egg laying, and viability. Neuron 16: 999–1009. [DOI] [PMC free article] [PubMed] [Google Scholar]
- Brunelli, M., V. Castellucci and E. R. Kandel, 1976. Synaptic facilitation and behavioral sensitization in Aplysia: possible role of serotonin and cyclic AMP. Science 194: 1178–1181. [DOI] [PubMed] [Google Scholar]
- Buechler, Y. J., F. W. Herberg and S. S. Taylor, 1993. Regulation-defective mutants of type I cAMP-dependent protein kinase. J. Biol. Chem. 268: 16495–16503. [PubMed] [Google Scholar]
- Chase, D. L., G. Patikoglou and M. R. Koelle, 2001. Two RGS proteins that inhibit Gαo and Gαq signaling in C. elegans neurons require a Gβ5-like subunit for function. Curr. Biol. 11: 222–231. [DOI] [PubMed] [Google Scholar]
- Chen, C., and W. G. Regehr, 1997. The mechanism of cAMP-mediated enhancement at a cerebellar synapse. J. Neurosci. 17: 8687–8694. [DOI] [PMC free article] [PubMed] [Google Scholar]
- Davis, G. W., A. DiAntonio, S. A. Petersen and C. S. Goodman, 1998. Postsynaptic PKA controls quantal size and reveals a retrograde signal that regulates presynaptic transmitter release in Drosophila. Neuron 20: 305–315. [DOI] [PubMed] [Google Scholar]
- Davis, R. L., J. Cherry, B. Dauwalder, P. L. Han and E. Skoulakis, 1995. The cyclic AMP system and Drosophila learning. Mol. Cell. Biochem. 149/150: 271–278. [DOI] [PubMed] [Google Scholar]
- DiAntonio, A., S. A. Petersen, M. Heckmann and C. S. Goodman, 1999. Glutamate receptor expression regulates quantal size and quantal content at the Drosophila neuromuscular junction. J. Neurosci. 19: 3023–3032. [DOI] [PMC free article] [PubMed] [Google Scholar]
- Doi, M., and K. Iwasaki, 2002. Regulation of retrograde signaling at neuromuscular junctions by the novel C2 domain protein AEX-1. Neuron 33: 249–259. [DOI] [PubMed] [Google Scholar]
- Hajdu-Cronin, Y. M., W. J. Chen, G. Patikoglou, M. R. Koelle and P. W. Sternberg, 1999. Antagonism between Goα and Gqα in C. elegans: the RGS protein EAT-16 is necessary for Goα signaling and regulates Gqα activity. Genes Dev. 13: 1780–1793. [DOI] [PMC free article] [PubMed] [Google Scholar]
- Hatley, M. E., B. K. Benton, J. Xu, J. P. Manfredi, A. G. Gillman et al., 2000. Isolation and characterization of constitutively active mutants of mammalian adenylyl cyclase. J. Biol. Chem. 275: 38626–38632. [DOI] [PubMed] [Google Scholar]
- Hepler, J. R., and A. G. Gillman, 1992. G proteins. Trends Biochem. Sci. 17: 383–387. [DOI] [PubMed] [Google Scholar]
- Hori, T., Y. Takai and T. Takahashi, 1999. Presynaptic mechanism for phorbol ester-induced synaptic potentiation. J. Neurosci. 19: 7262–7267. [DOI] [PMC free article] [PubMed] [Google Scholar]
- Kamath, R. S., M. Martinez-Campos, P. Zipperlen, A. G. Fraser and J. Ahringer, 2001 Effectiveness of specific RNA-mediated interference through ingested double-stranded RNA in Caenorhabditis elegans. Genome Biol. 2: RESEARCH0002. [DOI] [PMC free article] [PubMed]
- Kandel, E. R., 2001. The molecular biology of memory storage: a dialogue between genes and synapses. Science 294: 1030–1038. [DOI] [PubMed] [Google Scholar]
- Kandel, E. R., and C. Pittenger, 1999. The past, the future and the biology of memory storage. Philos. Trans. R. Soc. Lond. B Biol. Sci. 354: 2027–2052. [DOI] [PMC free article] [PubMed] [Google Scholar]
- Klattenhoff, C., M. Montecino, X. Soto, L. Guzman, X. Romo et al., 2003. Human brain synembryn interacts with Gsα and Gqα and is translocated to the plasma membrane in response to isoproterenol and carbachol. J. Cell. Physiol. 195: 151–157. [DOI] [PubMed] [Google Scholar]
- Koelle, M. R., and H. R. Horvitz, 1996. EGL-10 regulates G protein signaling in the C. elegans nervous system and shares a conserved domain with many mammalian proteins. Cell 84: 112–125. [DOI] [PubMed] [Google Scholar]
- Kohn, R. E., J. S. Duerr, J. McManus, A. Duke, T. L. Rakow et al., 2000. Expression of multiple UNC-13 proteins in the Caenorhabditis elegans nervous system. Mol. Biol. Cell 11: 3441–3452. [DOI] [PMC free article] [PubMed] [Google Scholar]
- Korswagen, H. C., J. Park, Y. Ohshima and R. H. Plasterk, 1997. An activating mutation in a Caenorhabditis elegans Gs protein induces neural degeneration. Genes Dev. 11: 1493–1503. [DOI] [PubMed] [Google Scholar]
- Korswagen, H. C., A. M. van der Linden and R. H. Plasterk, 1998. G protein hyperactivation of the Caenorhabditis elegans adenylyl cyclase SGS-1 induces neuronal degeneration. EMBO J. 17: 5059–5065. [DOI] [PMC free article] [PubMed] [Google Scholar]
- Kuromi, H., and Y. Kidokoro, 2000. Tetanic stimulation recruits vesicles from reserve pool via a cAMP-mediated process in Drosophila synapses. Neuron 27: 133–143. [DOI] [PubMed] [Google Scholar]
- Lackner, M. R., S. J. Nurrish and J. M. Kaplan, 1999. Facilitation of synaptic transmission by EGL-30 Gqα and EGL-8 PLCβ: DAG binding to UNC-13 is required to stimulate acetylcholine release. Neuron 24: 335–346. [DOI] [PubMed] [Google Scholar]
- Landis, C. A., S. B. Masters, A. Spada, A. M. Pace, H. R. Bourne et al., 1989. GTPase inhibiting mutations activate the α chain of Gs and stimulate adenylyl cyclase in human pituitary tumours. Nature 340: 692–696. [DOI] [PubMed] [Google Scholar]
- Lin, R. C., and R. H. Scheller, 2000. Mechanisms of synaptic vesicle exocytosis. Annu. Rev. Cell Dev. Biol. 16: 19–49. [DOI] [PubMed] [Google Scholar]
- Lyons, J., C. A. Landis, G. Harsh, L. Vallar, K. Grunewald et al., 1990. Two G protein oncogenes in human endocrine tumors. Science 249: 655–659. [DOI] [PubMed] [Google Scholar]
- Malenka, R. C., D. V. Madison and R. A. Nicoll, 1986. Potentiation of synaptic transmission in the hippocampus by phorbol esters. Nature 321: 175–177. [DOI] [PubMed] [Google Scholar]
- Maruyama, I. N., and S. Brenner, 1991. A phorbol ester/diacylglycerol-binding protein encoded by the unc-13 gene of Caenorhabditis elegans. Proc. Natl. Acad. Sci. USA 88: 5729–5733. [DOI] [PMC free article] [PubMed] [Google Scholar]
- Mello, C. C., J. M. Kramer, D. Stinchcomb and V. Ambros, 1991. Efficient gene transfer in C. elegans: extrachromosomal maintenance and integration of transforming sequences. EMBO J. 10(12): 3959–3970. [DOI] [PMC free article] [PubMed] [Google Scholar]
- Mendel, J. E., H. C. Korswagen, K. S. Liu, Y. M. Hajdu-Cronin, M. I. Simon et al., 1995. Participation of the protein Go in multiple aspects of behavior in C. elegans. Nature 267: 1652–1655. [DOI] [PubMed] [Google Scholar]
- Miller, K. G., and J. B. Rand, 2000. A role for RIC-8 (synembryn) and GOA-1 (Goα) in regulating a subset of centrosome movements during early embryogenesis in C. elegans. Genetics 156: 1649–1660. [DOI] [PMC free article] [PubMed] [Google Scholar]
- Miller, K. G., M. D. Emerson and J. B. Rand, 1999. Goα and diacylglycerol kinase negatively regulate the Gqα pathway in C. elegans. Neuron 24: 323–333. [DOI] [PMC free article] [PubMed] [Google Scholar]
- Miller, K. G., M. D. Emerson, J. McManus and J. B. Rand, 2000. RIC-8 (synembryn): a novel conserved protein that is required for Gqα signaling in the C. elegans nervous system. Neuron 27: 289–299. [DOI] [PMC free article] [PubMed] [Google Scholar]
- Moorman, C., and R. H. Plasterk, 2002. Functional characterization of the adenylyl cyclase gene sgs-1 by analysis of a mutational spectrum in Caenorhabditis elegans. Genetics 161: 133–142. [DOI] [PMC free article] [PubMed] [Google Scholar]
- Neer, E. J., 1995. Heterotrimeric G proteins: organizers of transmembrane signals. Cell 80: 249–257. [DOI] [PubMed] [Google Scholar]
- Ngsee, J. K., K. Miller, B. Wendland and R. H. Scheller, 1990. Multiple GTP-binding proteins from cholinergic synaptic vesicles. J. Neurosci. 10(1): 317–322. [DOI] [PMC free article] [PubMed] [Google Scholar]
- Nurrish, S., L. Segalat and J. M. Kaplan, 1999. Serotonin inhibition of synaptic transmission: Gαo decreases the abundance of UNC-13 at release sites. Neuron 24: 231–242. [DOI] [PubMed] [Google Scholar]
- Parfitt, K. D., and D. V. Madison, 1993. Phorbol esters enhance synaptic transmission by a presynaptic, calcium-dependent mechanism in rat hippocampus. J. Physiol. 471: 245–268. [DOI] [PMC free article] [PubMed] [Google Scholar]
- Rand, J. B., and M. L. Nonet, 1997 Synaptic transmission, pp. 611–643 in C. elegans II, edited by D. H. Riddle, T. Blumenthal, B. J. Meyer and J. R. Priess. Cold Spring Harbor Laboratory Press, Cold Spring Harbor, NY. [PubMed]
- Renden, R. B., and K. Broadie, 2003. Mutation and activation of Gαs similarly alters pre- and rostsynaptic mechanisms modulating neurotransmission. J. Neurophysiol. 89: 2620–2638. [DOI] [PubMed] [Google Scholar]
- Renger, J. J., A. Ueda, H. L. Atwood, C. K. Govind and C. F. Wu, 2000. Role of cAMP cascade in synaptic stability and plasticity: ultrastructural and physiological analyses of individual synaptic boutons in Drosophila memory mutants. J. Neurosci. 20: 3980–3992. [DOI] [PMC free article] [PubMed] [Google Scholar]
- Reynolds, N. K., M. A. Schade and K. G. Miller, 2005. Convergent, RIC-8-dependent Gα-signaling pathways in the Caenorhabditis elegans synaptic signaling network. Genetics 169: 651–670. [DOI] [PMC free article] [PubMed] [Google Scholar]
- Richmond, J. E., W. S. Davis and E. M. Jorgensen, 1999. UNC-13 is required for synaptic vesicle fusion in C. elegans. Nat. Neurosci. 2(11): 959–964. [DOI] [PMC free article] [PubMed] [Google Scholar]
- Richmond, J. E., R. M. Weimer and E. M. Jorgensen, 2001. An open form of syntaxin bypasses the requirement for UNC-13 in vesicle priming. Nature 412: 338–341. [DOI] [PMC free article] [PubMed] [Google Scholar]
- Rizo, J., and T. C. Sudhof, 2002. Snares and Munc18 in synaptic vesicle fusion. Nat. Rev. Neurosci. 3: 641–653. [DOI] [PubMed] [Google Scholar]
- Robatzek, M., and J. H. Thomas, 2000. Calcium/calmodulin-dependent protein kinase II regulates Caenorhabditis elegans locomotion in concert with a Go/Gq signaling network. Genetics 156: 1069–1082. [DOI] [PMC free article] [PubMed] [Google Scholar]
- Robatzek, M., T. Niacaris, K. Steger, L. Avery and J. H. Thomas, 2001. eat-11 encodes GPB-2, a Gβ5 ortholog that interacts with Goα and Gqα to regulate C. elegans behavior. Curr. Biol. 11: 288–293. [DOI] [PMC free article] [PubMed] [Google Scholar]
- Sassa, T., S. Harada, H. Ogawa, J. B. Rand, I. N. Maruyama et al., 1999. Regulation of the UNC-18-Caenorhabditis elegans syntaxin complex by UNC-13. J. Neurosci. 19: 4772–4777. [DOI] [PMC free article] [PubMed] [Google Scholar]
- Segalat, L., D. A. Elkes and J. M. Kaplan, 1995. Modulation of serotonin-controlled behaviors by Go in Caenhorabditis elegans. Nature 267: 1648–1651. [DOI] [PubMed] [Google Scholar]
- Shenker, A., L. S. Weinstein, A. Moran, O. H. Pescovitz, N. J. Charest et al., 1993. Severe endocrine and nonendocrine manifestations of the McCune-Albright syndrome associated with activating mutations of stimulatory G protein Gs. J. Pediatr. 123: 509–518. [DOI] [PubMed] [Google Scholar]
- Singer, W. D., H. A. Brown and P. C. Sternweis, 1997. Regulation of eukaryotic phosphatidylinositol-specific phospholipase C and phospholipase D. Annu. Rev. Biochem. 66: 475–509. [DOI] [PubMed] [Google Scholar]
- Sondek, J., D. G. Lambright, J. P. Noel, H. E. Hamm and P. B. Sigler, 1994. GTPase mechanism of G proteins from the 1.7-A crystal structure of transducin α-GDP-AlF. Nature 372: 276–279. [DOI] [PubMed] [Google Scholar]
- Sternweis, P. C., and J. D. Robishaw, 1984. Isolation of two proteins with high affinity for guanine nucleotides from membranes of bovine brain. J. Biol. Chem. 259: 13806–13813. [PubMed] [Google Scholar]
- Stevens, C. F., and J. M. Sullivan, 1998. Regulation of the readily releasable vesicle pool by protein kinase C. Neuron 21: 885–893. [DOI] [PubMed] [Google Scholar]
- Sunahara, R. K., C. W. Dessauer, R. E. Whisnant, C. Kleuss and A. G. Gilman, 1997. Interaction of Gsα with the cytosolic domains of mammalian adenylyl cyclase. J. Biol. Chem. 272: 22265–22271. [DOI] [PubMed] [Google Scholar]
- Suzuki, K., A. D. Grinnell and Y. Kidokoro, 2002. Hypertonicity-induced transmitter release at Drosophila neuromuscular junctions is partly mediated by integrins and cAMP/protein kinase A. J. Physiol. 538: 103–119. [DOI] [PMC free article] [PubMed] [Google Scholar]
- Tall, G. G., A. M. Krumins and A. G. Gilman, 2003. Mammalian Ric-8A (synembryn) is a heterotrimeric Gα protein guanine nucleotide exchange factor. J. Biol. Chem. 278: 8356–8362. [DOI] [PubMed] [Google Scholar]
- Taussig, R., and A. G. Gilman, 1995. Mammalian membrane-bound adenylyl cyclases. J. Biol. Chem. 270: 1–4. [DOI] [PubMed] [Google Scholar]
- Tesmer, J. J. G., R. K. Sunahara, A. G. Gillman and S. R. Sprang, 1997. Crystal structure of the catalytic domains of adenylyl cyclase in a complex with Gsα-GTPγS. Science 278: 1907–1916. [DOI] [PubMed] [Google Scholar]
- Timmons, L., D. L. Court and A. Fire, 2001. Ingestion of bacterially expressed dsRNAs can produce specific and potent genetic interference in Caenorhabditis elegans. Gene 263: 103–112. [DOI] [PubMed] [Google Scholar]
- Trudeau, L. E., D. G. Emery and P. G. Haydon, 1996. Direct modulation of the secretory machinery underlies PKA-dependent synaptic facilitation in hippocampal neurons. Neuron 17: 789–797. [DOI] [PubMed] [Google Scholar]
- van der Linden, A. M., F. Simmer, E. Cuppen and R. H. Plasterk, 2001. The G-protein β-subunit GPB-2 in Caenorhabditis elegans regulates the Goα-Gqα signaling network through interactions with the regulator of G-protein signaling proteins EGL-10 and EAT-16. Genetics 158: 221–235. [DOI] [PMC free article] [PubMed] [Google Scholar]
- Van Dop, C., M. Tsubokawa, H. R. Bourne and J. Ramachandran, 1984. Amino acid sequence of retinal transducin at the site ADP-ribosylated by cholera toxin. J. Biol. Chem. 259: 696–698. [PubMed] [Google Scholar]
- Vetter, I. R., and A. Wittinghofer, 2001. The guanine nucleotide-binding switch in three dimensions. Science 294: 1299–1304. [DOI] [PubMed] [Google Scholar]
- Waters, J., and S. J. Smith, 2000. Phorbol esters potentiate evoked and spontaneous release by different presynaptic mechanisms. J. Neurosci. 20: 7863–7870. [DOI] [PMC free article] [PubMed] [Google Scholar]
- Weimer, R. M., J. E. Richmond, W. S. Davis, G. Hadwiger, M. L. Nonet et al., 2003. Defects in synaptic vesicle docking in unc-18 mutants. Nat. Neurosci. 6: 1023–1030. [DOI] [PMC free article] [PubMed] [Google Scholar]
- Wicks, S. R., R. T. Yeh, W. R. Gish, R. H. Waterston and R. H. Plasterk, 2001. Rapid gene mapping in Caenorhabditis elegans using a high density polymorphism map. Nat. Genet. 28: 160–164. [DOI] [PubMed] [Google Scholar]
- Yoshihara, M., A. Ueda, D. Zhang, D. L. Deitcher, T. L. Schwarz et al., 1999. Selective effects of neuronal-synaptobrevin mutations on transmitter release evoked by sustained versus transient Ca2+ increases and by cAMP. J. Neurosci. 19: 2432–2441. [DOI] [PMC free article] [PubMed] [Google Scholar]
- Zhang, D., H. Kuromi and Y. Kidokoro, 1999. Activation of metabotropic glutamate receptors enhances synaptic transmission at the Drosophila neuromuscular junction. Neuropharmacology 38: 645–657. [DOI] [PubMed] [Google Scholar]
- Zhang, G., Y. Liu, A. E. Ruoho and J. H. Hurley, 1997. Structure of the adenylyl cyclase catalytic core. Nature 386: 247–253. [DOI] [PubMed] [Google Scholar]
- Zhong, Y., and C. F. Wu, 1991. Altered synaptic plasticity in Drosophila memory mutants with a defective cyclic AMP cascade. Science 251: 198–201. [DOI] [PubMed] [Google Scholar]
- Zhong, Y., V. Budnik and C. F. Wu, 1992. Synaptic plasticity in Drosophila memory and hyperexcitable mutants: role of cAMP cascade. J. Neurosci. 12: 644–651. [DOI] [PMC free article] [PubMed] [Google Scholar]